HAL Id: hal-02789393
https://hal.inrae.fr/hal-02789393
Submitted on 5 Jun 2020HAL is a multi-disciplinary open access archive for the deposit and dissemination of sci-entific research documents, whether they are pub-lished or not. The documents may come from teaching and research institutions in France or abroad, or from public or private research centers.
L’archive ouverte pluridisciplinaire HAL, est destinée au dépôt et à la diffusion de documents scientifiques de niveau recherche, publiés ou non, émanant des établissements d’enseignement et de recherche français ou étrangers, des laboratoires publics ou privés.
To cite this version:
. Inra, . Irta, . Topigs Norsvin, . Ifip. New traits to select for feed efficiency. [Contract] D5.2, 2019. �hal-02789393�
Page 1/55
FEED-A-GENE
Adapting the feed, the animal and the feeding techniques to
improve the efficiency and sustainability of monogastric livestock
production systems
Deliverable D5.2
New traits to select for feed efficiency
Due date of deliverable: M48
Actual submission date: M48
Start date of the project: March 1
st, 2015
Duration: 60 months
Organisation name of lead contractor: INRA
Revision: V5
Dissemination level
Public - PU
X
Confidential, only for members of the consortium (including Commission
Services) - CO
Page 2/55
Table of contents
1.
Summary ... 4
2.
Introduction ... 7
3.
Results ... 8
3.1
Genetic variance of new feed efficiency traits ... 8
3.1.1
Feed efficiency ... 8
Estimates of heritability of feed intake in rabbits ... 8
Genetic of digestive efficiency ... 8
o Biomarkers of digestive efficiency in broilers ... 9
o Genetic determinism of digestive efficiency in pigs ... 10
Reproductive efficiency... 13
o Recording feed intake in group-housed gestating sows – variability and relation with reproduction traits in conventional systems ... 14
o Feed intake in Duroc sows during gestation and lactation, relationship with lactation efficiency ... 15
o Recording feed intake during lactation in Iberian sows – variability and relation with litter traits in alternative lines ... 19
3.1.2
Behaviour and activity ... 21
Aggressiveness and feed efficiency in pigs ... 22
Feeding behaviour and social hierarchy in group housed animals ... 24
o Feeding behaviour and feed efficiency in Duroc pigs ... 24
o Effects of feed intake behaviour on feed efficiency in pigs ... 27
3.1.3
Welfare and robustness indicators ... 28
Welfare indicators and feed efficiency in Duroc population ... 28
Genetic of feed efficiency and robustness in pigs ... 31
3.2
Genetic background of feed efficiency ... 35
3.2.1
Whole genome studies using genotype to phenotype association.... 35
Page 3/55
Association studies: associations between genomic variants and feed
efficiency traits or its components (growth rate, feed intake, digestibility) .. 37
o Detecting associations on growth and feed efficiency traits in rabbits ... 37
o Detecting associations on feeding traits recorded at the cage level ... 39
o Associations studies on digestibility traits in broilers ... 41
3.2.2
Expression studies ... 44
Identifying genes for which the expression is affected by selection for
feed efficiency and by breeding conditions in layers ... 44
Expression studies divergent lines in pigs, biological relationships
between feed efficiency and responses to stressors ... 45
4.
Conclusions ... 50
5.
Annexes ... 51
5.1
Composition of experiment diets for the pig digestibility trial ... 51
5.2
References ... 52
Page 4/55
1. Summary
Objectives. Selection in monogastric species is applied to pure lines in selection farms, while commercial animals are crossbreds raised in diverse conditions. Improving feed efficiency in these populations is a key to enhance the productivity and limit the environmental footprint of livestock production. However, recording feed efficiency is costly in most species because it requires measuring feed intake, and this trait is affected by genotype by environment interactions (GxE) that makes it a different trait in selection and commercial populations. Major gains in genetic progress could thus be achieved if more animals had records for feed intake or feed efficiency, and if these measurements could be obtained from any farm. Identifying new traits for selection of feed efficiency is thus crucial to improve the prediction accuracy of breeding values in livestock populations.
Depending on the species, measuring feed efficiency on-farm is a difficult issue: individual feeders for pigs have been available on-farm for long. They are costly to acquire and maintain, but at least they provide reference measurements in most populations. Poultry and rabbits still rely on measurements made in individual cages. This type of measurement is not representative for the performance of animals raised in groups, and is questioned in terms of welfare. Thus, our objectives were:
1. To test direct measures of feed intake and feed efficiency for genetic designs after the development of electronic feeders in WP2 for rabbits
2. To evaluate measures of components of feed efficiency (i.e., digestibility, activity and behaviour, robustness), which could be used to select more efficiently individuals dedicated to different breeding conditions when GxE is large. A major effort was undertaken to understand the contribution of the gut microbiota to feed efficiency and its potential as a criterion for selection, which is reported in a separate deliverable (D5.1)
3. To identify biological markers of feed efficiency and their components that could be measured on a large number of individuals at a moderate cost, potentially on production farms, so that selection accuracy for production conditions could be improved.
Rationale. To respond to these objectives, data and technologies from WP2 (i.e., new traits for feed efficiency) and new trials were combined to evaluate feed efficiency under a wide range of conditions, including different feed resources, different breeding systems, and different physiological stages of the animal. Indeed, reproduction has long been ignored when considering feed efficiency issues, while it has a major impact on management of body reserves and on female longevity. To ensure that the proposed solutions would not have a negative impact on other production traits of interest, indicators of robustness and product quality were recorded.
Classical genetic methodologies have been applied, either by comparing genetic lines selected for the trait of interest for multiple generations so that the genetic difference between animals for this trait has been established (i.e., the residual feed intake (RFI) lines in pigs, rabbits and layers) and the correlated response on other traits or indicators can be measured, or by measuring the traits in large cohorts of conventional populations (i.e., Large White and crossbred pigs, Caldes rabbits) or alternative lines (i.e., Duroc and Iberian pigs). When using selected lines, the genetic aspect of the response can be observed directly by comparing the mean line responses, whereas in large pedigreed cohorts,
Page 5/55
animal linear mixed models were applied to estimate genetic variances and heritabilities. To detect genomic markers associated with the traits of interest, the same animal linear mixed models can be used, including a SNP effect in iterative tests along the genome. Because feed intake is sometimes not available at the individual level, an original model based on a bivariate development of the same linear model was tested in rabbits to detect associated SNP with traits recorded in groups. Finally, multivariate models dedicated to the simultaneous analysis of large number of variables were used in transcriptomic studies to account for the number of repeated tests and the specificity of these data. In a first set of analyses, new traits could be validated as heritable in the tested populations. For growing animals, these traits include measures of components of feed efficiency, such as feed intake records measured by automatic feeders in rabbits and digestibility indicators measured in group-housed pigs (i.e., through direct NIRS prediction) and in poultry (i.e., though indirect prediction via serum absorbance). The digestive efficiency in pigs was tested with a conventional and with a high dietary fibre diet, and the analysis showed that within the range of digestibility values explored, no strong genotype-by-diet interaction was observed for digestibility. Although digestive efficiency was strongly correlated with feed efficiency, some moderate adverse correlations were estimated with other production traits (i.e., carcass yield and meat quality traits). In reproductive females, using individual feed intake data from gestating sows appeared to be difficult in genetic studies, especially in relation with different management systems of the sows. In one study, a reasonable variability seemed to be available (Large White pigs in a French farm) whereas very little variability was observed in a second dataset for this period (Duroc pigs in a Spanish farm). Larger and more diverse datasets would be necessary to explore how and when management limits the expression of genetic variability in this period, so a more complete analysis could be envisaged. However in Duroc sows, records of lactation traits led to estimations of the genetic variability of feed intake and feed efficiency during this period. Despite a limited number of feed intake records, the estimates were high enough to envisage selection on these traits with a limited additional phenotyping effort. Additionally and for the first time, an estimation of the genetic variability of feed intake and feed efficiency during lactation in Iberian sows was provided. Finally, some components of feed efficiency, such as behaviour, activity, welfare, and robustness were also considered, as they can positively or negatively contribute to feed efficiency. Because direct measures of activity were not available, indirect indicators were considered. The first type of indicators focused on traces of interactions on the animal’s body. However, only few traits had high enough heritabilities and correlation with feed efficiency to be used to refine the accuracy of actual estimations. The second type of indicators were derived from automatic feeder records of animal activity: feeding behaviour traits were shown to be heritable (e.g., number of visits and feeding rate) and they had some genetic correlations with production traits. In the two datasets explored, correlations were higher with feed intake than with feed efficiency. In addition, feeding patterns could be used, either empirically or via a ranking approach, to propose indicators of the animal hierarchy in the pens. Interestingly, the more dominant animals are not necessarily more efficient. This novel aspect needs further analysis to be used in selection. Finally, welfare indicators were measured in the blood and in pig hair. Blood cell counts seemed to have promising genetic correlations with feed efficiency traits, which need to be explored further. Robustness indicators were tested in divergent lines, following the hypothesis that more efficient individuals would be less robust. The hypothesis was not sustained by the experiment, which was consolidated by a mirror experiment in which divergent animals for robustness were compared for their feed efficiency, with no deleterious effect of selection for robustness on the production traits.
Page 6/55
In a second set of analyses, biological markers of feed efficiency at the genomic and the transcriptomic levels were identified. A first strategy, based on the sequencing of divergent layer lines, allowed the identification of 145 SNP differing between lines and candidates to be associated with feed efficiency. In rabbits, first analyses of a recently available SNP chip were run in two different populations. Four to five genomic regions were associated to the trait variability in each population, with no common region. In broilers, the genomic associations with digestibility traits indicated 12 significant SNPs. A few genes were identified as potential candidates for these regions, which needs further validation. Finally, expression studies were run between divergent lines to identify the biological pathways involved in the line differences in response to different treatments, as well as to identify biomarkers in layers and in pigs. In layers, the animals were slaughtered and multiple tissues with a potential impact on feed efficiency were sampled. In pigs, serial measurements were applied to blood samples. In both cases, some genes were identified as responsible for the differences between the lines. However, the genes were partly diet- or time-dependent and the way they contribute to the base difference versus the treatment difference needs to be explored further to propose biomarkers dedicated to specific situations.
Teams involved: INRA, IRTA, TOPIGS NORSVIN, IFIP
Species and production systems considered: pigs, rabbits, broilers, and layers were considered, including conventional populations and alternative populations (i.e., Iberian pigs)
Page 7/55
2. Introduction
Identifying new traits for selection for feed efficiency is crucial to improve selection accuracy in livestock populations. Depending on the species, measuring feed efficiency on-farm is a difficult issue: individual feeders for pigs have been available on-farm for long, whereas poultry and rabbits still rely on measurements in individual cages. This type of measurement is not completely representative for the performance of animals raised in groups, and is questioned in terms of welfare. From a breeder’s point of view, accurate prediction of feed efficiency of crossbred animals in production environments is another issue, as this trait is influenced by GxE interactions. Thus, our objectives were:
1. To test direct measures of feed intake and feed efficiency for genetic designs using the electronic feeders developed in WP2 for rabbits and broilers
2. To evaluate measures of the components of feed efficiency (e.g., digestibility, activity and behaviour, and robustness), which could be used to select more efficient individuals on these components if GxE is important.
A major effort was undertaken to understand the contribution of the gut microbiota to feed efficiency and its potential for selection, which is reported in a separate deliverable (D5.1)
3. To identify biological markers of feed efficiency and their components that could be measured on a large number of individuals at a moderate cost, potentially on production farms, so that selection accuracy in production conditions could be improved.
To respond to these objectives, data and technologies from WP2 (i.e., new traits for feed efficiency), and new trials were combined to evaluate feed efficiency under a wide range of conditions, including different feed resources, different breeding systems, and different physiological stages of animals. To ensure that the proposed solutions would not have a negative impact on other production traits of interest, indicators of robustness and product quality were also recorded.
Page 8/55
3. Results
3.1 Genetic variance of new feed efficiency traits
3.1.1 Feed efficiency
Estimates of heritability of feed intake in rabbits
Experimental design. Using the data of 268 rabbits documented in deliverable D2.3 for the design of the individual feeders in rabbits, individual average daily feed intake (ADFI) and average daily gain (ADG) recorded in 2018 were used to obtain first estimates of heritabilities of these two traits, considering only one generation of relationships between animals. Table 1 presents the raw statistics for these traits by batch, together with the phenotypic correlation between ADFI and ADG within batch Table 1. Raw statistics for average daily feed intake (ADFI) and average daily gain (ADG) recorded in three batches in 2018.
Batch (AI date) N ADFI* (g/d) ADG (g/d) FCR* Correlation (ADFI-ADG)
1 90 139.8 47.7 2.9 0.51
2 106 129.3 49.5 2.6 0.35
3 72 143.3 49.8 2.9 0.31
* ADFI and FCR were computed using only valid visits to the feeder.
Results and discussion. Table 2 shows the variance components and heritability estimates of the traits, estimated using an animal model, using litter and cage as random effects, in addition to the additive genetic random effect. The EM-REML heritability estimate for ADFI was 0.29.
Table 2. Variance components and heritability estimates for average daily feed intake (ADFI) and average daily gain (ADG).
Source ADG (g/d) ADFI (g/d)
Cage 23.55 33.65 Litter 0.25 2.20 Additive 39.35 95.91 Residual 20.46 196.1 Phenotypic 83.61 327.86 h2 0.47 0.29
A breeding program directly considering both ADFI and ADG, or alternatively considering an index reflecting the individual efficiency of the animals (e.g., feed conversion ratio (FCR) or residual feed intake (RFI)) can thus be envisaged. As indicated in deliverable D2.3, although validated individual feed intake records seem to show a downward bias of the actual feed intake, we expect these records to be accurate enough to estimate accurate breeding values and rank individuals for their potential for feeding traits in breeding programs to improve feed efficiency (i.e., reduce feed intake while increasing growth).
Genetic of digestive efficiency
Most commercial breeds in pig and poultry are selected for feed efficiency using high-quality feeds. These feeds are easy to digest, and provide sufficient energy and all required nutrients so that animals
Page 9/55
can express their growth potential. If including alternative feedstuffs (e.g., by-products from the agrofood industry) in feeds may be a solution to reduce costs and enhance the use of locally grown crops, it may also alter the ability of animals to convert efficiently feed into muscle, especially when feed ingredients are difficult to digest and the nutrients supply becomes limiting. Hence, digestive efficiency can be novel trait to exploit for further improving the feed efficiency in growing animals. In broilers, variability in digestive efficiency among animals have been proven to exist when they are fed alternative feedstuff (e.g., a challenge diet), part of which can be explained by genetics (Grasteau et
al., 2004, 2010). A near-infrared spectrophotometry (NIRS) technique has been developed to assess
digestive efficiency in chickens, which offers a great potential to improve the digestive efficiency by measuring this trait in large numbers of animals. However, this technique still requires the total collection of faeces and thus to rear animals in individual cages, which raises welfare concerns. It also generates genotype-by-environment interactions, as animals are normally reared in groups and on the floor. Alternative indicators of digestive efficiency that could be measured in group-housed animals on the floor were therefore evaluated, to measure larger cohorts of animals in normal rearing conditions. In pigs, preliminary studies suggest that a genetic variation in digestive efficiency might exist (Noblet
et al., 2013). To test this hypothesis, a methodology was developed in WP2 (deliverable D2.5) allowing
individual prediction of nutrient digestibility based on NIRS analysis of faeces collected at a single point in time in animals kept in groups. It alleviates many of the constraints imposed by the gold standard method to measure digestibility (i.e., the use of metabolic cages to collect all faeces of pigs during a period of time, followed by extensive laboratory analyses to determine the nutrient and energy contents in both the feed and the faeces). This new NIRS-based method was tested as a high-throughput phenotyping method for digestibility on large cohorts of pigs reared in selection farms, comparing responses to a conventional and a fibrous diet.
o Biomarkers of digestive efficiency in broilers
Experimental design. The use of metabolome data to predict digestive efficiency has been evaluated in WP2 (task 2.5). Models built on a limited number of animals (N=60) showed that the most predictive criterion was absorbance of blood serum at 492 nm. To validate this trait for breeding, serum was collected from 417 animals of a medium-growing meat-type broiler line. Blood was sampled as 3 weeks of age, age at which the link between serum absorbance and digestive efficiency was shown to be maximum. The absorption spectra were acquired every 2 nm between 342 nm and 572 nm using an Infinite M200 spectrophotometer. Digestive efficiency was assessed by measuring the apparent metabolisable energy (AMEn). Genetic analyses was performed using the VCE6.0 software (Neumaier and Groeneveld, 1998; Groeneveld et al., 2010), using an animal model including fixed effects of hatch, rearing cell, sex, and plate for analysis of serum absorbance.
Results. Figure 1 shows the heritability of absorbance of blood serum between 342 and 572 nm, the genetic correlation between AMEn and absorbance, and the expected response of AMEn to selection of serum colour for each wavelength. Taking into account these genetic parameters, the most interesting criterion was serum colour at 492 nm, with a heritability estimated at 0.31±0.09, and a genetic correlation with AMEn estimated at 0.84±0.28. The genetic correlation between serum absorbance and body weight was not significantly different from 0 between 382 and 522 nm (0.29±0.27 at 492 nm).
Page 10/55
Figure 1. Genetic parameters of serum colour and expected response of apparent metabolisable energy (AMEn) to selection of serum colour.
Main discussion points and conclusion. Taking into account these parameters, the most interesting biomarker to be used to select AMEn is serum absorbance at 492 nm as, with a heritability estimated at 0.31±0.09 and a genetic correlation with AMEn estimated at 0.84±0.28, it provides the highest expected response to selection (Figure 1). These results have been submitted for publication (Mignon-Grasteau et al., 2018). The next steps will be to validate this criterion on a larger number of genotypes and diets.
o Genetic determinism of digestive efficiency in pigs
Experimental design. A sample collection was set up to estimate the genetic parameters of digestive efficiency traits in growing pigs and quantify their genetic relationships with feed efficiency and other selected traits (i.e., carcass composition and meat quality). Two different diets were used to evaluate the genotype-by-diet interaction for these measurements: a conventional diet (CO) and an alternative diet (HF) that had a higher crude fibre content due to the addition of various fibrous by-products (i.e., wheat bran, soybean hulls, and dehydrated sugar beet pulp). Both diets had a composition close to those used in WP2 (deliverable D2.5, feed formula in Annex 1), which describes the development of the methodology to estimate digestive efficiency. The trial was carried out at the France Génétique Porc test station (Le Rheu, France) as part of the national breeding test of the Large White population. In total, 1,598 purebred Large White animals entered the station between February 2017 and July 2018 in 29 successive batches of about 56 animals (i.e., 4 pens of 14 animals). Couples of full sibs (entire males) from ten different breeding herds were tested with the two diets. Individuals were grouped at weaning, shipped to the test station to receive the same feed until 9 weeks of age (i.e., until the start of the growing phase). Then, full sibs were separated and each pen received either the CO or the HF diet until the end of the test (120 kg). Individual feed intake and body weight were recorded automatically with electronic feeders and automatic scales. Those records allowed calculating individual average daily feed intake (ADFI), average daily gain (ADG) and feed conversion ratio (FCR) from 35 kg to 120 kg. Faecal samples were collected from every pig at an average weight of 65 kg, and were immediately frozen at -20°C. All animals were slaughtered when they reached 120 kg live weight. Carcass and meat quality traits (i.e., lean meat content, carcass yield, ultimate pH of the ham) were
0 0,1 0,2 0,3 0,4 0,5 0,6 0,7 0,8 0,9 1 340 360 380 400 420 440 460 480 500 520 540 560 580 Wavelength (nm) Expected response to selection Heritability of serum colour Genetic correlation between serum colour and AMEn
Page 11/55
recorded. Faecal samples were processed following the protocol provided in deliverable D2.5 and analysed using a near-infrared spectrophotometer. For each animal, individual digestibility coefficients for energy, organic matter, and nitrogen were predicted.
Results.
Consistently with results obtained in deliverable D2.5, the digestibility coefficients of energy and nitrogen were reduced by 5 to 6 points with the HF diet compared to the CO diet, meaning that animals digested less energy and nitrogen when more dietary fibres were provided (Figure 2). However, the variability of digestibility coefficients was similar for both diets. Within each diet, digestibility coefficients of energy, nitrogen, and organic matter were highly correlated (>0.80), suggesting that animals that digested best energy were also the best ones at digesting nitrogen and organic matter.Figure 2. Mean digestibility coefficients of energy, nitrogen and organic matter estimated for pigs fed the conventional (CO) and high-fibre (HF) diet (***: P<0.01).
The HF diet had a clear impact on the mean of all traits, except for meat quality. The HF diet also affected the variability of traits related to feed efficiency (i.e., ADFI, FCR, and digestibility coefficients). In brief, animals fed the HF diet had on average a significantly lower growth rate (-54 g/day) and a higher ADFI (+157 g/day), resulting in a decreased FCR (+0.26 kg feed/kg live weight). In addition, animals fed the HF diet were leaner (LMC: +1.72%), potentially in relation with the effect of dietary fibre on the feed intake capacity of the animals, and had a lower carcass yield (-1.48%). This is in line with earlier studies in relation with increased intestinal transit rate resulting in development of the digestive tract (Montagne et al., 2014).
Heritabilities
Traits measured in pigs fed the CO and the HF diets were analysed as different traits to estimate the genetic correlations between traits recorded on different diets.
Digestive efficiency was moderately to highly heritable for energy, nitrogen, and organic matter, meaning that some families of pigs digest feed more efficiently than do others (Table 3). Digestive efficiency coefficients were more heritable in the HF feed, as reported in broilers. For all other traits, estimated heritabilities were consistent with previously published estimates for both CO and HF diets: i.e. moderate to high values for growth, feed efficiency, and carcass traits and low to moderate values for meat quality traits.
Page 12/55
Table 3. Heritability estimated for digestibility coefficients for both conventional (CO) and high-fibre (HF) diets (estimated standard errors in parentheses).
Digestibility coefficient Heritability – CO diet Heritability – HF diet
Energy 0.41 (0.14) 0.62 (0.17)
Organic matter 0.43 (0.14) 0.64 (0.17)
Nitrogen 0.50 (0.15) 0.70 (0.17)
Genetic correlations estimated between digestibility coefficients of energy, nitrogen, and organic matter, and other feed efficiency and carcass traits are given in Table 4 for the CO diet and in Table 5 for the HF diet. With both diets, digestibility coefficients of energy, nitrogen, and organic matter had negative (i.e., unfavourable) genetic correlations with ADG. On the contrary, genetic correlations between digestibility coefficients of energy, nitrogen, and organic matter were high and negative (i.e., favourable) with both ADFI and FCR. Hence, whatever the diet considered, families of pigs able to digest efficiently will genetically tend to have lower ADFI and FCR, but also a lower ADG. Genetic correlations between digestibility coefficients and lean meat content were different depending on the diet. They were moderate and favourable when using the conventional diet, and close to 0 when using the HF diet. With both diets, digestibility coefficients were slightly negatively (i.e., unfavourably) correlated with carcass yield. Finally, genetic correlations estimated between digestibility coefficients and meat quality traits were moderate and unfavourable. However, given the low heritability of meat quality traits, the estimation accuracy of those parameters was very low. More data would be needed to refine these estimations of genetic correlations between meat quality trait and digestive efficiency. Table 4. Genetic correlations estimated between digestibility coefficients, feed efficiency, and carcass traits for pigs fed the conventional diet (estimated standard errors in parentheses).
Digestibility
coefficient ADG ADFI FCR LMC CY uPH
Energy -0.52 (0.23) -0.83 (0.17) -0.75 (0.27) 0.26 (0.11) -0.24 (0.11) NE Organic matter -0.53 (0.23) -0.83 (0.16) -0.74 (0.27) 0.29 (0.11) -0.21 (0.11) NE Nitrogen -0.56 (0.22) -0.60 (0.27) -0.50 (0.25) 0.18 (0.10) -0.18 (0.10) -0.42 (0.40)
ADG: average daily gain; ADFI: daily feed intake; FCR: feed conversion ratio; LMC: lean meat content; CY: carcass yield; uPH: ultimate pH of the ham; NE: not estimated.
Table 5. Genetic correlations estimated between digestibility coefficients, feed efficiency, and carcass traits for pigs fed the high-fibre diet (estimated standard errors in parentheses).
Digestibility
coefficient ADG ADFI FCR LMC CY uPH
Energy -0.65 (0.24) -0.63 (0.23) -0.62 (0.23) 0.03 (0.09) -0.12 (0.08) -0.45 (0.39) Organic matter -0.58 (0.24) -0.59 (0.16) -0.33 (0.40) 0.12 (0.09) -0.11 (0.08) -0.44 (0.39) Nitrogen -0.53(0.23) -0.57 (0.22) -0.51 (0.25) 0.16 (0.08) -0.15 (0.07) -0.51 (0.36)
ADG: average daily gain; ADFI: daily feed intake; FCR: feed conversion ratio; LMC: lean meat content; CY: carcass yield; uPH: ultimate pH of the ham.
To evaluate how pig performance would evolve due to selection on digestibility coefficients, the phenotypic differences between the CO progeny of the 25% highest and 25% lowest sires ranked on their average breeding value was calculated for digestibility coefficients of energy and nitrogen (Table 6). Phenotypes of progeny were pre-corrected for usual fixed effects. The phenotypic differences between groups were standardised by the phenotypic standard deviation (σp) of the traits to make
Page 13/55
1.5 to 1.6 genetic standard deviations for digestibility coefficients of nitrogen and energy, respectively, which corresponds to a difference of digestibility of about 2.8% for nitrogen and 3% for energy. At their progeny level, as expected, a marked phenotypic difference (around 80% σp) was observed for
digestibility coefficients between the two groups of progeny. The progeny of the 25% best sires were more feed-efficient, especially due to lower feed intakes (-61% σp), though their ADG was reduced to
a lower proportion (-27% σp). The progeny of the 25% highest sires were slightly leaner than the other
group (+16% σp), and they also had a lower carcass yield (-12% σp) and ultimate pH (-16% σp). These
results confirm that selecting pigs for digestive efficiency should improve feed efficiency traits. However, carcass yield and meat quality traits should also be accounted for in breeding objectives to avoid altering these traits.
Table 6. Phenotypic differences between progeny groups of the 25% highest and 25% lowest sires ranked on their average breeding value for digestibility of energy and nitrogen.
Trait1 Phenotypic difference between
groups of progeny Difference standardised by phenotypic s.d. ADG, g/d -20.78 -27% FCR, kg/kg -0.07 -44% ADFI , g/d -128.6 -61% Energy digestibility, % 1.96 +83% Nitrogen digestibility, % 2.20 +77%
Organic matter digestibility, % 1.81 +83%
Lean meat content, % 0.36 +16%
Carcass yield, % -0.15 -12%
Ultimate pH (ham) -0.028 -16%
1ADG: average daily gain; FCR: feed conversion ratio; ADFI: daily feed intake.
Conclusions. Following methodological developments in WP2, the genetic determinism of digestive efficiency was characterised for the first time in growing pigs. The digestive efficiency of energy, organic matter, and nitrogen are heritable, meaning that there are opportunities to increase this(these) trait(s) by selection. High favourable genetic correlations were estimated with feed efficiency traits whatever the diet. Small to moderate adverse genetic relationships were identified with carcass yield and meat quality traits. The measure can be used routinely in breeding schemes of commercial pig breeds at a very moderate cost. It is possible to breed animals able to digest efficiently different feedstuffs, especially the more fibrous ones, to increase their robustness to variable feed composition.
After this proof of concept, the sensitivity of the genetic parameters to the feed and sampling conditions should be examined. In addition, the economic impact of feeding alternative feedstuffs can be evaluated from our results, to optimize the overall efficiency of a production system.
Reproductive efficiency
No clear measurements of feed efficiency during the reproduction lifetime of the females have been documented. The main factor limiting progresses in this domain is the absence of routine measurements of feed intake, body weight, and indicators of the body composition of the females and the litter in most production systems. However, some data during lactation have been recorded in conventional systems, and measures of single lactation efficiency have been proposed (Bergsma et al.,
Page 14/55
2008; Gilbert et al., 2012). The difficulty of obtaining individual feeding data in group-housed sows during gestation, and developing models to extract genetic variances from these data is a dimension that we dealt with here. It is common practice to apply a feed restriction to gestating sows according to parity and backfat thickness at the beginning of gestation, which might limit the opportunities to identify variability of genetic origin. When automatic feeders are available, the evaluation of the sow (feeding) behaviour could provide an insight in the biology of their reproductive efficiency.
o Recording feed intake in group-housed gestating sows – variability and relation with reproduction traits in conventional systems
Experimental design. Large White sows raised in the Genesi INRA experimental facility (France) were considered for this study. Each pen with a capacity for 50 sows was equipped with an automatic feeder, and sows were identified individually with an RFID ear-tag. A feed restriction depending on backfat thickness and parity was applied based on a backfat measurement at beginning of gestation. This feeding plan was adjusted 30 d after artificial insemination based on the body condition of the sow. In the last third of lactation, all sows had their daily ration increased by 500 g. Data were available until 105 days of gestation, when the sows were moved to the lactation pens. The sow parity varied from 1 to 6, including a total of 375 gestation events. Feeders had doors at the entrance so that sows were not disturbed by other sows when eating. Sows had access to the feeder without restriction but the feeding trough closed when they had their total ration for the day, creating non-feeding visits. Data editing and analysis were performed with the R software. Models for feeding data included fixed effects such as backfat thickness at the start of the period and type of feeding ration provided to the sow for the day. Only sows with complete records were used in the analysis.
Results. Daily data showed that sows with more visits at the feeder spent the shortest total time at the feeder each day of gestation (phenotypic correlation rp=-0.66±0.04) and had a lower feed intake
at each visit (rp=-0.59±0.05); their feeding rate per visit did not differ from that of sows having fewer
visits at the feeder each day. The phenotypic correlations between feeding activity during gestation and lactation performance are shown in Table 7. The total number of visits at the feeder during the entire gestation period was positively correlated to the number of piglets weaned in the subsequent lactation, but was independent of litter size, litter weight, and sow body weight loss in the subsequent lactation. Positive and favourable correlations were obtained for the time spent at the feeder at each visit and the mean time spent at the feeder per visit in gestation with litter performance, except a negative correlation for the time spent at the feeder at each visit with the number of piglets weaned. Sows that consumed more feed per visit during gestation produced larger and heavier litters both at farrowing and at weaning, and lost more body weight to sustain the next lactation. Inversely, feed intake per visit and average time spent at the feeder per visit were negatively correlated with the number of piglets weaned. The feeding rate during gestation was negatively correlated with litter size and litter weight at weaning.
Page 15/55
Table 7. Phenotypic correlations between feeding traits in gestation and lactation performance in a French Large White population (standard errors in parentheses).
Trait NBA NBT LWB NBW LWW SWD NV_G -0.028 (0.058) -0.028 (0.058) 0.003 (0.058) 0.382 (0.053) 0.089 (0.058) 0.085 (0.058) FI_G 0.287 (0.055) 0.287 (0.055) 0.523 (0.049) 0.172 (0.057) 0.388 (0.053) 0.597 (0.047) FI_V 0.272 (0.055) 0.272 (0.055) 0.419 (0.052) -0.168 (0.057) 0.203 (0.057) 0.383 (0.054) TF_G 0.299 (0.055) 0.299 (0.055) 0.539 (0.048) 0.137 (0.057) 0.437 (0.052) 0.524 (0.05) TF_V 0.252 (0.056) 0.252 (0.056) 0.389 (0.053) -0.242 (0.056) 0.209 (0.056) 0.283 (0.056) FR_G -0.15 (0.057) -0.15 (0.057) -0.046 (0.057) -0.218 (0.056) -0.145 (0.057) 0.029 (0.058)
NBA: number of piglets born alive; NBT: number of piglets born in total; LWB: litter weight at birth; NBW: number of piglets weaned; LWW: litter weight at weaning; SWD: sow body weight difference between beginning and end of lactation; NV: number of visits; FI: feed intake; TF: time spent at the feeder; FR: feeding rate; _G: in gestation; _V: per visit.
Conclusions. During gestation, sows mainly had one feeding visit per day, so that visits can be used as elementary records. At the phenotypic level, some lactation performance traits were moderately associated with the feeding activity during gestation. Sows having more visits at the feeder (i.e., those with a higher activity at the feeder during gestation), were capable of weaning more piglets in the subsequent lactation. No incidence of performing more visits on litter size and litter weight was detected. Sows eating at lower rate in gestation appear to have better performance in lactation. Given the variability and correlations observed in this pilot study, the genetic relationships will now be investigated on a larger data set from the same population to evaluate if the detected correlations have a genetic basis or reflect the sow management.
o Feed intake in Duroc sows during gestation and lactation, relationship with lactation efficiency
Experimental design. Data came from a Duroc population selected for prolificacy and backfat thickness at the end of the fattening period. They corresponded to two parities from 677 sows recorded from May 2015 to May 2016, distributed in 25 batches. During gestation, sows were housed in groups and were given once a day 2.16 kg of a standard diet containing 8.73 MJ of net energy, a minimum of 125 g of crude protein, 70 g crude fibre, and 6.6 g of total lysine per kg feed. About a week before parturition, sows were transferred to farrowing pens. Feed intake was limited to a maximum of 3 kg before farrowing. During lactation, sows were fed twice a day a standard feed containing 9.73 MJ of net energy, 166 g of crude protein, 9 g of total lysine, and a minimum of 49.1 g of crude fibre per kg feed. The feed supply was determined from the sow’s feed intake during the previous day: it was increased when the sow finished her ration the day before, and was kept constant or reduced otherwise. The minimum and maximum amount of feed supplied daily were 2.22 and 9.62 kg/d, respectively. Daily patterns of feed intake are shown in Figure 3.
Automatic feeders were available in this farm only for group-housed sows from day 40 to 105 of gestation. Data recorded between 105 days of gestation and farrowing were eliminated to limit the high variability in feed intake during the pre-parturition time. A study of the best manual recording
Page 16/55
pattern of feed intake for the other periods (early gestation and lactation) was first run to estimate the genetic parameters of feed intake during gestation and lactation, and their relationship with prolificacy traits. This preliminary evaluation indicated that feed intake during early gestation (i.e., until approximately 40 days of gestation) and during the lactation period could be manually recorded once or twice per week with no decrease in estimation accuracies. For missing daily records, daily feed intake was predicted using a 3rd order Legendre Polynomial function. Missing feed intake records
during late gestation were predicted using a 6th order Legendre Polynomial function. Daily feed intake
was calculated for early gestation (from day 1 to day 40 of gestation, FI1-40), late gestation (from day
41 to day 105 of gestation, FI41-105), and lactation (FIlac). Feed intake during late gestation was divided
into FI41-80 (from day 41 to day 80 of gestation), and FI81-105 (from day 81 to day 105 of gestation). FI1-40
and FI81-105 were highly variable, whereas FI41-80 had very low variability (Figure 3).
Figure 3. Average daily feed intake recorded in the Duroc dataset, and modelled via Legendre polynomial functions to retrieve missing values.
These traits were used to compute lactation efficiency in this population. Traits involved in lactation efficiency quantify energy inputs and outputs during lactation. Energy sources for a lactating sow are feed intake (daily lactation feed intake; FIlac) and changes of body reserves during lactation (i.e.,
resulting in bodyweight and backfat changes). Available energy can be used for sow growth and maintenance, and for milk production. Milk production is usually quantified by litter weight gain. Therefore, daily changes in sow weight and daily backfat (i.e., total change divided by the duration of the lactation) are variables that quantify the balance of body reserves during lactation, which is negative whenever the sow loses weight and/or fat, and positive otherwise. Other traits involved in the definition of lactation feed efficiency are pre-farrow traits, which are those measured before farrowing (i.e., sow weight, backfat thickness and litter weight at farrowing) that may have an impact on sow lactation performance and are included as covariates in the analysis of all other traits. All these traits were combined as proposed by Gilbert et al. (2012) to produce a sow residual feed intake (sow RFI) indicative of the sow efficiency during lactation.
Results. Heritability estimates for feed intake traits were generally low, and ranging from 0.025 to 0.069 for ADFI during gestation. For lactation ADFI, heritability was higher and estimated at 0.12, which is lower than previously published heritabilities for this trait (0.26 Gilbert et al., 2012, to 0.30 Bergsma
Page 17/55
Figure 4. Posterior means of the variance component parameters (h2= heritability, P2=proportion of variance explained by the permanent environment of the sow) estimated for the feed intake traits during gestation and lactation.
Positive genetic correlations were obtained between feed intake during mid-late gestation and FIlac
(Table 8). Positive genetic correlations were obtained between feed intake during early-middle gestation (0.99-0.64) traits and the number of piglets born alive. Nearly null genetic correlation between the number of piglets born alive and FIlac was obtained (0.09).
Table 8. Posterior means of genetic, permanent and residual correlations of feed intake and the number of born alive during lactation with feed intake during the previous gestation (posterior standard deviations are given in parenthesis).
Genetic Permanent Residual
FIlac NBA FIlac NBA FIlac NBA
FI1-40 0.14 (0.27) 0.99 (0.0.1)* -0.78 (0.27)* 0.37 (0.49) -0.03 (0.05) -0.02 (0.04)
FI41-80 0.63 (0.31)* 0.64 (0.31)* -0.26 (0.59) 0.11 (0.61) -0.02 (0.06) -0.04 (0.05)
FI81-105 0.82 (0.25)* 0.45 (0.30) -0.31 (0.51) 0.39 (0.58) -0.01 (0.06) -0.06 (0.05)
FI41-105 0.81 (0.27)* 0.45 (0.31) -0.10 (0.42) 0.50 (0.63) -0.02 (0.06) -0.06 (0.05)
FI1-105 -0.35 (0.54) 0.68 (0.26)* -0.74 (0.31)* 0.27 (0.53) 0.04 (0.05) 0.01 (0.04)
FIlac: feed intake during lactation; NBA: number of piglets born alive; FIn-m: feed intake between days n and m of gestation.
* Values significantly different from zero.
Genetic parameters for lactation efficiency and related traits showed low to moderate heritability for feed efficiency during lactation (sow RFI heritability posterior mean [posterior sd] = 0.14±0.06) and its components (Table 9). The highest values were found for daily changes in body weight of the sow (0.28±0.08) and the litter (0.22±0.05). Both FIlac and change of backfat had a low heritability (<0.14).
The lower value found for FIlac in this study compared with previously reported values is probably due
to the inaccuracy of our measurements, which was conditioned by the way feed was supplied. In previous studies, data were recorded daily, whereas they were recorded for one or two days per week and predicted with a nonlinear model for the other days in our study. Given the noise in the daily-recorded data, the resulting prediction might not be accurate enough to compensate for the missing structure. Another important difference is that our heritability estimate of sow RFI is slightly higher than that of FIlac, while in the aforementioned study (Gilbert et al., 2012) the former reverse was
observed. Sow RFI results from the difference between FIlac and predicted lactation feed intake based
on traits defining energy and nutrient requirements of the lactating sow. The covariance structure between FIlac and the predictor traits for the sow requirements were different in our study compared
to those reported in other lines and studies (Bergsma et al., 2008; Gilbert et al., 2012). The low heritability estimate for the change of backfat during lactation could be explained by a low accuracy in the measurement of the backfat thickness. In addition to the classical operator effect on this trait, it is particularly difficult to record in furry animals, such as is the Duroc population. The resulting
Page 18/55
measurement error for backfat thickness would be 1 to 1.5 mm, which is 40 to 60% of backfat thickness balance variability during lactation. The proportions of phenotypic variance due to the permanent effect of the sow were moderate for energy inputs (i.e. lactation feed intake, changes in sow bodyweight and backfat) and low for daily litter weight gain and sow residual feed intake.
Table 9. Posterior means of variance components and ratios of phenotypic variance (posterior standard deviations are given in parenthesis).
Parameter2 FI
lac1 dSWB1 dBFB1 dLWG1 Sow RFI1
𝝈𝒂𝟐 0.014 (0.005) 0.059 (0.018) 0.0001 (0.0003) 0.015 (0.004) 0.016 (0.007) 𝝈𝒑𝟐 0.027 (0.006) 0.049 (0.016) 0.0001 (0.0003) 0.009 (0.003) 0.012 (0.007) 𝝈𝒆𝟐 0.119 (0.009) 0.102 (0.010) 0.002 (0.0001) 0.045 (0.003) 0.087 (0.007) 𝒉𝟐 0.088 (0.029) 0.279 (0.076) 0.133 (0.042) 0.216 (0.052) 0.141 (0.061) 𝒑𝟐 0.169 (0.035) 0.234 (0.077) 0.155 (0.031) 0.131 (0.049) 0.104 (0.064) 1 FI
lac: daily lactation feed intake; dSWB: daily sow body weight balance; dBFB: daily backfat thickness balance; dLWG: daily
litter weight gain; RFI = residual feed intake.
2 𝜎
𝑎2: Additive variance; 𝜎𝑝2: Permanent variance; 𝜎𝑒2: Residual variance; h2= heritability; p2: permanent environmental
variation relative to phenotypic variation.
Phenotypically, FIlac was positively associated with daily balances of energy and nutrient reserves and
litter weight gain (Table 10). Therefore, the more a sow eats during lactation the less she mobilises body reserves (i.e., resulting in body weight and backfat thickness changes) and the more she provides nutrients for litter weight gain. An increase in sow body weight changes was to an associated increase in changes in backfat (0.32±0.04), and to a decrease in litter weight gain (-0.26±0.04). In the same way, an increase in backfat thickness corresponded to a decrease in litter weight (-0.17±0.04). This means that increased mobilisation of body reserves is related to increased litter growth. Phenotypic and environmental correlations between FIlac and change of backfat thickness were null.
Table 10. Posterior means (posterior sd) of phenotypic (rp, above the diagonal) and genetic (rg, below
the diagonal) correlations.
rg\rp FIlac dSWB dBFB dLWG
FIlac1 1 0.289 (0.034) 0.056 (0.038) 0.171 (0.035)
dSWB1 0.306 (0.197) 1 0.324 (0.037) - 0.258 (0.037)
dBFB1 - 0.745 (0.124) 0.192 (0.206) 1 - 0.171 (0.037)
dLWG1 0.255 (0.199) - 0.441 (0.192) - 0.082 (0.197) 1
1 FIlac: daily lactation feed intake; dSWB: daily sow weight change; dBFB: daily backfat thickness change; dLWG: daily litter
weight gain.
Daily lactation feed intake was highly correlated with change of backfat thickness (-0.75±0.12, Table 10). The genetic correlation between sow body weight change and litter weight gain was negative and moderate (-0.44±0.19). Daily sow weight and backfat thickness changes were phenotypically but not genetically correlated. The precision of our estimates of genetic correlations was low because of the limited number of records. Other genetic correlations were low and not statistically different from zero.
Conclusion. This study is a first attempt to obtain feed intake traits during gestation and lactation in a Duroc population, to estimate genetic parameters of traits involved in feed efficiency during lactation. The Duroc population of pigs has a genetic origin very different from those previously studied, which were Large White based populations (Gilbert et al., 2012; Bergsma et al., 2008). The restricted feeding applied during gestation resulted in a low variability of gestation feeding traits, with little room to study the genetic variance during gestation. During lactation, trait heritabilities were low to moderate, and
Page 19/55
their magnitude could be high enough to guarantee a positive response to selection to improve feed efficiency during lactation. However, the limited accuracy of our estimates suggests that complete daily records of feed intake would help to reach higher accuracies
o Recording feed intake during lactation in Iberian sows – variability and relation with litter traits in alternative lines
Iberian pigs are a local population of pigs used for their excellent meat quality. Until recently, they have not been subjected to any efficiency index assessment. The modern Iberian production system relies on piglet production farms that have the same characteristics as conventional piglet production facilities. From these maternity conventional farms, weaned piglets are moved to growing-fattening facilities, which pertain to one of the two following systems: combining two intensive growing and fattening phases, based exclusively on conventional feeds, or a growing phase with conventional feeds and a fattening period in the “Dehesa”, where pigs have access to grass and acorns. In the first system, crossbred Iberian x Duroc animals are used, while in the other system, purebred Iberian are normally used. We aimed to characterize the lactation efficiency of Iberian sows and to explore the potential value of different lactation traits in breeding goals of the population.
Experimental design. Sows from two different Iberian lines were tested: 219 “Entrepeladas” (EE) and 229 “Retintas” (RR). Both groups were housed in the same farm, in the conventional system common to the maternity farms. A total of 1,157 lactation records were obtained, distributed in 30 batches. In each lactation, body weight and backfat thickness of the sow at the entrance to the maternity and at weaning, litter weight at parturition and at weaning, and prolificacy measurements (i.e., total born, number born alive and number of live piglets at weaning) were recorded, plus sow and piglet feed intake during the lactation. The heritability of all traits were estimated separately in the two populations; then they were combined into different lactation efficiency traits. Repeatability linear animal models adjusted for the body weight and backfat thickness of the sow at farrowing and for a year-season, and sow parity effect were used to estimate the genetic parameters.
Page 20/55
Table 11. Descriptive statistics and variance components estimates for Entrepelada line (EE).
Trait (unit) Mean s.d. n Variance h² genetic permanent residual
Total born (piglets) 8.61 2.07 524 1.32E-01 5.65E-01 3.35 0.03 Born alive (piglets) 8.26 1.99 524 5.68E-02 4.40E-01 3.22 0.02 Number at weaning (piglets) 7.13 1.08 505 5.94E-02 8.74E-02 1.01 0.05
Lactation length (d) 25.94 4.34 505 -- -- -- --
Backfat thickness at farrowing (mm) 31.75 12.57 487 -- -- -- -- Backfat thickness at weaning (mm) 28.44 12.23 479 6.45 2.37 23.6 0.20 Backfat thickness change (mm/d) -0.14 0.24 420 4.52E-03 2.63E-04 3.92E-02 0.10 Sow body weight at farrowing (kg) 141.86 21.81 524 -- -- -- -- Sow body weight at weaning (kg) 136.15 19.73 515 7.19 3.37 43.6 0.13 Daily body weight change (kg/d) -0.22 0.34 499 1.05E-02 5.23E-03 6.53E-02 0.13 Litter weight at farrowing (kg) 10.12 2.35 384 9.02E-01 2.18E-01 3.81 0.18 Litter weight at weaning (kg) 37.57 9.49 505 9.20 3.97 68.4 0.11 Piglet body weight gain (kg/d) 0.16 0.03 376 1.70E-04 7.66E-06 8.16E-04 0.17 Sow lactation feed intake (kg) 106.10 20.08 509 7.90E-01 1.47E+01 348 0.00 Sow lactation feed intake (kg/d) 4.10 0.21 501 1.32E-03 1.56E-03 4.02E-02 0.03 Lactation feed conversion ratio 4.20 1.82 373 1.46E-02 9.89E-02 3.23 0.00
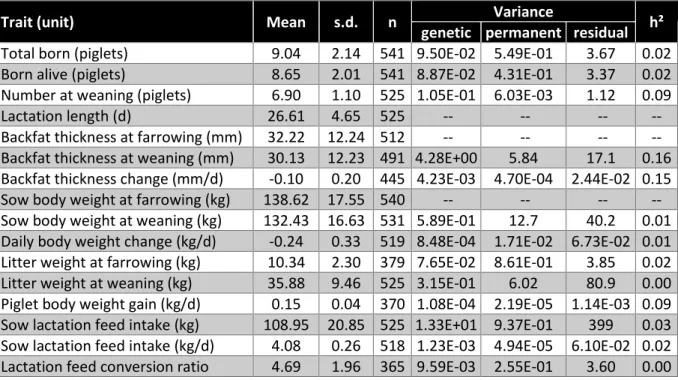
Results and Discussion. Tables 11 and 12 show the descriptive statistics of the analysed traits in each line, and the variance components for the considered traits. The Entrepelada line had lower prolificacy (total born and born alive) than the Retinta line. However, the superior maternal abilities of the Entrepelada line led to slightly greater number of weaned piglets and greater litter weight gain. This was consistent with earlier studies in these lines (Noguera et al., 2016, Ibañez-Escriche et al., 2014). The daily feed intake in Entrepelada sows was 120 grams per day more than in the Retinta sows (i.e., 0.5 phenotypic standard deviation. The lactation FCR was 10% better in Entrepelada sows than in Retinta sows (4.20 vs 4.69 kg feed/kg litter gain). The Retinta sows were slightly lighter than the Entrepelada sows, but given the large variability of individual body weights, the average difference (3-4 kg) was not significant. In both lines, the body weight change during lactation was similar. The Retinta sows were slightly fatter than Entrepelada females, and lost less backfat during lactation (2.1 and 3.3 mm for Retinta and Entrepelada sows, respectively).
Page 21/55
Table 12. Descriptive statistics and variance components estimates for Retinta line (RR).
Trait (unit) Mean s.d. n Variance h² genetic permanent residual
Total born (piglets) 9.04 2.14 541 9.50E-02 5.49E-01 3.67 0.02 Born alive (piglets) 8.65 2.01 541 8.87E-02 4.31E-01 3.37 0.02 Number at weaning (piglets) 6.90 1.10 525 1.05E-01 6.03E-03 1.12 0.09
Lactation length (d) 26.61 4.65 525 -- -- -- --
Backfat thickness at farrowing (mm) 32.22 12.24 512 -- -- -- -- Backfat thickness at weaning (mm) 30.13 12.23 491 4.28E+00 5.84 17.1 0.16 Backfat thickness change (mm/d) -0.10 0.20 445 4.23E-03 4.70E-04 2.44E-02 0.15 Sow body weight at farrowing (kg) 138.62 17.55 540 -- -- -- -- Sow body weight at weaning (kg) 132.43 16.63 531 5.89E-01 12.7 40.2 0.01 Daily body weight change (kg/d) -0.24 0.33 519 8.48E-04 1.71E-02 6.73E-02 0.01 Litter weight at farrowing (kg) 10.34 2.30 379 7.65E-02 8.61E-01 3.85 0.02 Litter weight at weaning (kg) 35.88 9.46 525 3.15E-01 6.02 80.9 0.00 Piglet body weight gain (kg/d) 0.15 0.04 370 1.08E-04 2.19E-05 1.14E-03 0.09 Sow lactation feed intake (kg) 108.95 20.85 525 1.33E+01 9.37E-01 399 0.03 Sow lactation feed intake (kg/d) 4.08 0.26 518 1.23E-03 4.94E-05 6.10E-02 0.02 Lactation feed conversion ratio 4.69 1.96 365 9.59E-03 2.55E-01 3.60 0.00 Only backfat related traits had heritabilities different from zero in both lines. In the Entrepelada line, the sow body weight at weaning and body weight change also had significant heritabilities. In this line, litter weights and piglets growth rates had heritabilities estimates greater than 0.1. Feed intake traits did not show relevant heritability (<0.03). Thus, based on our results, no direct improvement of lactation efficiency could be obtained in these lines. Nevertheless, improvement of backfat traits, which are heritable in both lines, may indirectly benefit feed efficiency traits. Given the number of records, the accuracy of correlation estimates would be too low to conclude on this aspect and additional data will be needed to propose a selection strategy on these aspects.
Conclusion. The two Iberian populations studied differed in lactation performance: one had better prolificacy, whereas the other one had better maternal behaviour. The tested lactation feed efficiency trait was not heritable and cannot be proposed as a selection criterion in these lines. However, other traits contributing to lactation efficiency showed significant heritabilities, so alternative strategies via indirect improvement of efficiency can be envisaged.
3.1.2 Behaviour and activity
Activity of growing animals can be seen as an element of welfare when positive behaviour is expressed (e.g., when the animal explores its environment or interacts with pen mates), but also as a source of energy expenditure at the expense of feed efficiency (Meunier-Salaun et al., 2014). Understanding how these traits (i.e., welfare, activity, and efficiency) interact at the genetic level is thus a key to contribute to improving feed efficiency while not impairing them. However, measuring activity remains a challenge. In task 2.2 of the project, effort have been dedicated to measuring activity in group-housed animals through video recording. However, no satisfactory way could be found to ensure individual identification, a key element in genetic studies. The genetics of behaviour and activity in relation to feed efficiency were thus explored via two indirect measurements: recording of body lesions (as a proxy for aggressive behaviour) and recording feeding behaviour using electronic feeders, with the
Page 22/55
objective to evaluate their potential to contribute to a more accurate selection for feed efficiency. When possible, indicators of the social hierarchy in the pen were evaluated as potentially novel traits contributing to feed efficiency. A Duroc population was used to assess the two types of records, based on developments made in WP2 of the project, whereas a conventional population was used to assess feeding behaviour only.
Aggressiveness and feed efficiency in pigs
Experimental design. Body lesions were recorded 3-4 times during the fattening period, following the welfare quality protocol (http://www.welfarequalitynetwork.net/media/1018/pig_protocol.pdf). Each individual pig was scored for the presence of lesions on the ears, head, body, hind-quarter, and legs. In two batches, all the animals in a number of pens were recorded, while in two other batches, 3 to 4 animals were scored in each pen. For each animal, the number of lesions at each location and the total number of lesions were analysed, resulting in a total of 304 lesion scores (Table 13).
Table 13. Average number of lesions recorded per pig in each batch at each location.
Batch N Ear Head Body Hind-quarters Legs
1 67 0.79 0.19 0.33 0.15 0.16
2 47 0.83 0.64 0.40 0.23 0.02
4 63 0.59 0.35 0.35 0.25 0.02
5 127 0.26 0.17 0.24 0.10 0.01
Table 14. Descriptive data on interactions recorded between pigs.
Batch N Fight Head-hitting Bite Chase Initiated Received Initiated Received Initiated Received Initiated Received
1 67 0.16 0.16 2.27 2.27 0.58 0.55 0.06 0.06
2 68 0.00 0.00 0.49 0.50 0.09 0.09 0.04 0.04
4 70 0.13 0.14 1.39 1.36 0.40 0.41 0.00 0.00
5 127 0.10 0.10 1.08 1.10 0.29 0.28 0.02 0.02
During the fattening period, three to four interaction records were obtained per pen. Each pen was evaluated for 20 minutes, during which all antagonistic interactions are registered. The following interactions were considered for each animal initiating or receiving an action: chasing, biting, fighting, and head hitting. For all animals involved in the different interactions, the total number of initiated or received actions were obtained. Records for a total of 332 individuals were available (Table 14).
Page 23/55
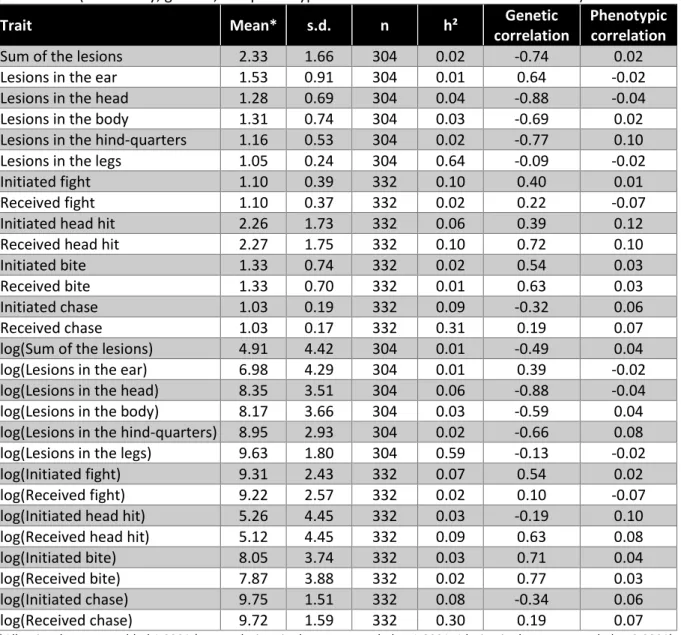
Table 15. Descriptive statistics of lesions and interaction traits (initiated or received), and genetic parameters (heritability, genetic, and phenotypic correlations with residual feed intake).
Trait Mean* s.d. n h² Genetic
correlation
Phenotypic correlation
Sum of the lesions 2.33 1.66 304 0.02 -0.74 0.02
Lesions in the ear 1.53 0.91 304 0.01 0.64 -0.02
Lesions in the head 1.28 0.69 304 0.04 -0.88 -0.04
Lesions in the body 1.31 0.74 304 0.03 -0.69 0.02
Lesions in the hind-quarters 1.16 0.53 304 0.02 -0.77 0.10
Lesions in the legs 1.05 0.24 304 0.64 -0.09 -0.02
Initiated fight 1.10 0.39 332 0.10 0.40 0.01
Received fight 1.10 0.37 332 0.02 0.22 -0.07
Initiated head hit 2.26 1.73 332 0.06 0.39 0.12
Received head hit 2.27 1.75 332 0.10 0.72 0.10
Initiated bite 1.33 0.74 332 0.02 0.54 0.03
Received bite 1.33 0.70 332 0.01 0.63 0.03
Initiated chase 1.03 0.19 332 0.09 -0.32 0.06
Received chase 1.03 0.17 332 0.31 0.19 0.07
log(Sum of the lesions) 4.91 4.42 304 0.01 -0.49 0.04
log(Lesions in the ear) 6.98 4.29 304 0.01 0.39 -0.02
log(Lesions in the head) 8.35 3.51 304 0.06 -0.88 -0.04
log(Lesions in the body) 8.17 3.66 304 0.03 -0.59 0.04
log(Lesions in the hind-quarters) 8.95 2.93 304 0.02 -0.66 0.08
log(Lesions in the legs) 9.63 1.80 304 0.59 -0.13 -0.02
log(Initiated fight) 9.31 2.43 332 0.07 0.54 0.02
log(Received fight) 9.22 2.57 332 0.02 0.10 -0.07
log(Initiated head hit) 5.26 4.45 332 0.03 -0.19 0.10
log(Received head hit) 5.12 4.45 332 0.09 0.63 0.08
log(Initiated bite) 8.05 3.74 332 0.03 0.71 0.04
log(Received bite) 7.87 3.88 332 0.02 0.77 0.03
log(Initiated chase) 9.75 1.51 332 0.08 -0.34 0.06
log(Received chase) 9.72 1.59 332 0.30 0.19 0.07
*All trait values were added 1.0001 (e.g., no lesions in the ear was coded as 1.0001, 1 lesion in the ear was coded as 2.0001), to account for zero values in the descriptive statistics of the records and log transformed values.
Bivariate linear mixed models combining these behavioural traits with a feed efficiency trait (i.e., RFI) were fitted to estimate their genetic relationships with feed efficiency. All models included the fixed effects of the batch and sex (i.e., female or castrated male), the covariates of age at live weight recording and number of pen mates, and the random litter, pen, and additive genetic effects. Heritabilities of behavioural traits and their genetic correlation with residual feed intake were estimated. The traits were considered in their original scale (counts) and also transformed to a logarithmic scale to better fit the assumption of Gaussian residuals.
Results and Discussion. The most frequent lesions were observed on the ears (Table 13), with an average of 0.53 lesions per pig. Considering ear lesions as a binary trait (because each animal has or does not have a lesion), ear lesions were observed in 33% of the pigs. For head and body lesions, the frequency was around 20%, and hind-quarter lesions occurred with a frequency of 11%.
The action that more frequently occurred were the hits with the head (Table 14). One particular animal started this antagonist behaviour up to 10 times during the observation period. If the trait is treated
Page 24/55
as a binary trait (an animal providing or not at least one hit with its head to another pig), its frequency was as high as 53%. The second most frequent antagonistic action was biting, with a frequency of 21%. Table 15 presents raw averages and standard deviations of the lesions and behavioural traits. The heritability estimates and genetic correlations with RFI are also shown. In the different bivariate analyses, all the available RFI data were considered. Similar genetic parameters were obtained for the traits with their original units (counts) and the log-transformed traits. The highest estimated heritability (0.64) was estimated for the lesions in the legs, which had very low incidence, so it should be considered with caution, as estimates for initiated and received chasing events. The phenotypic correlations of other lesions traits with residual feed intake were close to zero, and their heritabilities are lower than 0.05. Because the genetic variances were small for these traits, the genetic correlations with residual feed intake were estimated with very low accuracy and should not be further considered. Similar conclusions arose from estimates of interaction traits, but for the number of received head hits, which had the highest incidence (Table 14). For this trait, the heritability was 0.10, and the genetic and phenotypic correlation estimates with residual feed intake were positive. Thus, the less genetically efficient animals would carry over genetic effects that increase the incidence of receiving head hits from their pen mates. No clear antagonist genetic correlation between RFI and initiated head hits was identified, with a genetic correlation positive on the natural trait scale and a negative and low correlation (-0.19) on the logarithm scale. No reciprocal relationship with feed efficiency was apparent for that type of behaviour.
Conclusions. These preliminary analyses show that visually recorded lesions and antagonistic behaviours are of limited value to improve feed efficiency through genetic selection. Only the most frequent antagonistic behaviour (i.e., number of received head hits) provided a relevant genetic correlation with feed efficiency. Nevertheless, statistical analyses accounting for the trait distribution specificities (e.g., large number of zeros) could reveal additional useful genetic variability.
Feeding behaviour and social hierarchy in group housed animals
Feeding behaviour traits are automatically recorded by electronic feeders on animals raised in groups. They reflect a within-pen dynamics of eating behaviour. From a genetic perspective, it could be possible to use this information either through a relevant genetic correlation with other performance traits, or because the phenotypic/genetic relationship between these traits explains the within-pen social structure of the animals.
o Feeding behaviour and feed efficiency in Duroc pigs
Experimental design. The study was conducted in a Duroc population (N=1,144 pigs from 10 batches), using traits obtained using electronic feeders. The base records were the visit duration to the feeder and the associated feed intake, together with the time when the visit started for each pig visiting the feeder. The traits computed for the feeding behaviour analysis were average daily eating rate, daily feeding frequency, occupation time, and time between consecutive visits. Table 16 presents descriptive statistics of these traits, together with statistics for four base performance traits.