SYNTHESIS, CHARACTERIZATION AND PROPERTIES OF
NEW LOW-VALENT PALLADIUM AND PLATINUM
CLUSTERS OF DIARSINE AND DIISOCYANEDE LIGANDS
by
Tiaale Zhang
A thesis presented to the Departement de chimie
in fulfillment of the requirements for
the degree ofPhilosophiae Doctor (Ph.D.)
FACULTE DES SCIENCES
UNIVERSITE DE SHERBROOKE
1*1
National Library of Canada Acquisitions and Bibliographic Services 395 Wellington Street Ottawa ON K1AON4 Canada Bibliotheque Rationale du Canada Acquisitions et services bibliographiques 395, rue Wellington Ottawa ON K1AON4 CanadaYour file Volre reference
Our tile Notre reference
The author has granted a
non-exclusive licence allowing the
National Library of Canada to
reproduce, loan, distribute or seU
copies of this thesis in microform,
paper or electronic formats.
The author retains ownership of the
copyright in this thesis. Neither the
thesis nor substantial extracts from it
may be printed or otherwise
reproduced without the author's
permission.
L'auteur a accorde une Ucence non
exclusive permettant a la
Bibliotheque nationale du Canada de
reproduire, prefer, distribuer ou
vendre des copies de cette these sous
la fonne de microfiche/fihn, de
reproduction surpapier ou sur format
electronique.
L'auteur conserve la propriete du
droit d'auteur qui protege cette these.
Ni la these ni des extraits substantiels
de celle-ci ne doivent etre miprimes
ou autrement reproduits sans son
autonsation.
Le 7 f/ £rf J2.£~ ,lei
jury suivant a accepte cette these dans sa version finale.date
President-rapporteur: M. Jean Lessard Departement de chimie Membre: Membre: Membre exteme: M. Hugues Menard
Departement de chimie
M. Pierre D. Harvey Departement de chunie M. Andre Beauchamp Universite deMontreal^/^ ^6^/
/fy^^y
/ A^L^^i. ' C\^VY^^
^r
t
'(^t^C^SUMMARY
The low-valent palladium and platinum clusters have been the topic of long standing interest because of their intriguing bonding and excellent catalytic properties. In this project, diarsine
(dpam=bis(diphenylarsino)methane) and diisocyanide (dmb=l,8-diisocyano-p-menthane)
ligands have been used to build the low-valenf palladium and platinum clusters, based upon the different purposes. Two kinds of clusters (polyhedral and linear chain clusters) have been successfully synthesized and fully characterized.
Direct reduction of Pd(CHsCOO)2 in acetone by CO in the presence of a mixture of dpam, CFsCOOH and water, gave a trinuclear cluster, [Pd3(dpam)3((-i3-CO)]2+. The crystal structure determined by X-ray crystallography, is isomorphous with that of the dppm analogue, but the size of the cavity formed by six phenyl groups adopting axial configuration, is large, where one PF6~ anion is located inside. The binding constants of this modified host system were measured by UV-vis spectroscopy, and compared with those of the dppm analogue. Interestingly the binding constant values for the larger hosts are always larger for the same sub strate-solvent system, which clearly shows a direct consequence of the increase in the
cavity size induced by long Pd-As (-2.42 A) bond length (Pd-P:~2.32 A). The large PF6'
anion, also binds weakly to [Pd3(dpam)3(u3-CO)] , which does not bind to the dppm
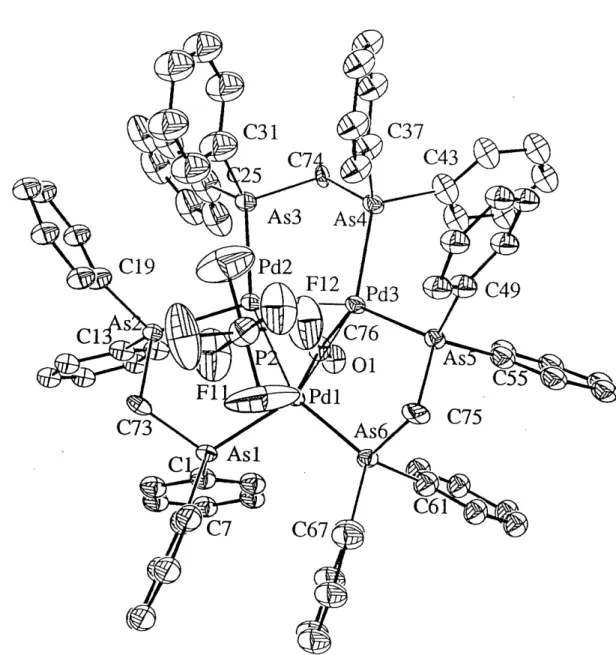
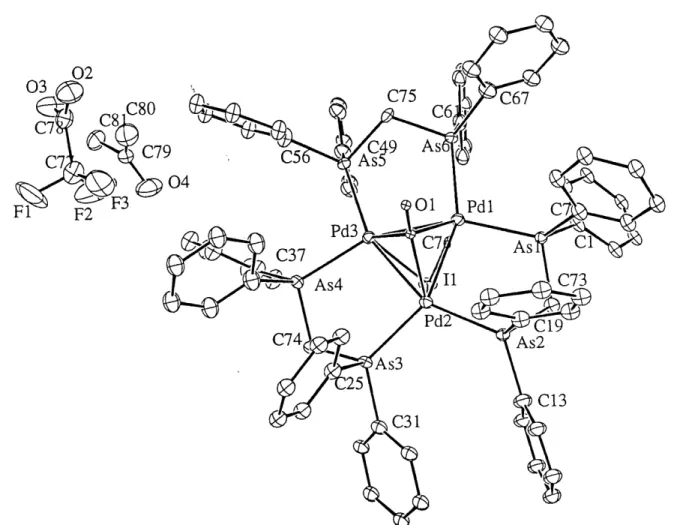
analogue. Further this cluster reacts with I' to give the expected cluster adduct, [Pd3(dpam)3(U3-CO)(H3-I)r, where a trigonal bipyramid structure is observed. But in the presence of 62, an unexpected oxidation-fragmentation reaction occurs and leads to the breakdown to a dinuclear complex, [Pd2(dpam)2l4], as identified from X-ray crystallography.
In this case, dpam ligands coordinate the Pd(II) centers in a bridging fashion, not in a
chelating mode as commonly encountered for dppm in mononuclear complex, [Pd(dppm)X2]
(X = Cl, Br, Cl). The long distance ofPd-Pd (3.3896(9) A) indicates that there is no weak
The reduction ofPt(dpam)(CF3COO)2 by CO in a mixture ofmethanol and water leads to the
preparation of a 58-electron "butterfly" cluster, [Pt4(dpam)3((J.2-CO)3(ri -dpam)] , as a CFsCOO' salt. The PF6' salt is easily prepared by metathesis of the anions. The crystal structure was determined by X-ray crystallography, in which two edge sharing Pts triangles are found (a large and a small triangle). In the small one, the average Pt-Pt distance is 2.626 A; in the large one, the distance increases to 2.69 A. In solution, the fluxionality occurs, which was confirmed by variable-temperature measurements of H NMR spectra. At low temperature (T< 193 K), the spectra become complex, indicating the loss of3-fold symmetry. The spectra also confirmed that there are two isomers in solution. It was proposed that the +2 charge is located on the small triangle based upon the comparisons with the crystal data of a series of related clusters in literature. This cluster is luminescent at 77K, but not at room temperature. The luminescence is a phosphorescence, and the emission lifetime (Te) is 3.2 ± 0.2 [is. The electronic spectroscopic properties have been rationalized by EHMO
computations.
The preparation of a tetranuclear platinum complex containing linear metal-metal chain has been achieved by the direct reaction between Pt2(dba)3-CHCl3 and an excess ofdmb. The air-stable complex, [Pt4(dmb)4(PPh3)2]Cl2 was isolated as a red-orange crystalline solid. The crystal structure was determined by X-ray crystallography, where four Pt atoms are connected through short metal-metal bonds ( 2.654, 2.641 and 2.666 A) and form a linear chain (ZPtPtPt = 175.3°). A catenate structure was observed where the two Pt2(dmb)2 units (20-member ring) interlock each other to form this unique structure. The Pd analogue was synthesized in the same way. Pd2(dba)3-CHCl3 was used instead ofPt2(dba)3-CHCl3, where the bond distance ofPd-Pd is about 2.53 A. Both clusters are isostructural. This chemistry has been expanded to the polymers containing [M4(dmb)4] units (M = Pd, Pt). The organometallic
polymers, {[Pt4(dmb)4]-diphosphine}n (Ph2P-(CH2)x-PPh2, x = 4, 5, 6; dppb, dppp, dpph,
respectively) complexes, have been synthesized, where the [Pt4(dmb)4] units are connected by
addressed by X-ray powder diffraction, Ti ( C NMR spin-lattice relaxation time) and viscosity measurements. In one case, {[Pd4(dmb)5]2+}n has been characterized from X-ray
crystallography. In this structure, the [Pd4(dmb)4J units are linked by dmb ligand adopting
Z-shaped conformation to form one-dimensional chain. In the unit, the catenade structure
remains. The distances of the Pd-Pd bonds are longer than those in [Pd4(dmb)4(PPh3)2]
(2.608, 2.597 and 2,623 A). The absorption spectra of these complexes are characterized by strong narrow peaks located at ~ 400 nm for Pt4, and ~ 510 - 540 nm for Pd4 species. These absorption bands arise from do* —> da* transitions, which are consistent with the EHMO calculations. For [Pd4(dmb)4(PPh3)2]2+ complex, the above assignment was confirmed by the first (Vmax vs T) and second moment (fwhm vs T) analysis of the absorption band. The emissions of all the these complexes are phosphorescence, and also arise from do*—>dCT*
transitions.
The linear complexes, {[M4(dmb)m]Cl2}n (M = Pd, Pt), prepared from the reaction between
M2(dba)3-CHCl3 and dmb, are reactive. The palladium species, {[Pd4(dmb)m]Cl2}n reacts with
neutral TCNQ to give an oxidized dinuclear complex, [Pd2(dmb)4(p,2-Cl)](TCNQ)4, where the
Cl" is encapsulated by two Pd(II) atoms. This result confirmed the composition of the
intermediate species, {[Pd4(dmb)m]Cl2}n, and suggested that chlorocarbons are involved in the
reactions between M2(dba)3-CHCl3 and dmb, which leads to the oxidized complexes,
[M4(dmb)4(PPh3)2]Cl2 in the presence ofPPhs. The reaction between {[Pt4(dmb)m]Cl2}n and
Au(PPh3)2+ led to the preparation of a heterometallic cluster, [Pt2Au2(dmb)2(PPh3)4] , with a
rhombic geometry. In this molecule, long Pt-Au (-2.82 A) and short Au-Au (-2.598 A) bond lengths were observed. The properties of this complex have also been studied.
SOMMAIRE
Les agregats metalliques de palladium et de platine de basse valence ont ete Ie sujet d'interets depuis longtemps a cause de leurs proprietes catalytiques et de la presence de liaisons metal-metal intrigantes. Dans ce prqjet deux ligands assembleurs ont ete utilises pour constmire ces agregats, soit Ie dpam (bis(diphenylarsino)methane) et Ie dmb (1,8-diisocyano-p-menthane). En efFet, deux sortes d'agregats (polyedre et chame lineaire) ont ete prepares avec succes, et ont ete pleinement caracterises.
La reduction directe du Pd(CH3COO)2 dans 1'acetone en presence d'un melange de dpam, CFsCOOH et de 1'eau, par Ie CO produit 1'agregat [Pd3(dpam)3(Hs-CO)]2+. La stmcture du cation a ete determinee par la technique de diffraction des rayons-X, et est isostructurale au derive dppm correspondant. Dans ce cas, la dimension de la cavite formee par les six groupes phenyles adoptant la configuration axiale est grande, ou Ie contre anion PF6' se retrouve. Les constantes d'association de cette molecule hote modifiee ont ete obtenues par spectroscopie UV-visible, et ont ete comparees avec celles du derive dppm correspondant connu. Comme prevu, ces constantes d'association sont plus elevees pour la grande cavite (dpam) pour un meme systeme substrat-hote, ceci montre clairement la consequence directe de 1'augmentation de la dimension de la cavite via 1'augmentation de la liaison M-L (Pd-As -2,42 A, Pd-P -2,32 A). Durant ces experiences, on s'aper^oit que 1'anion PF6' se lie faiblement au [Pd3(dpam)3(u3-C0)]2+, alors que cela ne survient pas pour 1'analogue au dppm. Cet agregat metallique reagit avec I' pour former Ie compose attendu [Pd3(dpam)3((J.3-CO)(p.3-I)]^ ou une stmcture bipyramide trigonale est observee. Subsequemment, la presence de €2 conduit a une reaction de fragmentation oxydante et Ie complexe Pd2(dpam)2l4 a ete isole, et identifie par cristallographie. Dans ce cas les ligands dpam pontent les deux centres Pd (II), et ils ne chelatent pas Ie metal tel qu'obsen/e pour les complexes mononucleaires Pd(dppm)X2 (X = Cl, Br, I). La longue distance Pd'-'Pd (3,3896(9) A) indique 1'absence d'interaction Pd'-Pd.
La reduction du Pt(dpam)(02CCF3)2 par Ie CO dans un melange methanoVeau, conduit a la preparation d'un agregat de geometric papillon a 58 electrons de valence, [Pt4(dpam)3(|j,2-C0)(r| -dpam)] sous forme de sel de CFsCOi'. Le sel de PF6' correspondant peut etre obtenu par metathese de I'anion. La structure a ete determinee par methode cristallographique, dans laquelle on retrouve deux triangles Pts (un petit et un grand) partageant un meme cote. Dans Ie petit triangle, la distance Pt-Pt moyenne est 2,626 A, alors que dans Ie plus grand, cette distance est de 2,690 A. En solution un processus fluxionnel sundent, lequel a ete confirme par des mesures de spectre RMN H en fonction de la temperature. A basse temperature (T< 193 K) les spectres deviennent tres complexes indiquant une perte de la symetrie €3. Les spectres ont egalement montre la presence de deux isomeres en solution, associes probablement a la coordination ou non du groupe CFsCOO'. II a aussi ete propose que la charge 2+ soit localisee sur Ie fragment Pts (petit) sur une base comparative avec des donnees cristallographiques trouvees dans la litterature pour des agregats appartenant a la meme famille. De plus, cet agregat est luminescent a 77 K, mais pas a la temperature de la piece. Cette emission est une phosphorescence avec une duree de vie (Te) de 3,2 ± 0,2 p.s. Ces proprietes ont ete discutees a 1'aide de calculs EHMO.
La preparation d'un nouveau complexe lineaire Pt4 contenant des liaisons Pt-Pt a ete reussie via la reaction directe entre Ie Pt2(dba)3-CHCl3 et un exces de dmb. Ce complexe stable a 1'air, [Pt4(dmb)4(PPh3)2]Cl2, a ete isole sous forme de cristaux rouge-orange. La structure a ete determinee a 1'aide de la technique de diffraction des rayons-X. Pour cette molecule, les quatre atomes de Pt sont relies entre eux par des liaisons courtes (2,654, 2,641 et 2,666 A), et forment une chame lineaire (ZPtPtPt=175,3 ). Une structure catenate a ete egalement observee ou deux unites de Pt2(dmb)2 (anneaux a 20 membres) s'enchament I'un dans 1'autre pour former cette geometric speciale. Le derive au palladium a ete synthetise de la meme maniere, en utilisant Ie Pd2(dba)3-CHCl3 a la place du Pt2(dba)3-CHCl3. Dans ce cas, la distance Pd-Pd est d'environ 2,53 A, et une structure similaire est observee. Cette chimie a ete appliquee pour la preparation de polymeres organometalliques contenant les fragments
[M4(dmb)4] (M = Pd, Pt). Les polymeres organometalliques, du type [Pt4(dmb)4]-diphosphine
(Ph2P-(CH2)x-PPh2, x = 4, 5, 6; dppb, dppp, dpph, respectivement), ont ete synthetises ou les
unites de [Pt4(dmb)4] sont reliees ensemble par des ligands diphosphines,
{[Pt4(dmb)4]-P-(CH2)x-P-}n. Pour Ie derive du palladium. Ie polymere, {[Pd4(dmb)5J2+}n a ete caracterise par cristallographie, ou les unites Pd4(dmb)42+ sont relies par un autre dmb adoptant une conformation-Z (au lieu de -U) pour former une chame unidimensionnelle. La stmcture catenade est toujours presente dans les unites Pd4 dans ce polymere. Les distances Pd-Pd sont plus longues que dans Ie [Pd4(dmb)4(PPh3)2]2+ (2,608, 2,597 et 2,623 A). Les spectres d'absorption de ces complexes sont caracterises par des bandes minces et intenses autour de -400 nm pour Ie Pt42+ et -510-540 nm pour les especes Pd4. Ces bandes d'absorption proviennent de transitions electroniques du type do *—>• do*, en accord avec les predictions
obtenues par les calculs EHMO. Pour Ie complexe [Pd4(dmb)4(PPh3)2] , cette attribution a
ete confirmee en utilisant des analyses du premier (Vmax vs T) et second moment (fwhm vs T) de la bande d'absorption. Les emissions de tous ces complexes sont des phosphorescences, et proviennent egalement des transitions electroniques du type do*—>do*.
Ces complexes lineaires {[M4(dmb)m]Cl2}n (M = Pd, Pt) qui ont ete prepares a partir des
dimeres M2(dba)3-CHCl3 et dmb sont reactifs. Les composes de palladium {[Pd4(dmb)m]Cl2}n
reagissent avec Ie TCNQ neutre pour former Ie complexe dinucleaire oxyde [Pd2(dmb)4(p-2-C1)](TCNQ)4 ou un des Cl" est maintenant encapsule entre deux atomes de Pd(II). Ce resultat indique que la composition de 1'intermediaire est {[M4(dmb)m]Cl2}n dans la reaction entre Ie
M2(dba)3-CHCl3 et dmb et Ie PPhs conduisant au produit [Pd4(dmb)4(PPh3)2]Cl2. La reaction
entre Ie {[Pt4(dmb)m]Cl2}n et Au(PPh3)2" conduit a la preparation de 1'agregat heteronucleaire [Pt2Au2(dmb)2(PPh3)4] . Dans cette molecule, des liaisons tres longues Pt-Au (-2,82 A) et une tres courte Au-Au (-2,598 A) ont ete observees. Certaines proprietes de ce complexe ont egalement ete etudiees.
ACKNOWLEDGEMENTS
This project has been carried out in Prof. P. D. Harvey's laboratory. I thank Professor P. D. Harvey for his giving me the chance to study and do the research in this interesting field, and his supervision and support in study and living.
During my study in Sherbrooke, I have got support from my colleagues, R. Provencher, D. Fortin, J. Gagnon, M. Turcotte and M. Vezina. I particularly express my gratitude to M. Drouin for his measurements of the X-ray structures of all the complexes in this project.
I am very grateful to my family. Their support made this work possible.
The NSERC (Natural Sciences and Engineering Research Council) and the FCAR (Fonds
TABLE OF CONTENTS
SUMMARY... ii
ACKNOWLEDGEMENTS ... viii
TABLE OF CONTENTS ... ix
LIST OF ABBREVIATIONS ... xiv
LIST OF TABLES ... xvi
LIST OF FIGURES ... xx
LIST OF SCHEMES ... xxv
INTRODUCTION... 1
CHAPTER 1 - THEORY ... 5
1.1 Binding constants and UV-vis spectrophotometry ... 5
1.1.1 The equilibrium constant ... 5
1.1.2 Model ... 6
1.1.3 The binding isotherm ... 8
1.2 X-ray diffraction ... 16
1.2.1 Single crystal X-ray dififraction ... 16
1.2.2 X-ray powder dif&action ... 20
1.3 Nuclear magnetic resonance ... 20
1.3.1 Nuclei energies in magnetic field ... 20
1.3.2 Spin-lattice relaxation ... 21
1.3.2.1 Spin-lattice relaxation time (Ti) ... 21
1.3.2.2 The measurement of Ti by Fourier Transform Spectroscopy... 25
1.3.3 The relation between Ti and molecular dimension ... 26
1.4.1 Jablonski diagram ... 26
1.4.2 The Franck-Condon principle ... 28
1.4.3 Internal conversion and intersystem crossing ... 29
1.4.4 Fluorescence and phosphorescence ... 31
1.4.5 Transition probability ... 31
1.4.6 Lifetime ... 36
1.5 Polymers ... 37
1.5.1 Definition... 37
1.5.2 Determinationofmolecularweightbyviscosity measurements ... 38
CHAPTER 2 - PALLADRJM AND PLATINUM CLUSTERS OF DIARSINE ... 40
2.1 The tuning of binding properties via the change in cavity size of the unsaturated palladium clusters... 40
2.1.1 Synthesis and crystal structure of[Pd3(dpam)3CO](PF6)2 ... 41
2.1.2 Host-guest chemistry ... .... 44
2.1.3 Reaction with iodide salt ... 48
2.2 Properties of a new 58-electron butterfly [Pt4(dpam)3((J.2-CO)(r| -dpam)](PF6>2
cluster ... 532.2.1 Synthesis and crystal structure of [Pt4(dpam)3(U2-CO)(r|-dpam)](PF6)2 . 55
2.2.2 FT-Raman spectmm ... 602.2.3 1HNMR spectra and fluxionality ... 62
2.2.4 EHMO computations ... 67
2.2.5 UV-vis and emission spectra ... 70
CHAPTER 3 - PALLADRJM AND PLATINUM COMPLEXES OF DIISOCYANIDE - 72
3.1 The linear tetranuclear platinum complex [Pt4(dmb)4(PPh3)2]2+ and its diphos-phine polymers ... 723.1.2 Characterization ... 76
3.1.2.1 NMR spectra ... 76
3.1.2.2 Crystal structure ... 80
3.1.3 Isomers (head-to-tail dmb chemistry) ... 84
3.1.4 Raman spectrum ... 87
3.1.5 Preparation and characterization ofpolymers containing [Pt4(dmb)4J units 89 3.1.6 X-ray powder diflfraction ... 89
3.1.7 Viscosity and Ti measurements ... 91
3.1.8 EHMO computations ... 94
3.1.9 Electronic spectra ... 98
3.2 Preparation, spectroscopic and structural characterization of [Pd4(dmb)4(PPhs)2]2^
and its organometallic polymer {[Pd4(dmb)5](CH3COO)2}n. The first 58-electron
tetranuclear linear chain Pd clusters ... 1033.2.1 Preparation and characterization of [Pd4(dmb)4(PPh3)2]Cl2 ... .103
3.2.2 Reactivity ... 104
3.2.3 Preparation and structure ofpolymer {[Pd4(dmb)5](CHsCOO)2}n... 108
3.2.4 Raman spectra ... 114
3.2.5 EHMO computations ... 116
3.2.6 UV-vis spectra and moment band analysis ... 118
3.2.7 Luminescence properties ... 127
3.3 Reactivity oflow-valent platinum-diisocyanide complex. Synthesis, crystal structure and properties of[Pt2Au2(dmb)2(PPh3)4](PF6)2 ... 128
3.3.1 Synthesis and characterization ... 129
3.3.2 Crystal structure of [Pt2Au2(dmb)2(PPh3)2](PF6)2 ... 131
3.3.3 31P NMR spectmm ... 137
3.3.4 FT-Raman spectmm of [Pt2Au2(dmb)2(PPh3)2](PF6)2 ... 139
CONCLUSION ... 144
EXPERIMENTAL SECTION ... 147
1 Materials ... 147
1.1 Clusters [Pd3(dpam)3CO]Y2(Y=CF3COO-, PF6', ^^N5)4]') and [Pt4(dpam)4
•(CO)3]Y2 (Y= CFsCOO-, PF6-) ... 1471.2 Linear clusters, [M4(dmb)4(PPh3)2]2+ (M = Pd, Pt) and polymers ... 147
2 Instruments ... 147 3 X-ray crystallography ... 148 4 Synthesis ... 153 4.1 Synthesis of [PdsCdpanOsCOKCFsCOC^ ... 153 4.2 Preparation of [Pd3(dpam)3CO](PF6)2 ... 153 4.3 Preparation of[Pd3(dpam)3CO][B(C6H5)4]2 ... 154
4.4 Synthesis of [Pds(dpam)3 (CO)(I)](CF3COO) ... 154
4.5 Synthesis ofpdiCdpan^] ... 154 4.6 Synthesis of [Pt4(dpam)4(CO)3](CF3COO)2... 155 4.6.1 Preparation ofPt(dpam)Cl2 ... 155 4.6.2 Preparation ofPt(dpam)(CF3COO)2 ... 155 4.6.3 Preparation of [Pt4(dpam)4(CO)3](CF3COO)2 ... 155 4.7 Preparation of[Pt4(dpam)4(CO)3](PF6)2 ... 156 4.8 Synthesis of [Pt4(dmb)4(PPh3)2]Cl2 ... 156 4.9 Synthesis of{[Pt4(dmb)4(dppb)]Cl2}n ... 157 4.10 Synthesis of{[Pt4(dmb)4(dppp)]Cl2}n ... 158 4.11 Synthesis of{[Pt4(dmb)4(dpph)]Cl2}n ... 158 4.12 Synthesis of [Pd4(dmb)4(PPh3)2]Cl2 ... 159 4.13 Synthesis of [Pd2(dmb)4((X2-Cl)](TCNQ)4 ... 159
4.14 Synthesis ofpolymer {[Pd4(dmb)5](CH3COO)2}n ... 160
4.16 Synthesis ofPt2(dmb)2Cl2 ... 162
4.16.1 Synthesis ofPt2(dmb)2CU ... ... . :. .... 162
4.16.2 Synthesis ofPt2(dmb)2Cl2 ... 162
LIST OF ABBREVIATIONS
A: absorbance.
8: molar absorption coefficient.
CVE: cluster valence electron count.
dba: dibenzylideneacetone dmb: l,8-diisocyano-/?-menthane.
dpam: bis(diphenylarsino)methane.
dppb: bis(diphenylphosphino)butane.
dpph: bis(diphenylphosphino)hexane.
dppp: bis(diphenylphosphino)pentane.
EHMO: Extended Huckel Molecular Orbital.
FAB: fast atomic bombardment.
fwhm: full width at half-maximum.
HOMO-n: orbital lying below HOMO.
LUMO: lowest unoccupied molecular orbital.
LUMO+n: orbital lying above LUMO.
MLCT: metal to ligand charge transfer.
LIST OF TABLES
1. Crystallographic data for [Pd3(dpam)3(CO)](PF6)2 ... 41
2. Selected bond distances (A) and angles (°) for [Pd3(dpam)3CO](PF6)2 ... 43
3. Comparison of the binding constants for [Pds(dppm)3CO]2+ and [Pd3(dpam)sCO]2+. . 47
4. Crystal data for [Pd3(dpam)3(CO)(I)](CF3COO) and ^(dpan^Lj ... 49
5. Selected bond distances (A) and angles (°) for [Pd3(dpam)3(CO)(I)](CF3C02) ... 51
6. Selected bond lengths (A) and angles (°) for [Pd2(dpam)2l4] ... 51
7. Crystal data for [Pt4(dpam)3(H2-CO)(r|l-dpam)](PF6)2 (4b)... ... 56
8. Selected bond distances (A) and angles (°) for [Pt4(dpam)3(p-2-CO)(r|l-dpam)](PF6)2
(4b) ... 589. Comparison ofPt-Pt distances (A) in butterfly clusters ... 59
10. Comparison of the v(Pt-Pt) data for cyclic Pt clusters ... 61
11. Selected mass FAB data for solid [Pt4(dmb)4(PPh3)2]Cl2 ... 75
13. Comparison of the NMR data (31P, 5Pt) for selected polynuclear Pt complexes... 79
14. Crystallographic data for [Pt4(dmb)4(PPh3)2]Cl2 ... 80
15. Selected bond distances (A) and angles (°) for [Pt4(dmb)4(PPh3)2]Cl2 ... 82
16. Comparison of the Pt-Pt distances for various Pt4 Species ... 83
17. Comparison of the spectroscopic and structural data for linear Pts and Pt4 complexes . 88 18. Spectroscopic data for [Pt4(dmb)4(PPh3)2]Cl2 and related polymers ... 90
19. The values ofTi and intrinsic viscosities of the polymers ... 92
20. EHMO atomic contributions for [Pt4(CNMe)8(PH3)2]2+... 97
21. Spectroscopic data for [Pt4(dmb)4(PPh3)2]Cl2 ... 100
22. Comparison of the electronic spectroscopic data for tetramer and polymers ... 101
23. Spectroscopic comparison for various low-valent Mn-isocyanide complexes exhibiting either M-centered or MLCT emissions ... 102
24. Selected mass FAB data for solid [Pd4(dmb)4(PPh3)2]Cl2 ... 105
25. Crystallographic data for [Pd2(dmb)4(H-Cl)](TCNQ)4 ... 106
27. Crystal data for {^(dm^sKCHsCOC^^C^n ... 109
28. Selected bond lengths (A) and angles (°) for {[Pd4(dmb)5](CH3COO)2(H20)4}n ... 112
29. Comparison of the dmb bite distances (>4.9A)... ... 113
30. Comparison of the spectroscopic and structural data for linear and cyclic Pdn clusters .115 31. EHMO atomic contributions for [Pd4(CNMe)s(PH3)2]2+... 117
32. Comparison of the first and second moment band analysis for various Pdn species .. 125
33. Selected AQ values vs ^(Dei for the excited states of [Pd4(dmb)4(PPh3)2] ... 126
]•
34. Electronic spectroscopic data for [Pd4(dmb)4(PPh3)2]Cl2 and polymer {[Pd4(dmb)5]*
(CH3COO)2(H20)4}n ... 12835. Assignment of the fragments for [Pt4(dmb)4(PPh3)2](PF6)2 ... 130
36. Assignment of the fragments for [Pt2Au2(dmb)2(PPh3)4](PF6)2 ... 131
37. Crystal data for [Pt2Au2(dmb)2(PPh3)4](PF6)2 ... 133
38. Selected bond lengths (A) and angles (°) for [Pt2Au2(dmb)2(PPh3)4](PF6)2 ... 135
39. IR active v(CN) data for various Pt-CNR (alkyl) complexes ... 136
LIST OF FIGURES
1. Crystal structure of [Pd3(CNCHs)6(PPh3)2]2+ ... 3
2. Direct binding curve plot ... ... 9
3. Double-reciprocal plot ... ... 9
4. y-Reciprocal plot ... ... 10
5. x-Reciprocal plot ... ... 10
6. Typic absorption spectmm of a 1:1 complexing system ... 12
7. The conventional derivation of the Bragg law treats each plane as reflecting the
incident radiation ... ... 17
8. An electron-density map of a benzoic acid molecule determined from the X-ray
diffraction pattern ofabenzoic acid crystal ... 19
9. The nuclear spin energy levels of a spin-1/2 nucleus in a magnetic field ... 21
10. Orientation of the dipolar interaction relative to the magnetic field ... 23
11. Determination ofTi by the inversion-recovery method ... 25
13. Diatomic potential energy curves and Franck-Condon transition ... 25
14. Diatomic potential energy curves and intersystem crossing ... 30
15. Franck-Condon potential curves of the ground and excited states of a diatomic molecule
and typic absoq)tion spectra ... 33
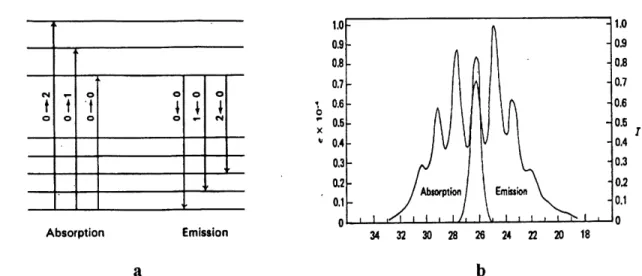
16. Scheme for the absorption and emission (fluorescence) spectra (a); an example of
absorption and fluorescence spectra (b) ... 34
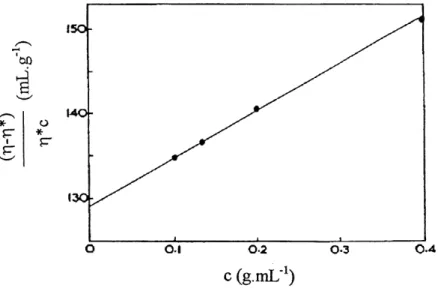
17. The concentration dependence of the viscosity number for polystyrene in toluene
at 30°C ... 39
18. Crystal structure ofpdsCdpanOsd^-CO)]^)^^^ ... 42
19. Absorption spectra of [Pd3(dpam)3((^3-CO)](PF6)2: acetonitrile system in acetone ... 45
20. Typical binding constant (Kn) measurement experiment (linear plots):
Benesi-Hildebrand, Scott, and Scatchard's associated with Figure 19 ... 46
21. Crystal structure of[Pd3(dpam)3(H3-CO)((^-I)](CF3COO) ... 50
22. Crystal structure of [Pd2(dpam)2l4] ... 52
23. Crystal structure of[Pt4(H2-dpam)3((^2-CO)3(r|l-dpam)](PF6)2 (4b) ... 57
25. 1HNMR spectrum of Pt4(dpam)4(CO)s](CF3COO)2(4b) in acetone-d6 ... 62
26. XH NMR spectra of [Pt4(H2-dpam)3(^2-CO)3(ril-dpam)](CF3COO)2 (4a) in DMSO-d6
in the 5.6-6.2 ppm region (Hb and HV) as a function of selected temperatures ... 64
27. Ball-and-stick drawing based upon the X-ray structure of4b showing Ha and Hb
(con-former 2) with respect to Pt(p/rCO)2(r| -dpam) fragment and CO group under the
Pt3As6 plane ... 6528. 1H NMR spectra of [Pt4(U2-dpam)3(|^2-CO)3(ril-dpam)](CF3COO)2 (4a) in the 5.4-6. 1
ppm region ... 662+
29. Interaction diagram for Pt4(H2-CO)3(AsH:3)7ZT ... 69
30. Absorption (left) and emission spectra (right) of [Pt4(|Li2-dpam)3(p.2-CO)3(r| -dpam)]«
(PF6)2 (4b) in ethanol at77K ... 71
31. Low-resolution mass FAB spectmm of [Pt4(dmb)4(PPh3)2]Cl2 ... 74
32. 195Pt NMR spectmm of [Pt4(dmb)4(PPh3)2]Cl2 in CDsCN ... 76
33. 31P NMR spectra (experimental and simulated) of[Pt4(dmb)4(PPh3)2]Cl2 in CDsCN . 78
34. Crystal structure of [Pt4(dmb)4(PPh3)2]Cl2 ... 81
35. Schematic drawings of 5 geometric and 2 optical isomers for [M4(dmb)4(PPh3)2] . . 85
37. FT-Raman spectmm for solid [Pt4(dmb)4(PPh3)2]Cl2 ... 87
38. X-ray powder diffraction patterns for [Pt4(dmb)4(PPh3)2]Cl2 and its polymer ... 91
39. The concentration dependence of the viscosity number at low concentrations ... 93
40. MO correlation diagram between the [^(CNE^PHs)^ and [•Pt(CNR)2(PH3)]+
fragments ... 96
41. Plot of the total EHMO energy vs the twist angle for [Pt4(CNCH3)8(PH3)2]2+... 98
42. Absorption spectrum of [Pt4(dmb)4(PPh3)2]Cl2 in ethanol at 77 K ... 99
43. Emission spectmm of [Pt4(dmb)4(PPh3)2]Cl2 in ethanol at 77 K ... 101
44. Crystal structure of [Pd2 (dmb)4(u2-Cl)](TCNQ)4 ... 107
45. Crystal structure ofpolymer {[Pd4(dmb)5](CH3COO)2}n ... Ill
46. FT-Raman spectmm for [Pd4(dmb)4(PPh3)2]Cl2 ... 115
47. UV-vis spectra of [Pd4(dmb)4(PPh3)2]2+ and polymer {[Pd4(dmb)5]2+}n in
butyroni-trile at 77 K ... ... 118
48. UV-vis spectra of [Pd4(dmb)4(PPh3)2]Cl2 in butyronitrile vs temperature. ... 121
50. The second moment plot of the lowest energy band for [Pd4(dmb)4(PPh3)2]Cl2 in
butyronitrile ... 124
51. The emission spectmm of [Pd4(dmb)4(PPh3)2]Cl2 in ethanol at 77 K ... 128
52. Mass FAB spectmm of [Pt2Au2(dmb)2(PPh3)4](PF6)2 ... 132
53. Crystal structure of [Pt2Au2(dmb)2(PPh3)4](PF6)2 ... 134
54. 31P NMR spectra of [Pt2Au2(dmb)2(PPh3)4](PF6)2 in CD2C12 ... 138
55. FT-Raman spectrum of [Pt2Au2(dmb)2(PPh3)4](PF6)2 ... 139
56. Absorption spectra of [Pt2Au2(dmb)2(PPh3)4](PF6)2 in butyronitrile at 298 and 77 K. 141
LIST OF SCHEMES
I. Molecular structures of the 58-CVE clusters ... 54
II. Cs-rotation fluxional process ... 62
HI. Proton labelling for 1H NMR analysis ... 63
IV. Conformers l(Ha',Hb')and2(Ha,Hb) ... 63
V. Interactions between Pt(AsHs)22+ and the Pt3(H2-CO)3(AsH3)5 center ... 68
VI. Qualitative scheme for the interacting MO's for fragment A and B ... 68
VII. Synthetic route to [Pt4(dmb)4(PPh3)2]Cl2 ... 73
VIII. Side by side interaction between two square planar "MLs fragments ... 94
IX. A frontier orbital (ai symmetry) of the -Pt(CNR)2(PH3)+ fragment ... 95
X. Synthetic route to [Pd4(dmb)4(PPh3)2]Cl2 ... 104
EMTRODUCTION
Clusters can be considered as a group metal core encompassed by ligands or small pieces of metal with chemisorbed species on the periphery. This kind of complexes represent an intermediate state between simple complex containing only one metal atom and bulk metal, where a group of metal atoms are separated by distances that approximate to those found in the bulk metals. The related chemistry has developed rapidly over the past several decades due to the following reasons (1, 2, 3): a) The clusters adopt a bewildering variety of structures. Up to now, a very large number of clusters have been prepared, and the crystal stmctures of many clusters have been measured. The structures of clusters can be very complicated. The interesting features are, what factors control the structures, and what size the clusters can
achieve; b) The physical properties of clusters are very different from those of bulk metals,
even supramolecular clusters containing very high nucleanty of metal atoms. For example, most clusters are "fragile". Is it possible that, if the size of cluster is large, the clusters can behave as bulk metals, having the metallic properties? c) Clusters have important catalytic properties, and this chemistry may provide valuable insight into chemisorption and catalysis on metal surfaces (4). Although cluster structures may be very complex, the most recurrent structural feature in clusters is the triangular unit Ms. The complex clusters can be thought as the assemblies of this "building block". This simple unit, trinuclear complexes Ms, can react with many kinds ofsubstrates as Lewis acids or bases to give rich chemistry (5).
For platinum and palladium, there is a long standing interest in their clusters due to their intriguing metal-metal bonding and excellent catalytic properties (2, 4, 5, 6). The simple mimic of metal surface, which has been intensively studied in the past two decades, is platinum(I) and palladium(I) dimer, in which two metal atoms are locked together to form a strong
metal-metal bond by two dppm ligands (bis(diphenylphosphino)methane), [M2(dppm)2X2] (M = Pt,
Pd; X = Cl, Br, I). The most standard reaction is that small molecules, such as CO, S02, S, CH2 or C$2, RC=CR, can insert to metal-metal bond to form "A-Frame" complexes and be
activated (6, 7, 8). Later, the interest shifted to trinuclear clusters Ms, which would be a better model of metal surface. Puddepphatt and coworkers synthesized the "open-face" unsaturated
dppm-bridged triangular platinum and palladium clusters, [Ms(dppm)3(CO)] (9, 10, 11).
They found that many kinds of substrates, including anions, neutral molecules (CF, S , €82, RC=sCR, etc.), and even metal atoms with d10 electronic configuration (Ag+, Au+, Hg, Pt,
etc.), can be added to the triangular face formed by three metal atoms (9). The
crystallographic studies revealed that three metal atoms are encircled by a cylmdncal array of six phenyl groups. Therefore these systems can also be considered as bifunctional recognition hosts because of the different properties of Ms center and phenyl groups. P. D. Harvey's group systematically studied the guest-host chemistry of this novel bowl-shaped host system
both in ground and excited states (12, 13), measuring the competitive binding constants with
different kinds of substrates, including salts and neutral molecules. This chemistry is related to
the charge, ligand behavior, the size and the hydrophobic properties of the substrates. This
biowledge is essential to understanding the catalytic processes on the surface of bulk metals.
In cluster chemistry, most of clusters adopt triangular and polyhedral structures. Recently, there are considerable interests in polynuclear clusters containing metal-metal chain for both chemists and material scientists, because of the metal-metal bonding in linear metal chain, the potential application as molecular wires and unusual properties of low-dimensional materials (14, 15, 16). It is well known that, in mixed oxidation states, rhodium atoms have a strong tendency to aggregate to form oligomeric complexes containing metal-metal chain, even infinite chain (16, 17). In the platinum and palladium chemistry, the most famous examples are the inorganic conducting polymers called the Krogmann's salts, in which the square-planar d8 platinum atoms form infinite linear metal-metal chain across the crystal through overlapping of pz or dz2 orbitals (18, 19). In the low oxidation states, there is also a strong tendency to form metal-metal bonds, but these linear complexes are generally constructed with the help of
bridging or polydentate ligands (20, 21). However in some cases, such as in [Pd2(CNCHs)6] ,
direct reaction of [Pd2(CNCH3)6]2+ with Pd(CNCH3)x in the presence of an excess of
isocyanide ligand, to give a linear trinuclear complex, [Pd3(CNCH3)g]2+, in which two unsupported metal-metal bonds occur. This trinuclear complex is more reactive than the dimer
(Figure 1) (23). Recently [Pd3(PPh3)4]2+ was reported, which also contains trinuclear Imear
chain (24). The platinum analogue, [Pt3(CNCH3)g] , was synthesized by electrochemical
reduction of the corresponding monomer, [Pt(CNCHs)4]2+ (25). The remarkable features of
these complexes are the short metal-metal bonds, 2.5921 (5) A for Pd-Pd bond and 2.6389 (7)
A for Pt-Pt bond, respectively, indicating the strong interaction between metal atoms. The extensive investigations have been performed in order to prepare longer Pt and Pd chain complexes in the low oxidation states, but no progress has been made so far.
2+.
Figure 1. Crystal structure of [Pd3(CNCH3)6(PPh3)2]^( taken from reference 23).
It is well known that, isocyanide ligands are good reagents to stablize the Pt and Pd atoms m the low oxidation states, and play an important role in the formation of linear chain complexes (22, 23, 24). Diisocyanide ligands, e.g. dmb, were also explored in order to prepare dinuclear or polymeric complexes (16, 20, 26, 27, 28, 29). The most interesting features are: 1) a wide
range of the bite distances is known; 2) dmb ligand also has the ability to encapsulate metal
atoms to form linear trinuclear metal atom chain (30). This gives us an expectation that, it is
possible to build longer chain complexes for Pt and Pd, if dmb is used as a ligand based upon
its encapsulating ability, also considering the fact that Pt(0) can insert to Pt(I)-Pt(I) bond to
In our laboratory, there are strong interests in Pt and Pd complexes, especially diphosphine and diisocyanide complexes of these metals, because of their interesting metal-metal bonding
and potential applications in catalysis (12, 13, 20,28,3 1). In this project, two kmds ofligands
are continued to be used to design and synthesize a series of new Pt and Pd complexes based on different purposes:
1. It is reported that the "open-face" unsaturated triangular Pt or Pd clusters can be considered as novel host systems, for examples, [M3(dppm)3CO] clusters (12, 13). But the effect of host system on this chemistry remains to be explored. To design modified host
system, diarsine ligand, dpam (instead of dppm) will be used as a ligand to synthesize new
clusters. It is expected that, compared to the dppm analogue, the size of the cavity will be large, because the distance ofM-As bond is longer than that ofM-P bond. How does the size of the cavity have an influence upon host-guest chemistry? Secondly, for the H NMR analysis of the dpam species, since As atoms will not couple with the H atoms because of its high
quadrupolar moment, their H NMR signals will be much simpler than that of the dppm
systems. This will be beneficial to study the behaviors or structures of clusters in solutions.
2. Construction of linear chain complexes will be explored because of their interesting polynuclear metal-metal bonding, and their applications as molecular wires and low dimensional materials. The design and preparation of new and longer metal-metal chain complexes are anticipated, and based upon that, the development of new low-dimensional materials are aimed. In this section, the diisocyanide ligand, dmb, will be used as a bridging ligand to prepare linear chain complexes. Because Pt and Pd complexes in the low oxidation states are very reactive (32, 33, 34), the chemistry of Pt or Pd and dmb complexes in low oxidation states will be investigated.
CHAPTER 1
THEORY
1.1 Binding constants and UV-vis spectrophotometry
1.1.1 The equilibrium constant
Considering the three simplest complex stoichiometries: SL, SI^z, and S2L, it is chemically
reasonable to assume that every complex is formed in a bimolecular process, so these
complexes are related by the following equilibria:
S+L=SL
SL+L=SL2
SL+S=S2L
The stepwise binding constants are defined as:
[SL]
Kn== — [1.1]
[S] [L]
[SLj
Kn= —— [1.2]
[SL] [L]
[S2L]
^13=— [1.3]
[S] [SL]
Any complex of the type SJLn can be constructed in this manner. The formation reaction of higher complexes directly from the substrate and ligand can be written as: .
mS + nL = SmLn
and the expression for the overall binding constant is defined as:
[SJ.J
Kn = —— [1.4]
[srpL]"
1.1.2 ModelA potential model for this chemistry is built upon a hypothesis. Let m be the maximum number
of binding sites on ligand L, with h the number of occupied sites; thus h = 1, 2, 3, —, m; similarly, n is the maximum number of binding sites on substrates S, with ; = 0, 1, 2, —, n being the corresponding running index. Then the basic statement of a stoichiometric model involves the values of m and n.
The mass balance expressions of S and L can be defined, where Si and [S] represent total and free substrate concentrations, respectively, and similarly for ligand, all concentrations being on the molanty scale:
St=[S]+E^[ShL,] [1.5]
i=l
Lt=[L]+^-[ShLi] [1.6]
Equations (1.5) and (1.6) are not completely general, because they do not mclude provision for dimers, trimers, and so on, of S and L, but these can be added as necessary.
As one measure of extent of binding, i is defined as the average number ofligand molecules bound per molecule of substrate, or
E(bound to S) Lt - [L]
i = — = — [1.7]
E (all S) St
In the form of species ShLi, the fraction of substrate/u is defined as:
MShLi]
/hi = — [1.8]
St so that m, nE//»=l [1.9]
h=l i=land/io = [S]/St, the fraction of free substrate. Choosing the important special case m = 1, the
following expression is given by:
i = .E^ii [1.10]
1=1
The development of a model into a useful and testable form involves converting this basic
1.1.3 The binding isotherm
The simplest of these models, namely, 1:1 complex formation will be treated. This is the most important isotherm, first because it is often applicable to real systems (it will be used to measure the binding constants in this research project.), and second because many other systems can be viewed as extensions of, or deviations from, this simple case.
In its simplest form the isotherm for 1:1 binding is given by:
Kn[L]
,11 = — [1.11]
l+^n[L]
For generality, the function can be written as Eq. 1.12:
dK
y= — [1.12]
f+ex
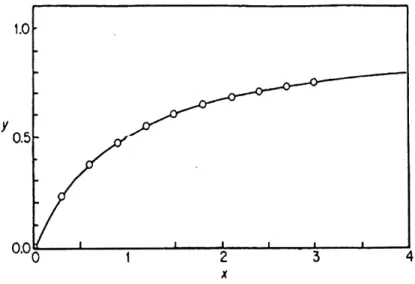
where y is the dependent variable, x is the independent variable, and d, e, f are constants or parameters (Figure 2).
There are three nonlogarithmic linear plotting forms of the rectangular hyperbola. From Eq. 1.12, the following equation can be obtained:
1 / 1 e
^. _ _j_ _
y d x d [1.13]
x e f
— = —x x +—
y d d
[1.14]
This equation is called the y-reciprocal plot (Figure 4).
The third linear form is called the x-reciprocal plot (Figure 5):
Figure 2. Direct binding curve plot ( Eq. 1.12) (taken from reference 35).
0 1 ^^ 3~ x
Figure 4. y-Reciprocal plot (Eq. 1.14) (taken from reference 35).
0.0
ye d
x / / [1.15]
These three linear plotting forms are not equivalent in an experimental sense, and there is continuing controversy about their advantages and limitations. The salient features are as follows: When the values of the independent variable x are chosen to be equally spaced, the linearization transformation can change this relationship. The double-reciprocal plot is
notorious for this effect (Figure 3). It is shown that the points at low x are widely spaced, with
those at high x being closely bunched. The results is that the placement of the line is extremely
sensitive to the y value of the point having the smallest x. The double-reciprocal plot has the advantage that the variables x and y remain separated on the abscissa and ordinate; in the other plotting forms the vanables become mixed. This is important because the uncertainty in
the dependent variable y is usually much greater than that in the independent variable.
Equations 1.13 and 1.14 have the advantage that the dependent variable appears only on the
ordinate, so the uncertainty of the abscissa values is negligible, and this simplifies the
statistical analysis. In the y-reciprocal plot, the equal spacing of x values is retained (Figure 4). The x-reciprocal plot (Figure 5), has the dependent variable on both axes, but it has an advantage in that it provides a closed scale representation of y on the abscissa, unlike the other two plots, which are open-ended (35).
Consider a two-state system whose two states have different absorption spectra. If the spectra, expressed on a molar basis, are superimposed, and if they intersect, then evidently the spectrum of any mixture of the two states, also expressed on a molar basis, will pass through the point of intersection. This point of common absorption intensity is called an isosbestic point. Figure 6 shows an isosbestic point of a typical two-state system. It is possible for a two-state system to exhibit more than one isosbestic point, or even no such point if the spectra nowhere intersect. But if there is an intersection of any two members of such a family of
spectra, and if the system possesses just two states, all possible members must pass through the isosbestic point.
0.2
0.0
I-340
460
Figure 6. Typical absorption spectrum of a 1:1 complexing system (taken from reference 35).
In making use of this spectral property, it is noted that, if an isosbestic point is observed over a wide range of composition, it can be concluded that the system has just two states; in other words, only one complex is formed. The corollary is that if two spectra of a family intersect, but not all of the spectra pass through a common point, the system must possess more than two states, that is, more than one complex stoichiometry. These conclusions are based upon the assumption that the observed spectral shifts are ascribable entirely to the changes in concentrations of the absorbing species as the ligand concentration is changed; that is, it is assumed that the spectral characteristics of the absorbing species are constant, unaffected by the mevitable changes in solution composition. However it is possible that, a system possesses only two states, but fail to exhibit a sharp isosbestic point if a spectral solvent dependence were operative, or even though the system possesses more than two states, the effects may combine to generate an isosbestic point. Isosbestic point observations constitute only one piece of evidence in the study of a complexing system.
In a system, a single 1:1 complex SL is formed, with the complex and the free substrates S having significantly different absorption spectra. It is assumed that Beer-Lambert law is followed by all species. A wavelength is selected at which the molar absorptivities 8s and 8n are different. At total concentration St of substrate, in the absence of ligand, the solution absorbance is given by the Beer-Lambert law:
= Ss^S>t
In the presence of ligand at total concentration Lt, the absorbance of a solution containing the same total substrate concentration is now:
AL = 6s/[S] + 8L/[L] + sn/[SL]
AL = 8,/St + SL^Lt + A8n/[SL]
where As n = 8n-8s-8L. By measuring the solution absorbance against a reference containing ligands at the same total concentration L(, the measured absorbance becomes:
A=8s/St+Asn/[SL] [1.16]
Combining Eq. 1.16 with the stability constant definition, K\\ = [SL]/[S][L], gives
AA=^nAsn/[S][L] [1.17]
where AA = A - Ao. From the mass balance expression Si = [S] + [SL] or [S] = St/(l+Arn[L]), Eq. 1.18 can be obtained as the relationship between the observed absorbance change per centimeter, and the system variables and parameters.
AA StA:nA8n/[L]
/ l+Kn[L] [1.18]
This equation is the binding isotherm, which shows the hyperbolic dependence on free ligand
concentration. It must be noted that the reference solution contains the same total ligand concentration Li as the sample solution.
Eq. 1.18 can be used to describe the spectral data for a 1:1 complexing system. The
double-reciprocal form of plotting the rectangular hyperbola ( Eq. 1.13) is based on the linearization
ofEq. 1.18 according to Eq. 1.19.
/ 1 1
.+
Equation 1.19 is called the Benesi-Hildebrand equation. The plot of 1/AA against 1/[L] is
linear. The parameters are evaluated from this plot according to the following equations.
(y-intercept)
Kn = ————— [1.20]
(slope)
1
Aen=— [1.21]
St(y-intercept)The y-reciprocal form is Eq. 1.22, called the Scott equation.
/ [L] [L] 1
AA StAsn St^nAsn [1.22]
The parameters are given by:
(slope)
Kn = — [1.23]
(y-intercept)
1
Asn=— [1.24]
Si(slope)
The x-reciprocal form is written as:
AA ^nAA
-+St^nA8n [1.25]
/[L] /
It is called a Scatchard plot. The parameters are evaluated with Eqs. 1.26 and 1.27.
Kn= -(slope) [1.26]
(x-intercept)
A6u=— [1.27]
StIn the experiment for the 1:1 case, the fixed wavelength is usually chosen so as to give the largest possible values of AA, and the range of Li should be as large as is permitted by the experimental situation. It must be noted that, linear plotting of spectral data yields estimates of the product Ku^sn that are more reliable than are the separate parameters K\\ and Acu, especially for weak complexes. In the double-reciprocal plot, the product is obtained from the slope, whereas the intercept gives Asn, and K\\ is obtained by a combination of these results. In the other linear forms, the product A^uAsn is obtained from an intercept. In linear plotting, a slope is usually estimated more reliable than is an intercept, because an intercept requires extrapolation, often over long distances; moreover, an intercept close to the origin may have a high relative error. It is helpful to make use of more than one of the linear plots, seeking estimates ofArn and Aen that are consistent with all of the plots and placing emphasis on the graphical features that are most reliably estimated.
1.2 X-ray diffraction
1.2.1 Single crystal X-ray diffraction
X-rays are electromagnetic radiations with wavelengths of about 10 A. When the rays pass through a crystal, the diffraction will happen because their wavelengths are comparable to the separation oflattice planes.
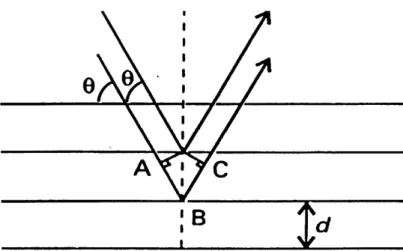
In Figure 7, it is shown that the path-length difference of the two rays can be given by:
AB+BC==/=2dsm9
d — separation of lattice planes; 6 — glancing angle
When / is not an integral number ofwavelengths, the waves interfere destructively; when / is an integral number of wavelengths, / = nk, the reflected waves are in phase and interfere constructively, and the Bragg Law is satisfied:
-^
A'
fc
B t^
^
fd
Figure 7. The conventional derivation of the Bragg law treats each plane as reflecting the incident radiation (taken from reference 36)
\= 2dsm6 [1.28]
Here, d is the separation of the (nh, r^c, n7) planes, and relates with
1 ht kt
f-4- _ + _
where a, b, c are the lengths of the three sides of the unit cell, and h k I are the Miller indices
of the diffracting planes.
Computing techniques are applied to this area, which lead to automated indexing and to the automated determination of the shape, symmetry, and size of the unit cell. Four-circle difiractometer is the most common instrument to determine the structure of single crystals. The computer determines the settings of the difFractometer's four angles (<)), %, co, 26), which are used to adjust the orientation of the crystal and counter so as to bring any desired plane
into a reflecting position and detect this reflection. The diffraction intensity is measured to
each setting and background intensities are assessed by making measurements at slightly different settings.
X-ray are scattered by the electrons in crystals. Because both the number of electrons and the size of the atomic orbitals vary from atom to atom, different atoms have different scattering efficiencies. The scattering factor of an atom, f, is defined by:
sin kr
•=47i I p(r) — r2
f=47i|p(r) — r'dr [1.30]
kr
where p(r) is the spherically symmetric electron density (number of electrons per unit volume)
of the atom and k = (47r/^)sm6, where 9 is the scattering angle and \ is the wavelength of the
X-radiation.
It is known that the intensity of a diffraction spot from a crystal is proportional to the square of the magnitkude of the structure factor,
For a unit cell that contains atoms of type ;' located at points xi, yi, and z;, structure factor is
defined by:
F(M/) = E f^2m(/ix-/a+^/b+/z-/c)
[1.31]
where fi is the scattering factor of an atom of type ?.
The details of electron distribution Inside a unit cell are contained in the structure factors. The electron density in the unit cell is constructed by using the relation:
1
p(r) = — ^ Fhkie2"i(AXI/a + kyt/b + /zi/c)
v
hkl[1.32]
where V is the volume of the unit cell.
Experimental diffraction patterns gives Ihki. So |F(M/)|2 can be obtained. The problem is in fact
that Fhu is not determined, hence p(r) is also not detennined as well. This is called the phase
Figure 8. An electron-density map of a benzoic acid molecule determined from the X-ray diffraction pattern of a benzoic acid crystal. Each contour line corresponds to constant value of the electron density (taken from reference 37).
problem. If this problem is solved, then the electron density can be calculated (Figure 8). The positions of the nuclei are readily deduced from the electron density map, from which bond
length and bond angle information can be determined (36, 37).
1.2.2 X-ray powder diffraction
Consider that the powder is just a collection of many small crystals. At least some of the crystallites will be orientated so as to satisfy the Bragg condition for each set of plane (hkF). The major use of X-ray powder diffraction is for the identification of samples, especially those compounds which have similar structures, by comparison (38).
This method is very useful in determination of the crystallinity of the polymer sample since
polymers exhibit structures covering the entire range from amorphous to crystalline states
(39).
1.3 Nuclear magnetic resonance
1.3.1 Energies of nuclei in magnetic field
For a nucleus with non-zero spin, the z component, Hz, of a magnetic moment depends upon the orientation of the spin,
Hz=Y^mi [1.33]
where y is the magnetogyric ratio of the nucleus. The magnetic moment is also expressed in terms of the nuclear g-factor gi and the nuclear magneton |-IN:
In Eq. 1.33, each value of mi corresponds to a different orientation of the nuclear magnetic moment. In a magnetic field B, the 21+1 orientations of the nucleus have different energies
given by:
E^=-^B=-y^Bmi [1.34] or in terms of the Larmor frequency (D (o = -yB),
Emi = -mi^o)
The energy separation of the two states of spin-1/2 nuclei is
AE=Ep-Ea=y^B [1.35] -^—P mi=-l/2
Energy
-^— a mi = 1/2
Zero field Magnetic field on
Figure 9. The nuclear spin energy levels of a spin-1/2 nucleus in a magnetic field.
The P state lies above the a state, so there are more a spins than P spins. If the sample is put in radiation of frequency v, the energy separations come into resonance with the radiation when the frequency satisfies the resonance condition:
hv=yhB [1.36]
1.3.2 Spin-lattice relaxation
The z component ofmagnetization, M(z), can be perturbed with the radio frequency pulse. In order for the spin system to return to equilibrium, there must be an interaction between the spins and the surroundings, or lattices, leading to a loss of the excess energy. At thermal equilibrium the spins have a Boltzmann distribution, with more a spins than (3 spins; after a 90 pulse, a magnetization vector in the xy plane immediately has equal number of a and (3 spins. The populations revert to their thermal equilibrium values exponentially
Mz(t)-MzOce-tyTl [1.37]
The Ti, time constant, serves as a measure of the rate with which the spin system comes into equilibrium with its environment, called the spin-lattice relaxation time, since this relaxation process involves giving up energy to the surroundings (40, 41, 42, 43).
There are a number of mechanisms which can contribute to spin-lattice relaxation in a molecule. The most common of these along with their associated relaxation time are:
dipole-dipole
spin-rotation quadrupolar scalar TIDD TISR TlQ TISCchemical shift anisotropy TICSA An overall spin-lattice relaxation time Ti is given by:
11 1 111
+ — + — +— +.
TI TIDD TISR TIQ TISC TICSA [1-38]
1. Dipolar relaxation Any magnetic nucleus in a molecule supplies an instantaneous magnetic dipole field, which is proportinal to the magnetic moment of the nucleus. When the nucleus undergoing relaxation is directly bonded to a second nucleus possessing a magnetic spin, the
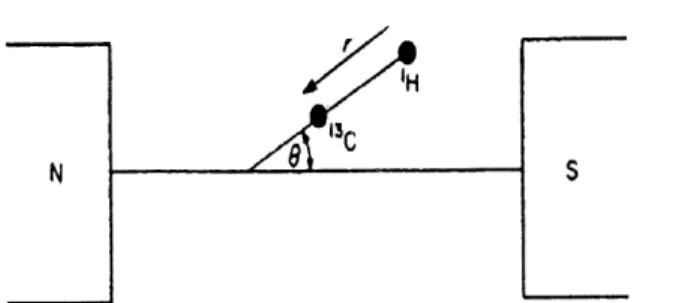
Figure 10. Orientation of the dipolar interaction relative to the magnetic field.
possibility of an efficient relaxation mechanism exists. Taking into account the specific case of a 13C nucleus which is directly bonded to a proton, the two spins can each be considered as small dipoles located at the centre of the C and 1H atoms. Therefore the 13C nucleus will experience a small field due to the dipolar interaction with the proton.
The magnetic field %D created at the C nucleus is given by:
Vnh
HDD= — (3cos26-l)
4w3
[1.39]
As the molecule tumbles in solution, the variation in 0 will cause fluctuations in HDD-Relaxation can be induced by any oscillating electric or magnetic field which has a component at, or close to, the Lamor frequency of the nucleus concerned. Consequently, the oscillations in HVD constitute a possible relaxation mechanism. For most non-viscous solutions, the contribution made by this mechanism can be expressed as:
-.2.. 2.. 2 1 N^YC'YH' To 1DD 3Tc
+ — +
2_ 2 6Tc v2_ 2 -}10(rcH)° l+(coc-®H)Tc2 l+cocV I+(O)C+COH/T/ [1.40]
N is the number of hydrogens directly bonded to C, co is the Lamor frequency, and ic is the correlation time.
In large molecules with slow tumbling and long correlation times, short Ti values are found, and dipole-dipole relaxation appears to predominate as long as no internal motion of molecular segments takes place. For C nuclei which have no directly bonded protons, the dipolar relaxation for these carbons is less effective, leading to longer relaxation times.
2. Spin-rotation relaxation This arises due to fluctuating magnetic fields generated by the movement of atoms within the molecule and is normally only important for small highly symmetrical groups. For example, in the C NMR spectmm of toluene, because of this
relaxation, the methyl signal at high field is appreciably smaller than that of the other
protonated carbons.
3. Quadmpolar relaxation This mechanism is important for nuclei with spin > 1/2. Such nuclei possess a quadmpole moment which gives rise to an electric field gradient at the nucleus, providing a highly efficient relaxation mechanism, both for themselves and for any
neighbouring C nuclei.
4. Chemical shift anisotropy relaxation The magnetic field at the nucleus is given by:
H=(l-a)Ho [1.41]
where CT is the shielding factor. It is found that an anisotropy in o may result in pronounced effects on chemical shifts, and may also furnish a mechanism for relaxation since as the molecule tumbles in solution, the field at the nucleus is continually changing in magnitude. The components of random tumbling motion at the Larmor frequency can then lead to spin-lattice
relaxation.
If o is axially symmetric, theory predicts that in the extreme narrowing limits usually found for small molecules, TicsA is given by;
where ^ and c^~ refer to the components of the shielding tensor parallel and perpendicular to the axis of symmetry. Ri increases quadratically with increasing magnetic field. For 13C, usually other relaxation mechanisms dominate.
5. Scalar relaxation Any process that gives rise to a fluctuating magnetic field at a nucleus might cause relaxation. When two nuclei / and S are spin-coupled, the value of J, the scalar spin-spin coupling constant, measures the magnitude of the magnetic field at nucleus / arising from the spin orientation of nucleus S. As •S' relaxes, I expedences a magnetic field fluctuation; Likewise if J changes, because of bond breaking in chemical exchange process, / experiences a similar fluctuation.
1.3.2.2 The measurement of Ti by Fourier Transform Spectroscopy
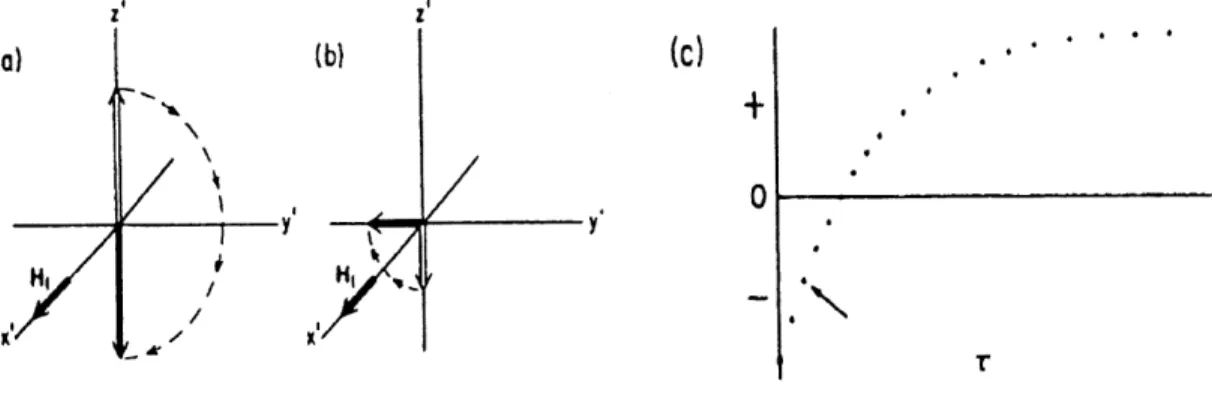
The most common means of measuring Ti is the inversion-recovery, or 180 -T-900, method. A 180° pulse first inverts magnetization from its equilibrium value of Mo to -Mo. If the pulse is
(a)
Hy
„ xl/ •X \ \ ^ \T
^ / / ^ ^r(b)
y' —^(c)
.\
Figure 11. Determination ofTi by the inversion-recovery method, (a) M is inverted by 180° pulse at time 0. (b) After a time interval T, a 90 pulse rotates the
re-maining M to the xy plane, (c) The initial amplitude of the FID or the height
of a given line in the Fourier transformed spectrum is plotted as a function of T (taken from reference 39).
perfect, there is no xy magnetization and hence no singal will be detected. The magnetization will return from -Mo to the equilibrium value ofMo at the spin-lattice relaxation rate (Ri). If at a time T after the 180° pulse, a 90 pulse is applied, magnetization will be forced to appear in the xy plane so that the relaxation of this magnetization can be monitored. A free induction
decay results, the initial height of which is proportional to the magnitude of M
(magnetization), hence to the value of Mz, at the time t. If the system is allowed to return to equilibrium by waiting at least five times Ti and the 180 -T-90 sequence repeated for a different value of T, the decay rate ofMz can be established (Figure 11).
1.3.3 The relation between Ti and molecular dimension
In equation 1.40, Tc is the correlation time, which is related to the molecular dimensions. For
the spherical model, the equation is the following (Stoke-Debye-Einstein):
Tc=47ca3r|/3kT [1.43]
where a is the radii of the molecule, k is the Boltzmann constant, T| is the viscosity of the medium, and T is the temperature.
If in the compounds, Ti is dominated by dipole-dipole interactions, according to Eq. 1.40, Tc can be calculated. By replacing 47ia3/3 by Tia2/ where / is the length of a cylindrical molecule, the length of molecule, /, can be estimated approximately by the following equation (26, 36):
Tc=7ca2/ri/kT [1.44]
1.4 Photophysical concepts
Absorption of a photon (quantum) of light can significantly excite a particular bond or group
in a given molecule. The various intramolecular processes initiated by light absorption are illustrated schematically in Figure 12 (44). In this diagram, the electronic states are represented by heavy horizontal lines; the symbols So, Si and 82 represent the ground state, first and second excited singlet states, respectively, and Ti and T2 represent the triplet states.
Si
n
Vibrational relaxation Internal conversion Intwyfm crossing Ta Tl Phosphorwcence1.4.2 The Franck-Condon principle
The relative intensities of the vibrational parts of an electronic absorption or emission are rationalized by the Franck-Condon principle: electronic transitions are so fast (10'15 sec) in comparison with nuclear motion (10'12 sec) that immediately after the transition, the nuclei have nearly the same relative position and velocities as they did just before the transition. This implies that the initially formed excited state must have the same geometry as the ground state (Figure 13). For all the points along the curve the nuclei of the molecule are motionless. The horizontal lines in the wells of these potential curves represent the vibrational levels of the states. At room temperature (25 C ), most but not all of the molecules of interest will be in their lowest vibrational level; therefore excitation will occur from this level. Since the geometry can not change during excitation, the molecule must find itself with the same internuclear distances after light absorption as it had before (Franck-Condon principle). This corresponds to the vertical arrow in Figure 13 and is termed a vertical or Franck-Condon
transition.
Interatomic distance r.
Figure 13. Diatomic potential energy curves and Franck-Condon transition (taken from reference 44).
1.4.3 Internal conversion and intersystem crossing
After excitation has occurred, the excitation energy, may be dissipated by any one of the three general processes: emission
AT (excited) —> Ao + hv
radiationlessA (excited) —> Ao + heat
conversion chemicalA' (excited) ——> products
reactionIn Figure 12, the important processes involving electronically excited states are illustrated. In the excited state, the molecule is in highly vibrational levels above its minimum energy. The excess vibrational energy can be dissipated via bimolecular collisions with solvent molecules. This process is called vibrational relaxation.
Internal conversion This process is a nonradiative transition between states of like
multiplicity.
S2—>Sl
Si—> So
The conversion from S; to Sj is an isoenergetic process that is followed by vibrational relaxation of the new vibrationally hot state.
Intersystem crossing This is related with a nonradiative transition between states of
different multiplicity:
Ti—> So
The crossing from the singlet to the triplet state has a maximum probability at point A (Figure
14), where the energy and geometry of the two states are equal.
The rate of these nonradiative processes are influenced by the following factors:
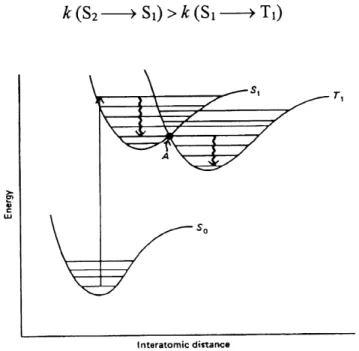
1. Energy separation: the larger the energy gap (difference between the lowest v-ibrational levels of the two states), the slower the rate:
k(S2 — >Si)>A;(Si—> So)
2. Conservation of spin: transitions between states of different multiplity are forbidden. This would be strictly tme if the spin and orbital motions of the electrons were independent. In fact, these transitions can often compete favorably with allowed processes because of
spin-orbital coupling:
^(S2—>^)>k(S, — >Ti)
•s, \===y^
~7^^
X:
y
Interatomic dittanceFigure 14. Diatomic potential energy curves and intersystem crossing (taken from reference 44).
1.4.4 Fluorescence and Phosphorescence
These are radiative processes. Kasha's rule states that the light-emitting level of a given
multiplicity is the lowest excited level of that multiplicity because of the large ratio constants
for the nonradiative processes.
1. Fluorescence The radiative transitions between states of like multiplicity are called fluorescence, the reverse of normal singlet-singlet absoq)tion process. Generally this occurs at high frequency and relatively short-lived.
2. Phosphorescence These radiative transitions occur between the states of unlike
multipli-city (tnplet-singlet), the reverse of the strongly forbidden singlet-tnplet absorption process.
The life-time is long compared to fluorescent process.
1.4.5 Transition probability
It is known that Franck-Condon principle is one of factors to control the absoq)tion and emission spectra. In fact, a light wave can be described in terms of electric and magnetic fields
with electric and magnetic vectors corresponding to these fields mutually perpendicular to
each other and to the direction ofpropagation of the wave. If light interacts with the electrons of an absorbing molecule, the electric field component of the light wave interacts with electron and excites it from the initial state \j/i to a final state \|/j. Since this constitutes a relocation of charge, there must be a change in dipole moment during the transition. The probability for the transition is proportional to the square of the integral of the product of the wave function for the ground state v^/i multiplied by an operator M that changes the position of the charge,
multiplied by the wave function for the final state \{/j:
Pr is the probability for the transition and Ry is the transition dipole moment integral.
The wave function can be written in terms of electronic, vibronic, and spin wave functions:
V(/i=^ei^vi^si
Therefore, the transition moment integral can be rewritten as
Rij2 = <V(/ei |M|\(/ej> <\|/vi |V)/vj> <^i |^j> [ 1.46]
1. Electronic integral Since the operator has the form, M = E er; ( ri is the vector distance
1
of the rth electron from the origin of a fixed coordinate system for the molecule), so it is an
odd function. If R^2 = <M/ei|M|\t/e2>2 is nonzero, \|/ei and \(/e2 must have different symmetries. Generally for simplicity, one just needs to consider the highest occupied one-electron
molecular orbitals (HOMO) and the lowest unoccupied molecular orbitals (LUMO). Filled
molecular orbitals must be even functions.
<odd| oddl odd>2 = (Jodd)2 = 0
<even| oddl odd>2 = (Jeven)2 ^ 0
2. Vibronic integral (Franck-Condon factors) The intensity of a vibronic transition depends
upon the square of the overlap integral of the vibrational wave functions,
2
Ioc<^|vvj>z [1.47]
In Figure 15, a diatomic molecule with the energy curves is considered. In Figure 15a, the ground and excited states have the same equilibrium intemuclear distance fa. The overlap integral f\</vi°^v2 dr will be a maximum for j = 0 for the case in Figure 15a. When there is little
![Figure 22. Crystal structure of [Pditdpan^]](https://thumb-eu.123doks.com/thumbv2/123doknet/5423744.126853/79.918.249.738.282.861/figure-crystal-structure-of-pditdpan.webp)
