Computational model of cardiovascular response
to centrifugation and lower body cycling exercise
The MIT Faculty has made this article openly available.
Please share
how this access benefits you. Your story matters.
Citation
Diaz-Artiles, Ana et al. "Computational model of cardiovascular
response to centrifugation and lower body cycling exercise." Journal
of Applied Physiology 127, 5 (November 2019): 1453-1468 © 2019
the American Physiological Society
As Published
https://doi.org/10.1152/japplphysiol.00314.2019
Publisher
American Physiological Society
Version
Author's final manuscript
Citable link
https://hdl.handle.net/1721.1/130133
Terms of Use
Creative Commons Attribution-Noncommercial-Share Alike
Detailed Terms
http://creativecommons.org/licenses/by-nc-sa/4.0/
TITLE PAGE
1
2
• Title: Computational Model of Cardiovascular Response to Centrifugation and Lower-body
3
Cycling Exercise4
• Authors:5
6
1. Ana Diaz-Artiles17
ORCID identifier: orcid.org/0000-0002-0459-9327
8
Department of Aerospace Engineering
9
Texas A&M University, College Station, TX
10
11
2. Thomas Heldt2
12
ORCID identifier: orcid.org/0000-0002-2446-1499
13
Affiliation:
14
Institute for Medical Engineering & Science
15
Department of Electrical Engineering & Computer Science
16
Massachusetts Institute of Technology, Cambridge, MA.
17
18
3. Laurence R. Young219
Affiliation:20
Department of Aeronautics & Astronautics
21
Massachusetts Institute of Technology, Cambridge, MA.
22
23
• Affiliations:
24
• 1Texas A&M University, College Station, TX
25
2Massachusetts Institute of Technology, Cambridge, MA
26
27
• Contributions to the study:
28
Dr. Diaz-Artiles is the main contributor to the article. She implemented the computational
29
model, conducted to human experiments, analyzed the data, prepared figures, and drafted,
30
revised, and approved the final manuscript. Prof. Heldt provided expertise concerning the
31
cardiovascular modeling aspects and interpretation of the experimental data. He also edited,
32
revised, and approved the final version of the manuscript. Prof. Young contributed with the
33
overall supervision and management of the research project, including its relevance to artificial
34
gravity for space travel, and edited, revised, and approved he final version of the manuscript.
35
36
• Running Head: Cardiovascular Model of Centrifugation and Exercise
37
38
• Address for Correspondence:
39
Ana Diaz Artiles, PhD
40
Texas A&M University, Aerospace Engineering
41
620B H. R. Bright Building
42
Texas A&M University
43
Tel. 979-845-118744
[email protected]45
46
47
ABSTRACT:
48
Short-radius centrifugation combined with exercise has been suggested as a potential countermeasure
49
against spaceflight deconditioning. Both the long-term and acute physiological responses to such
50
combination are incompletely understood. We developed and validated a computational model to study
51
the acute cardiovascular response to centrifugation combined with lower-body ergometer exercise. The
52
model consisted of 21 compartments, including the upper body, renal, splanchnic, and leg circulation, as
53
well as a four-chamber heart and pulmonary circulation. It also included the effects of gravity gradient
54
and ergometer exercise. Centrifugation and exercise profiles were simulated and compared to
55
experimental data gathered on twelve subjects exposed to a range of gravitational levels (1G and 1.4G
56
measured at the feet) and workload intensities (25-100W). The model was capable of reproducing
57
cardiovascular changes (within ±1SD from the group-averaged behavior) due to both centrifugation and
58
exercise, including dynamic responses during transitions between the different phases of the protocol.
59
The model was then used to simulate the hemodynamic response of hypovolemic subjects (blood
60
volume reduced by 5-15%) subjected to similar gravitational stress and exercise profiles, providing
61
insights into the physiological responses of experimental conditions not tested before. Hypovolemic
62
results are in agreement with the limited available data and the expected responses based on
63
physiological principles, although additional experimental data are warranted to further validate our
64
predictions, especially during the exercise phases. The model captures the cardiovascular response for a
65
range of centrifugation and exercise profiles, and it shows promise in simulating additional conditions
66
where data collection is difficult, expensive, or infeasible.
67
68
KEYWORDS:
69
Mathematical model, short-radius centrifuge; orthostatic intolerance; cardiovascular simulation; lower
70
body ergometer exercise.
71
72
NEW & NOTEWORTHY:
73
Artificial gravity combined with exercise is a potential countermeasure for spaceflight deconditioning,
74
but the long-term and acute cardiovascular response to such gravitational stress is still largely unknown.
75
We provide a novel mathematical model of the cardiovascular system that incorporates gravitational
76
stress generated by centrifugation and lower-body cycling exercise, and we validate it with experimental
77
measurements from human subjects. Simulations of experimental conditions not used for model
78
development corroborate the model’s predictive capabilities.
79
80
INTRODUCTION
81
Artificial gravity (AG) generated by centrifugation is a promising countermeasure to mitigate
82
the detrimental effects of weightlessness during space missions (7). Previous ground-based studies have
83
shown that exposure to centrifugation can improve cardiovascular responses to orthostatic stress (18, 35,
84
44, 55), especially if centrifugation is combined with exercise (20, 27–30, 51–53). Artificial gravity has
85
also been proposed as a potential countermeasure to mitigate the recently discovered Spaceflight
86
Associated Neuro-Ocular Syndrome (SANS) (6). Before implementing AG in space, however,
87
additional research efforts are needed to determine the parameters that are most effective, including the
88
angular velocity and radius of the centrifuge, and to characterize the cardiovascular response to these
89
stressors under varying physiological baseline conditions (6). The expensive and time-consuming nature
90
of these experimental studies with human subjects makes the use of computational tools a very
91
attractive approach to systematically study human responses under these conditions.
92
93
Computational cardiovascular models can be used to describe and, more importantly, to predict,
94
human responses in cases where data collection is difficult, expensive, or infeasible. Despite the
95
complexity of the human body, computational approaches of various kinds and anatomical resolution
96
have been successfully applied to a variety of applications, from very detailed three-dimensional models
97
of selected regions, to low-dimensional models representing more aggregate system behavior (i.e.
98
lumped-parameter models). The selection of the type of model is primarily driven by the objectives of
99
the analysis as well as the availability of computational resources (46) and data to specify model
100
parameters and validate the model behavior. In the present work we are interested in the overall,
short-101
term, cardiovascular response to centrifugation combined with exercise and thus, the implementation of
102
a lumped-parameter model seems the appropriate approach.
103
104
One of the first systematic approaches of quantitative, system-level modeling of cardiovascular
105
regulation was developed by Guyton (21, 22). He was one of the first to apply a system engineering
106
approach to quantify and analyze various aspects of cardiovascular function using mathematical and
107
graphical techniques before computers became widely available. Since then, multiple models have been
108
developed to study cardiovascular responses to gravitational stress, including head up tilt (HUT) (25,
109
26, 34), lower-body negative pressure (25, 37), standing-up (15, 38, 39), and centrifugation (54).
110
However, none of these studies have evaluated the effects of centrifugation combined with exercise. The
111
incorporation of the exercise response to the already very complex cardiovascular regulatory
112
mechanisms brings additional physiological and methodological challenges (36) that we attempt to
113
address in our modeling efforts.
115
We developed a lumped-parameter model of the cardiovascular system able to capture transient
116
hemodynamic responses to lower-body ergometer exercise under gravitational stress generated by a
117
short-radius centrifuge. The model was built on previous work developed to study short-term
118
hemodynamic responses to centrifugation (54) and exercise (8), but not both mechanisms together at the
119
same time. Our cardiovascular model includes the systemic circulation, four cardiac chambers, and the
120
pulmonary circulation, divided in several parallel branches to account for the gravity gradient associated
121
with short-radius centrifugation. The model also includes the two major short-term neural control
122
mechanisms, the arterial baroreflex and the cardiopulmonary reflex, as well as important exercise
123
mechanisms such as the muscle-pump effect. Experimental measurements collected during a human
124
subject experiment at the Massachusetts Institute of Technology (MIT) short-radius centrifuge were
125
used for validation purposes.
126
127
DESCRIPTION OF THE CARDIOVASCULAR MODEL
128
The cardiovascular system was represented using a lumped-parameter model in which the
129
different vascular segments are represented using electric circuit analogs grouped in compartments.
130
Extensive details of the model architecture and parameters have been published elsewhere (14) and are
131
summarized in the Appendix. A general description of the most relevant features of the model is
132
presented in the following paragraphs.
133
134
The model architecture is shown in Figure 1. It contains 21 compartments grouped into four
135
main sections (head and arms, thorax, abdomen, and legs), representing the systemic circulation (15
136
vascular compartments including the arterial system, microcirculation, and the venous system), the
137
cardiac chambers (4 cardiac compartments represented by time-varying elastance models), and the
138
pulmonary circulation (2 additional compartments connected by a microvascular resistance, which we
139
assumed to be linear).
140
141
Figure 2 shows the architecture of a generic compartment (25, 50). The lumped physical
142
characteristics of each compartment are defined by a resistance 𝑅 and a capacitive element 𝐶 that
143
relates the distending volume 𝑉 , stored in the segment to transmural pressure ∆𝑃 = 𝑃 − 𝑃 , . The
144
pressure source 𝑃 , represents the external pressure acting on the vessels, such as intra-thoracic
145
pressure, intra-abdominal pressure, or muscle-pump pressure. Additionally, the pressure source 𝑃 ,
146
represents the hydrostatic pressure related to the gravitational orthostatic stress. Other parameters
associated with each compartment (not shown in Figure 2) include zero-pressure filling volume 𝑉, ,
148
and the anatomical vertical length 𝑙 , (superior-to-inferior extension of the vascular segment).
149
150
The flow in each compartment
𝑞
is calculated using the following constitutive relation:151
𝑞 =𝑃 − 𝑃 + 𝑃 ,
𝑅 (1)
where 𝑃 , 𝑃 are the compartment pressures, 𝑃, is the hydrostatic pressure induced by
152
centrifugation, and 𝑅 is the resistance of the nth compartment.
153
154
The transmural pressure in each compartment, defined as 𝑃 − 𝑃 , , depends on the
155
distending volume 𝑉 , , and the compliance of the compartment 𝐶 , through the following linear
156
relationship (except for Compartments 11–splanchnic, 13–leg, and 14–abdominal; see Figure 1 for
157
compartment numbering scheme):
158
𝑃 − 𝑃 , =𝑉 ,
𝐶 (2)
159
Some compartments incorporate non-linear elements that affect their behavior. For example, the
160
four cardiac chambers (left atrium, left ventricle, right atrium, right ventricle) are described using
time-161
varying elastance models, and the generation of heartbeats is represented using an Integral Pulse
162
Frequency Modulation (IPFM) model (3, 54). Thus, the contractile force of the myocardial wall is
163
represented by the time-varying capacitors that cycle between a low capacitance (systolic) and a high
164
capacitance (diastolic) state of the myocardium. The intra-thoracic pressure (i.e. external pressure in the
165
thoracic compartments) modulates the filling status of the heart. Further details are included in the
166
Appendix. Moreover, the heart compartments also incorporate unidirectional diodes that represent the
167
cardiac valves and prevent reversal flow. Two vein compartments (Compartments 4–upper body and
168
13–leg) also include diodes to capture the unidirectional nature of the venous flow due to the presence
169
of venous valves.
170
171
Non-linear pressure-volume relationships are also incorporated in some compartments
172
(Compartments 11–splanchnic, 13–leg, and 14–abdominal) to capture their non-linear response when
173
operating at high transmural pressures. In those compartments, the pressure-volume relationship is
174
defined as:175
𝑉, = 𝑉, + 2𝑉 , 𝜋 ∙ 𝑎𝑟𝑐𝑡𝑎𝑛 𝜋𝐶 , 2𝑉 , ∙ ∆𝑃 𝑓𝑜𝑟 ∆𝑃 > 0, 𝑛 = 11,13,14 (3)where 𝑉, denotes the total volume, 𝑉, denotes the venous unstressed volume or zero-pressure filling
176
volume, 𝑉 , denotes the distending volume limit (𝑉 , =1500 mL, 𝑉 , =1000 mL,
177
𝑉 , =650 mL), 𝐶, denotes the vascular compliance at zero transmural pressure, and ∆𝑃 denotes
178
the transmural pressure in the nth compartment.
179
180
The cardiovascular model was implemented in MATLAB Simulink. The distending volume is
181
used as the state variable, yielding the following expression for each compartment based on volume
182
conservation principles:
183
𝑑
𝑑𝑡𝑉 , (𝑡) = 𝑞 − 𝑞 (4)
where 𝑞 and 𝑞 correspond to the inward and outward flow in the nth compartment. The complete
184
cardiovascular model is defined by a set of coupled-first order differential equations.
185
186
Arterial baroreflex and cardiopulmonary control systems
187
The arterial baroreceptors and the cardiopulmonary receptors are the two major
neurally-188
mediated control systems that ensure short-term cardiovascular regulation in the presence of external
189
disturbances such as orthostatic stress or exercise. They are represented in our model as set-point
190
controllers that serve to minimize an error signal, namely the deviation of a specific local pressure from
191
a pre-defined set-point value, by adjusting various effector mechanisms in a feedback configuration via
192
autonomic pathways. To model the arterial baroreflex, we considered a single lumped baroreceptor in
193
the carotid sinus, assumed to be located 25 cm cranial of the heart. Thus, the carotid sinus pressure, 𝑃 ,
194
is calculated as the aortic arch pressure 𝑃 minus the hydrostatic column acted upon by short-radius
195
centrifugation. The error signal between the measured pressure and the arterial pressure set-point, 𝑃 ,
196
is fed into two linear time-invariant filters (sympathetic and parasympathetic (54)). The resultant signals
197
are then scaled by effector-specific gain values and then applied to the effector variables. The arterial
198
baroreflex effector variables include heart rate, right and left ventricular contractility, and the peripheral
199
resistance and venous unstressed volume of the upper body, renal, splanchnic, and leg compartments.
200
201
The cardiopulmonary reflex is represented using a similar feedback control loop in which the
202
measured variable is the right atrial transmural pressure, ∆𝑃
,
and is compared to the cardiopulmonary203
set-point pressure, 𝑃 . The gains of the sympathetic filter are also specific to each effector variable.
204
The cardiopulmonary reflex effector variables include peripheral resistances and venous unstressed
205
volumes of the upper body, renal, splanchnic, and leg compartments. Both contributions from the
arterial baroreflex and the cardiopulmonary reflex constitute the total neurally-mediated global reflex
207
contribution to each effector variable.
208
209
Centrifugation
210
We aim to simulate the term cardiovascular responses to gravitational stress during
short-211
radius centrifugation. Centrifugation is modeled by: 1) changes in the hydrostatic pressure in all
212
systemic compartments; 2) changes in intrathoracic pressure due to the weight of the liver being pulled
213
in the caudal direction, implemented as changes in the external pressures of the thoracic compartments;
214
and 3) changes in total blood volume due to the increase in transcapillary fluid flow into the dependent
215
vasculature. Short-radius centrifugation induces a gravity gradient along the long body axis in which the
216
hydrostatic pressure depends on the angular velocity and the distance from the center of rotation.
217
Compartments in the lower body are subjected to a higher hydrostatic pressure than compartments in the
218
upper body. The compartmental nature of the model, particularly on the Gz axis, facilitates the
219
representation of these hydrostatic changes along the body’s longitudinal axis. Important variables
220
during centrifugation are angular velocity and distances of the CV compartments to the center of
221
rotation (which are dependent of subjects’ anthropometry and positioning). The expressions in Table 1
222
define the gravitational stress imposed on the individual compartments during gradual exposure to
223
short-radius centrifugation with angular velocity ranging from 𝜔 = 0 to 𝜔 = 𝜔 . Additional details
224
of these mathematical expressions and their implementation in the model are included in our previous
225
publications (13, 14).226
227
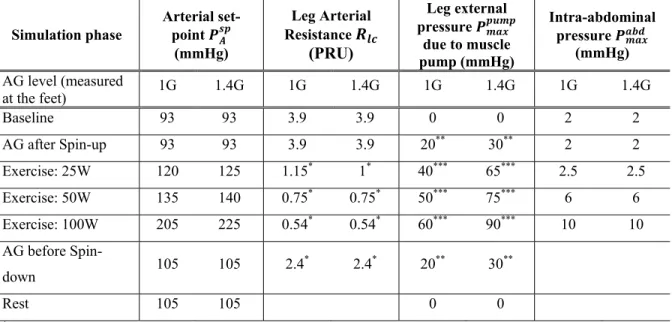
Exercise228
Exercise causes circulatory adjustments that are essential to satisfy the metabolic needs of
229
exercising muscles. These adjustments include local vasodilation in exercising muscle groups,
230
sympathetic nervous system activation, an increase in cardiac output, and an increase in arterial blood
231
pressure above the baseline level. In our modeling effort the effects of exercise are represented using the
232
following four mechanisms:
233
234
Decrease in leg arterial resistance. Due to the higher metabolic demand during exercise, arterial
235
resistance decreases locally in the exercising muscles to increase local blood flow to satisfy the local
236
metabolic demand, and remove metabolic end products. In our modeling effort, we simulate lower-body
237
cycling exercise by disconnecting the leg resistance from the control systems at the onset of exercise
238
and manually adjusting it to match previously gathered experimental data (10) according to the
239
following expression:
𝑅 (𝑡) = 𝑅 + 𝑅 − 𝑅 (1 − 𝑒 ⁄ ) (5)
where 𝑅 is the leg vascular resistance immediately before the onset of an exercise phase, 𝑅 is the
241
final leg vascular resistance for a given exercise intensity, and 𝜏 is the time constant governing the
242
changes in local vascular resistance.
243
244
Leg muscle pump effect. During exercise, muscles exert a pump effect by squeezing the veins while
245
contracting, thus facilitating the return of blood to the heart. In our model, muscle pump effects are
246
simulated by varying the external pressure at the venous leg compartment periodically, following a
247
cycling cadence of 1 rev/sec (similar to the subjects’ experimental data). The leg external pressure due
248
to the muscle pump effect, 𝑃 , is represented according to:
249
𝑃 = ⎩ ⎪ ⎨ ⎪ ⎧ 𝑃 1 2(1 − cos(4𝜋𝑡)) 0 ≤ 𝑡 ≤ 1 4⁄ 𝑠𝑒𝑐 𝑃 1 4⁄ ≤ 𝑡 < 1 2⁄ 𝑠𝑒𝑐 𝑃 1 2(1 + cos(4𝜋(𝑡 − 1 2⁄ ))) 1 2⁄ ≤ 𝑡 < 3 4⁄ 𝑠𝑒𝑐 0 3 4⁄ ≤ 𝑡 < 1 𝑠𝑒𝑐 (6)where 𝑃 is the maximal leg external pressure and depends on the exercise intensity. In addition to
250
the periodic muscle pump effect during cycling, an external muscle pump pressure 𝑃 , proportional to
251
the centrifugal force, was added to the venous leg compartment when subjects were not cycling while
252
they were being centrifuged (i.e. spin-up phase, AG-alone phases, and spin-down phase, see Figure 3).
253
This pressure models the effects of continuous leg muscle activation when subjects are pushed against
254
the pedals by centrifugal force (similar to the muscle pump caused by “active” standing).
255
256
Increase in intra-abdominal pressure. Abdominal pressure increases during exercise due to the
257
contraction of abdominal muscles. This effect is represented as an increase in external pressure in the
258
abdominal compartments (7, 8, 9, 10, 11, and 14), according to the following exponential function:
259
𝑃 = 𝑃 (1 − 𝑒 ⁄ ) (7)
where 𝜏̂ is a time constant on the order of a few seconds and 𝑃 is the maximal external pressure that
260
depends on the intensity of the exercise.
261
262
Increase in arterial blood pressure. With increasing exercise intensity, arterial blood pressure
263
progressively increases over baseline conditions, which cannot be explained on the basis a simple
set-264
point feedback control system as implemented here. To capture the increased arterial blood pressure, we
265
made the set-point reference pressure, 𝑃 , an adjustable parameter that depends on the exercise
266
intensity. Thus, 𝑃 is considered a tunable parameter to the model. Increases in 𝑃 increase
sympathetic activity through the arterial baroreceptor control systems previously described. Thus,
268
consequences of increasing the set-point pressure 𝑃 include increases in heart rate, ventricular
269
contractility, total peripheral resistance (except in the working muscles), and venous tone.
270
271
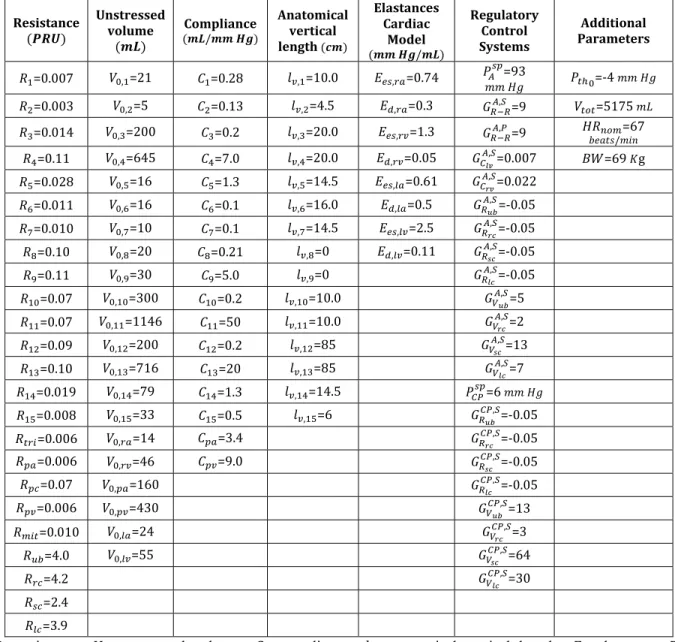
Parameters
272
Most of the numerical values assigned to the model parameters have been estimated from the
273
literature (24, 25). For each compartment, the parameter assignments include values for resistance R,
274
compliance C, zero-pressure filling volume 𝑉, , and anatomical vertical length 𝑙 , . The compartmental
275
parameters and, in addition, the microvascular resistance values, pulmonary and cardiac parameters, as
276
well as parameters related to the control systems are provided in Table 4 in the Appendix. The
277
parameters related to exercise are specific to our individual simulation profile and are detailed below.
278
279
SIMULATION PROFILE AND EXPERIMENTAL DATA
280
We simulated a centrifugation profile identical to the one implemented in a human experiment
281
conducted on the MIT centrifuge (10). The experiment was approved by the Committee on the Use of
282
Humans as Experimental Subjects at MIT. Each subject gave written informed consent to participate in
283
the study. Experimental methods and data analysis are fully described in a previous publication (10). In
284
summary, twelve subjects were positioned in the right-side-down lateral decubitus position with their
285
head positioned at the center of rotation of the MIT centrifuge. The radius of the centrifuge was limited
286
to 1.4m to simulate the space limitations inherent to the short-radius centrifuge proposed for the
287
International Space Station, as part of the “Artificial Gravity with Ergometric Exercise as the
288
Countermeasure for Space Deconditioning in Humans” (AGREE) project (13). Thus, subjects adopted a
289
crouched posture that was taken into account in our simulations by adjusting the leg anatomical vertical
290
lengths 𝑙 and 𝑙 . Subjects were exposed to different levels of centrifugation while performing
291
ergometer exercise at three intensities (25W, 50W, and 100W). The protocol, shown in Figure 3,
292
includes the following phases: baseline at rest (3 min), spin-up to the desired G-level (~100 sec), AG
293
phase for subjects to get used to the new gravitational environment (~2 min), the exercise portion of the
294
protocol, which includes three exercise intensities and transitions between them (15 min), another AG
295
phase with no exercise for subjects to partially recover (2 min), and spin-down deceleration phase (1
296
min). The entire protocol was completed in 25 minutes. During the centrifugation runs, continuous,
297
beat-to-beat cardiovascular data were collected using a non-invasive monitoring system (Nexfin
298
monitor, Edwards Lifesciences Corporation, Irvine, CA). Collected variables include heart rate (HR),
299
mean arterial pressure (MAP), systolic blood pressure (SBP), diastolic blood pressure (DBP), pulse
300
pressure (PP), stroke volume (SV), cardiac output (CO), and total peripheral resistance (TPR).
302
Simulation approach
303
A comparatively small set of physiologically plausible parameters from our model were
304
adjusted to simulate the centrifugation and exercise profiles described above. First, total blood volume
305
was set to V = 5175 ml to closely represent our study population. This choice was based on an
306
average of 75 ml of blood per kg of body mass (17, 25, 42) and our experimental subjects’ average
307
weight (± standard deviation) of 69.3 ± 11.6 kg.
308
Second, the angular velocity, 𝜔(𝑡), closely replicated the experimental protocol, increasing
309
from 0 rpm to 𝜔 during the spin-up phase, and decreasing back to 0 rpm during the spin-down
310
phase, in both cases following quarter-sine profiles. The experimental AG conditions included 1G and
311
1.4G at the feet, which were the settings of the MIT centrifuge corresponding to a maximum angular
312
velocity of 28.6 and 33.9 rpm, respectively. 𝑃 was also adjusted according to the centrifugation
313
level.
314
Third, the three exercise-related parameters (𝑃 , 𝑃 , 𝑅 ) were manually adjusted at each
315
workload stage to match the population-averaged MAP and TPR responses (as judged by visual
316
inspections). The decreases in total vascular resistance were simulated by disconnecting the leg
317
peripheral resistance
𝑅 (𝑡)
from the control systems at the onset of exercise, and matching the318
experimentally observed decreases by appropriately setting the resistance parameters of Eqn. (5). This
319
process was repeated at every workload transition, adjusting the final leg resistance and the time
320
constant to match the experimental data. Similarly, the arterial blood pressure set-point, 𝑃 , and the
321
external pressure due to leg muscle pump, 𝑃 , were manually adjusted such that the simulated MAP
322
matched the experimental data. The nominal 𝑃 was 93 mmHg; it was increased with increasing
323
exercise intensity. The external pressure, 𝑃 , was zero at rest and also increased with increasing
324
exercise intensity. Finally, the maximal intra-abdominal pressure, 𝑃 , was also increased with
325
increasing exercise intensity in accordance with measurements from the literature (24, 25). For all
326
parameters, transitions between exercise phases were defined by exponential functions with the
327
appropriate time constants to match the experimental data. Table 2 summarizes all exercise input
328
parameters used in our simulations.
329
330
331
RESULTS
332
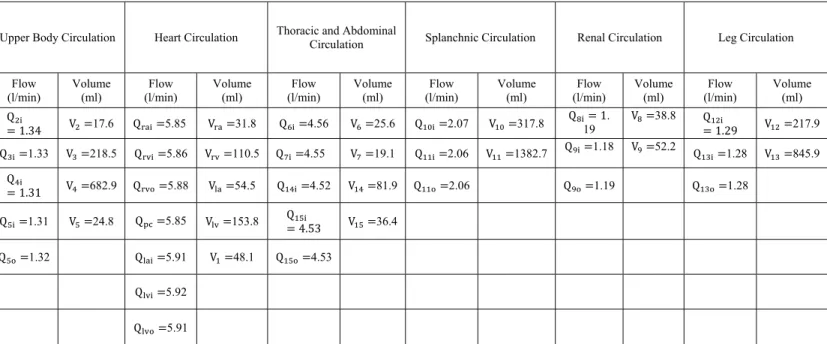
Baseline Steady State Simulation
Results during steady-state simulations in supine position show that blood flow and volume
334
distributions to the different vascular beds are within the range of the normal population (47). The
335
distribution of CO to the upper body is 22% (normal range is 15%-29%), 20% to the kidney
(18%-336
24%), 35% to the splanchnic compartment (24%-48%), and 22% to the lower body (14%-33%).
337
Additional details about flow and volume distributions among the compartments are given in Table 5 in
338
the Appendix.339
340
Centrifugation Simulation341
Figure 4 and Figure 5 show the simulated and experimental cardiovascular responses to
342
centrifugation and ergometer exercise at 1G and 1.4G (measured at the feet), respectively. All major
343
hemodynamic parameters generated by the model stayed within ± 1SD of the experimental data at
344
almost all times throughout the entire protocol.
345
346
To simulate the exercise protocol, the simulated MAP and TPR responses were matched to the
347
population-averaged experimental responses by adjusting the values of the pressure set-point 𝑃 , leg
348
external pressure 𝑃 , and 𝑅 leg arterial resistance were selected for each exercise level (see Table
349
2). The top graphs in Figure 4 and Figure 5 show that our matching approach captures MAP and TPR
350
very closely. The nominal arterial set-point 𝑃 was 93 mmHg, and this value was maintained until the
351
beginning of exercise, when the arterial set-point increased according to the exercise intensity (see
352
Table 2). Similarly, during the spin-up phase the simulated TPR responded appropriately to the
353
gravitational stress created by centrifugation: at the beginning of the spin-up phase, the simulated
354
resistance slightly decreased followed by a noticeable increase due to the control system reflexes. This
355
behavior of the TPR is typical of active standing maneuvers (26, 43). At the beginning of the exercise
356
(once the spin-up and AG phases were completed) the leg microvascular resistance was disconnected
357
from the controls and adjusted to decrease such that the simulated TPR matched the experimental data.
358
Thus, the 𝑅 dynamics was composed of three transitions corresponding to the three workload
359
intensities simulated, as shown in the figures.
360
361
The rest of the cardiovascular variables are considered outputs of the simulation. They largely
362
reproduced the general trend of the experiment data, including baseline steady-state conditions as well
363
as the dynamic changes during spin-up/spin-down and exercise transitions. The arterial baroreflex and
364
the cardiopulmonary reflex responded properly to the cardiovascular stress created by centrifugation. In
365
addition, the three exercise phases were very distinguishable from one another, and the time constants
366
during transitions were particularly well matched. During the exercise portion of the protocol, the cyclic
muscle pump action is noticeable in most of the simulated cardiovascular variables, making the
368
computational responses oscillate around their mean responses. Thus, during exercise, the simulated
369
responses in Figure 4 and Figure 5 manifest themselves as “thicker” lines, due to the periodic external
370
pressure imposed in the venous leg compartment simulating the effects of the cycling exercise
371
372
The simulated heart rate response replicates the experimental data well during all phases of the
373
protocol. Simulated SBP, DBP, SV, and CO are slightly underestimated, especially at higher workloads,
374
though they match the general trends of the data and generally stay within ±1 SD of the experimental
375
data. The PP simulations reproduce the experimental data for lower work rates (25W and 50W) but
376
underestimate the experimental results for higher work rates (100W). The underestimation of the PP
377
seemed to be driven by the underestimation of systolic pressures, particularly during the intensive
378
exercise phase at 100W (~7% underestimation in both gravitational scenarios), causing the PP
379
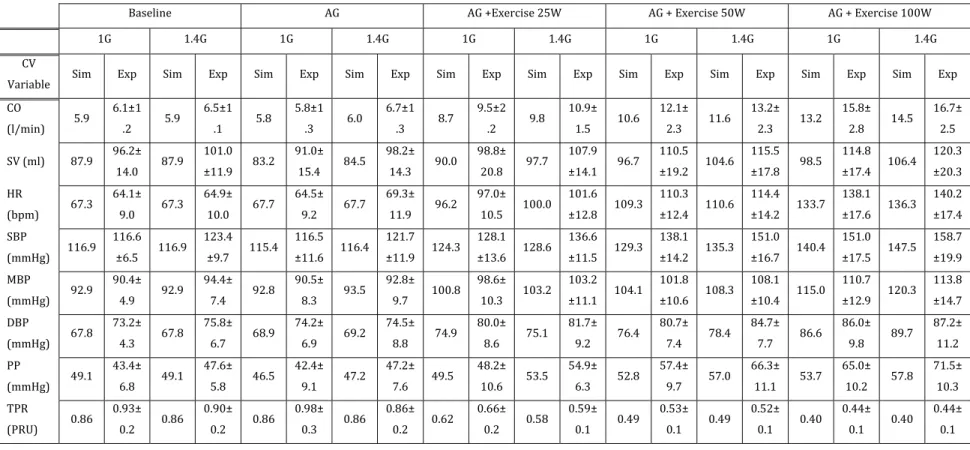
underestimation to reach 17% (1G) and 19% (1.4G) at this particular exercise phase. All in all, the
380
systolic, diastolic, and mean ABP were maintained within 10% of experimental values. Table 3
381
summarizes the simulated and experimental averages of the CV variables during the different phases of
382
the simulation: baseline, AG alone, exercise at 25W, exercise at 50W, and exercise at 100W. Averages
383
were calculated using the last two minutes of each protocol period, in order to avoid the transient
384
episodes between phases.
385
386
Case study: Centrifugation of Hypovolemic Subjects due to Microgravity Exposure
387
Having developed and validated the model for centrifugation and exercise, we can use this
388
model to characterize the cardiovascular response in subjects with specific health conditions, or
389
subjected to new gravitational stress configurations. Additionally, the model can also be used to help
390
test hypotheses about the cardiovascular response in additional scenarios. Physiological reasoning can
391
be used to predict in a qualitative manner specific responses driven by changes in certain parameters.
392
However, the specific magnitude of a response, or degree of impact of particular parameter changes are
393
harder to predict by reasoning alone, given the nonlinear and time-varying nature of the cardiovascular
394
system. As an example, we chose to explore the cardiovascular response to hypovolemic conditions.
395
This scenario is particularly relevant for human spaceflight, since astronauts lose approximately 10% of
396
their blood volume when exposed to extended microgravity (5, 49), which has proven to be problematic
397
when returning to a gravitational environment such as Earth (4, 33), or may become an issue in the
398
future when microgravity adapted individuals are exposed to artificial gravity during spaceflight (12, 19,
399
44, 45). We conducted additional simulations using the same exercise protocol and the centrifugation
profile at 1G to investigate cardiovascular responses when blood volume was reduced by 5, 10, and 15%
401
with respect to the euvolemic baseline (nominal 𝑉 =5175 𝑚𝐿).
402
403
Results are shown in Figure 6 and provide quantitative information about the changes in cardiovascular
404
variables to centrifugation combined with lower-body ergometer exercise. MAP decreases with
405
decreasing levels of blood volume, despite the progressively larger increases in heart rate. The MAP
406
reduction seems to be driven by reduction in SBP, especially during the no-exercise portions of the
407
protocol (BL and AG) where DBP stays relatively constant across all blood volumes tested. PP, SV, and
408
CO also decrease with reducing levels of blood volume. All changes are generally exacerbated at higher
409
work rates, except for HR and TPR, where the responses at 100W across the different blood volume
410
conditions do not differ greatly.
411
412
DISCUSSION
413
Several studies have investigated the short-term hemodynamics response of exercise in the
414
upright and supine posture (1, 11), and as a potential countermeasure in ground-based bedrest studies
415
(40). Our focus here is on the acute cardiovascular response to a gravitational stress that can be
416
recreated in space and that is not constant along the major body axis. We developed a lumped-parameter
417
model of the cardiovascular system to simulate the short-term hemodynamic responses to combined
418
gravitational stress and exercise. In particular, gravitational stress was generated by centrifugation of
419
subjects using a short-radius centrifuge, therefore generating a high gravity gradient along the long axis
420
of the body. The model simulates the hydrostatic pressures among cardiovascular compartments caused
421
by the gravity gradient. In addition, the effects of ergometer exercise were also incorporated in the
422
model, including the increase in blood pressure, the muscle pump effect, the decrease in vascular
423
resistance, and changes in intra-abdominal pressure. Finally, the model was programmed to recreate the
424
25-min exercise protocol experienced by 12 subjects in a previous human experiment conducted at MIT
425
(10). Although there have been other studies investigating centrifugation combined with ergometer
426
exercise (16, 27–29, 45, 48, 51), these studies have mainly focused on physiological responses before
427
and after a specific intervention (e.g. bed rest or training protocol) and not during the centrifugation
428
sessions. Thus, the cardiovascular data taken during the MIT centrifugation experiments were used to
429
calibrate and evaluate the computational model. Thus, we are combining mathematical modeling and
430
human experiments in a synergistic manner. On the one hand, experiments are necessary for specifying
431
model parameters and for model validation; on the other hand, models allow for flexibility to investigate
432
physiological mechanisms under consideration, enhance experimental data interpretation, and serve as a
433
vehicle to test competing hypothesis.
435
Generally, the cardiovascular model matched the dynamic cardiovascular response during the
436
25-min exercise protocol quite well. It showed a slight tendency to underestimate some of the
437
cardiovascular variables, particularly SV, and PP at higher workload intensities, and to a lesser extent,
438
CO. These results could be better adjusted by modifying some of the numerous parameters that are built
439
in the model. However, it is important to emphasize that the purpose of these simulations is to
440
intentionally limit the number of inputs and not to exert the full flexibility of the model to reduce the
441
error between the experimental and simulated responses. A small number of parameters, namely TPR
442
and MBP, have been constrained to determine if the resulting simulations capture the physiologic
443
response over a range of exercise levels and AG regimes. The multi-compartment model has more than
444
100 parameters and it can be manipulated to perfectly match the cardiovascular responses. However, the
445
value of such an exercise is small, as most parameters will have negligible influence on the output and
446
the resultant solution will therefore not be unique and will not provide much physiological insights.
447
448
Overall, the cardiovascular model developed in this research effort provides unique information
449
about the cardiovascular responses to gravitational stress and exercise. Model results and comparisons
450
during the baseline period are particularly interesting since they provide a good indication of the
451
cardiovascular modeling performance without any stressor such as centrifugation or exercise. A finite
452
number of hemodynamic compartments and the primary exercise mechanisms were included in the
453
model. Although we recognize that exercise is a particularly complex activity form the physiological
454
modeling point of view, our results show that our model included enough vascular and exercise
455
mechanisms to attain suitable accuracy, at least within the selected ranges of AG and exercise intensity.
456
As Reisner and Heldt pointed out (41), this refers to the “immortal problem of modeling”: creating a
457
model simple enough to feasibly determine the outputs with enough accuracy, without including
458
superfluous complexity that can make difficult the fundamental understanding of the model (i.e. how
459
individual parts interact with each other).
460
461
To explore the physiological consequences of centrifugation we further studied quantitative
462
responses to centrifugation and exercise in hypovolemic subjects, with reduction of 5, 10, and 15% of
463
total blood volume. There is limited experimental data in the literature to perform a direct comparison
464
between our simulations and hemodynamic responses from hypovolemic subjects subjected to
short-465
radius centrifugation an exercise. Thus, we base our comparison to a similar study that used tilt tests
466
maneuvers to study orthostatic stress. Linnarsson and his colleagues (35) investigated orthostatic
467
tolerance in hypovolemic subjects after five days of bedrest. Subjects lost between 8-14% of blood
volume during the 5-day bed rest, and their short-term, post-bedrest HR, SYS, and DIA responses
469
during a tilt test (80º upright) changed approximately +29%, −15%, and −5% respectively, with respect
470
to pre-bed rest. Our data indicate that hypovolemic subjects presenting blood volume losses between
10-471
15% will also experience increases in HR (+14 to 17%) and decreases in SYS (−10.5 to −15.6%) and
472
DIA (−2.8 to −5.7%). We expect to see less significant changes in a short-radius centrifuge due to the
473
presence of a strong gravity gradient that makes the gravitational stress less intense than being exposed
474
to constant 1G gravitational environment. Thus, our simulations seem to be in agreement with the
475
limited available data and the expected responses based on physiological principles. Additional
476
experiments are warranted to further validate the predicted values from our model, particularly the ones
477
involving exercise. However, these predictions are already providing insightful information about
478
experimental conditions not tested before.
479
480
Limitations
481
We chose to represent the cardiovascular behavior using a lumped-parameter model. This
482
approach is unable to simulate pulse wave propagation phenomena such as the changes in arterial
483
pressure waveform as it propagates through the arterial system (31, 50) and might therefore be
484
responsible for our underestimation of systolic blood pressure at higher centrifugation level and exercise
485
regimes. Despite this limitation our model was able to reproduce realistic responses at a lower
486
computational cost. Inertial effects were also not included in the model causing, for example, the
487
absence of the dichrotic notch typically present in the arterial and pulmonary arterial waveforms during
488
closure of the semilunar valves. Inertial effects become important when studying intra-beat changes
489
(within a cardiac cycle), which is not the case in the present study. Inertial effects have been estimated
490
to account for less than 1% of stroke volume and mean arterial pressure (9) and therefore they have been
491
neglected.
492
We have also not taken into account possible non-linear cardiac effects. Both systolic and
493
diastolic pressure-volume relationships were assumed to be linear, which is reasonable at normal filling
494
pressures, but these relationships become non-linear at higher filling pressures. Simulations of
495
pathologically high pressures were beyond of the scope of this work, and for the purpose of the
496
simulations presented here, the pressure-volume relationships were assumed linear. Additionally, the
497
unstressed volume was assumed to be static throughout the cardiac cycle and the same for the diastolic
498
and systolic pressure-volume relationships. Typically, the end-systolic unstressed volume is between
499
25-40% lower than its diastolic counterpart (2, 32), indicating a small but potentially significant
500
contribution to stroke volume, thus decreasing the underestimation seen in our simulations.
Viscoelastic stress-relaxation effects of the systemic veins were also not included in our
502
modeling effort. This phenomenon refers to the intrinsic ability of the vascular walls to stretch slowly
503
when the pressure rises and to contract slowly when the pressure falls (23, 26). This effect becomes
504
important when studying very short-term (~30 s) dynamic blood pressure responses after exposure to
505
passive head-up tilt, due to the altering of the time-course of venous pooling to the lower body and thus,
506
limiting the blood pressure dip typically seen during active standing (26). In our work we focused on
507
steady-state cardiovascular responses during active exposure to centrifugation and therefore these
508
effects were also neglected. We have also not taken into account breathing-related changes in
509
intrathoracic pressure. As the depth of breathing increases with increasing exercise, the lowering of
510
intrathoracic pressure aids in venous return at higher exercise levels. We have also assumed that the
511
resistance changes due to exercise are largely determined by the arteriolar vasodilation and that the
512
muscle pump primarily affects the filling state of the leg veins.
513
Finally, we have already commented on the difficulty of assigning numerical values to all the
514
parameters of the model. The degree to which our model reproduces the experimental data suggests that
515
we have included all the major features with a reasonable degree of parameter accuracy. Sensitivity
516
analysis techniques could elucidate the influence of each parameter on the model outputs to determine
517
the subset of physiological parameters that dominate the model response. This could be further related
518
to individual differences seen in hemodynamic responses to gravitational stress across specific
519
population, such as astronauts coming back to Earth after being exposed to microgravity conditions.
520
521
Conclusion
522
We have developed a computational model of the cardiovascular system capable of reproducing
523
hemodynamic responses during gravitational stress generated by a short-radius centrifuge and
lower-524
body ergometer exercise. The model simulated both transient and steady-state responses that compare
525
well with experimental data gathered on twelve subjects that underwent the same simulated protocol
526
using the MIT short-radius centrifuge. We explored the capabilities of the model to generate new
527
hypotheses and to quantify changes in cardiovascular responses due to variations in an individual
528
parameter (i.e. total blood volume).
529
530
APPENDIX
531
A. Additional Details about the Cardiovascular Model
532
Most of the model equations have already been reported in a previous publication (14), but for
533
completeness, we are including them in this Appendix.
534
535
Cardiac Model
536
The four cardiac chambers are simulated using time-varying elastance models (24, 25). The
537
time-varying elastance in each one of the four cardiac chambers is represented using the equation below,
538
where the time interval of diastolic relaxation 𝑇 is assumed to be one half of the systolic time interval
539
𝑇 :540
𝐸(𝑡) = ⎩ ⎪ ⎨ ⎪ ⎧𝐸 +𝐸 − 𝐸2 ∙ 1 − 𝑐𝑜𝑠 𝜋 𝑡 𝑇 0 ≤ 𝑡 ≤ 𝑇 𝐸 +𝐸 − 𝐸2 ∙ 1 + 𝑐𝑜𝑠 2𝜋𝑇𝑡 𝑇 < 𝑡 ≤32 𝑇 𝐸 2 𝑇 < 𝑡 3 (8)and 𝐸 and 𝐸 are the diastolic elastance and end-systolic elastances in each one of the four cardiac
541
chambers, respectively. The timing parameters include the atrial and ventricular systole duration, 𝑇
542
and 𝑇 , as well as the “P-R interval”, which we defined here as the delay between the onset of the atrial
543
and ventricular contraction 𝑇 . Their values are assumed to be proportional to the square root of the
544
R-R interval length 𝑇 (24, 25) and are defined as
𝑇 (𝑠) = 0.2 𝑇 , 𝑇 (𝑠) = 0.3 𝑇 , and
545
𝑇
(𝑠) = 0.12 𝑇
546
547
The cardiac pacemaker is represented using an Integral Pulse Frequency Modulation (IPFM)
548
model (3, 24, 25, 54), according to:
549
𝑀(𝑡) =
𝑚(𝑡)𝑑𝑡 =
(𝑚 + 𝑚 (𝑡))𝑑𝑡
where 𝑀(𝑡) mimics the behavior of the transmembrane potential in the sino-atrial node whose value at
550
time 𝑡 depends on the cumulative automaticity
𝑚
(assumed constant), and the contribution of neural551
control input
𝑚 (𝑡)
(either sympathetic or parasympathetic activity) since the end of the last heartbeat552
(or cardiac excitation time 𝑡 − 1). A new heartbeat occurs at the time 𝑡 when the transmembrane
553
potential 𝑀(𝑡) reaches a predefined threshold potential Γ = 1, and the time since the previous heartbeat
554
is at least one fifth of the preceding cardiac cycle length:
555
𝑚(𝑡)𝑑𝑡 = 𝑀(𝑡 ) ≥ Γ and 𝑡 − 𝑡 ≥ 0.2(𝑡 − 𝑡 )
557
558
The function 𝑚(𝑡) is defined as the inverse of the instantaneous R-R interval 𝐼(𝑡):
559
𝑚(𝑡) = 1
𝐼(𝑡)=
1 𝐼 + ∆𝐼 (𝑡)
where 𝐼 is the nominal R-R interval, and ∆𝐼 (𝑡) is the control input from the arterial baroreflex
560
control system.561
562
Control Systems563
The baroreceptor control system is modeled using a negative feedback loop and an arterial
564
pressure set-point
𝑃
. Assuming one lumped baroreceptor located in the carotid sinus at 25 cm above565
the heart, the carotid sinus pressure
𝑃
(mmHg) is defined as:566
𝑃 = 𝑃 −1
2∙ 𝜌 ∙ 𝜔 (𝑡) ∙ ((25 + 𝑑) − 𝑑 ) (9)
where 𝑑 is the distance between the head and the center of rotation measured in cm, 𝜌 is the blood
567
density in , and 𝜔(𝑡) is the angular velocity of the centrifuge in rad/s. The feedback error signal
568
𝑒 (𝑡) is calculated as follows:569
𝑒 (𝑡) = 18 ∙ 𝑎𝑟𝑐𝑡𝑎𝑛 𝑃 − 𝑃 18 (10)570
The cardiopulmonary reflex is also modeled using a negative feedback loop and a pressure
set-571
point
𝑃 .
The variable measured is the transmural right atrial pressure ∆𝑃 .and the error signal572
𝑒 (𝑡)
is calculated as follows:573
𝑒 (𝑡) = 5 ∙ 𝑎𝑟𝑐𝑡𝑎𝑛 ∆𝑃 − 𝑃 5 (11)574
The sympathetic and parasympathetic control systems are modeled as two linear time-invariant
575
(LTI) filters. The transfer functions for the sympathetic
𝑠(𝑠)
and parasympathetic𝑝(𝑠)
filters are:576
𝑠(𝑠) = 1 42𝑠 𝑒 + 1 75𝑠 𝑒 + 1 300𝑠 𝑒 (12)577
𝑝(𝑠) = 1 (13)578
Transcapillary Flow and the Interstitial Fluid Volume
Orthostatic stress causes a decrease in intravascular volume due to an increase in transcapillary
580
fluid flow to the dependent vasculature. This phenomenon can be represented using additional RC
581
compartments (24, 25, 54). The transcapillary flow is solved analytically based on the orthostatic stress
582
profile using the equations described in the following section. The solution of the equations depends on
583
two parameters: the time constant 𝜏 = 𝑅𝐶 = 4.6 𝑚𝑖𝑛 (24, 25), and the maximum interstitial volume
584
change 𝑉 = 𝑃 𝐶, given in Table 1. The transcapillary flow is then subtracted from the venous return
585
at the selected compartments where this phenomenon is significant: splanchnic venous (compartment
586
11), leg venous (compartment 13), and abdominal venous (compartment 14). The fractions of interstitial
587
volume and interstitial flow assigned to each compartment are defined below:
588
𝑉 (𝑡) = 𝑃 , ∑ 𝑃 , ∙ 𝑉(𝑡) (14)589
𝑞 (𝑡) = 𝑃 , ∑ 𝑃 , ∙ 𝑞(𝑡) (15)590
where 𝑃 , is the maximum hydrostatic pressure in the nth compartment; and ∑ 𝑃
, is the sum of
591
the maximum hydrostatic pressures of the three compartments (11, 13, and 14).
592
593
Analytical Solutions for the Transcapillary Flow and the Interstitial Fluid Volume
594
The following equations provide an analytical solution for the intercapillary flow and interstitial
595
volume change during gravitational stress.
596
597
Region I: Gradual increase in orthostatic stress over a period of length ∆𝑡.
598
𝑞(𝑡) =𝑉 ∆𝑡 ∙ (1 − 𝑒 ) (16) 𝑉(𝑡) = 𝑉 ∙ 𝑡 ∆𝑡− 𝜏 ∆𝑡 1 − 𝑒 (17)Region II: Full gravitational stress during period of duration 𝑇 .
599
𝑞(𝑡) =𝑉 ∆𝑡 ∙ (1 − 𝑒 ∆ ) ∙ 𝑒 ∆ (18) 𝑉(𝑡) = 𝑉 ∙ 1 − 𝜏 ∆𝑡 1 − 𝑒 ∆ 𝑒 ∆ (19)Region III: Gradual decline in gravitational stress over a period of length ∆𝑡.
600
𝑞(𝑡) =𝑉 ∆𝑡 ∙ 1 + 1 − 𝑒 ∆ 𝑒 ∙ 𝑒 (∆ )−𝑉 ∆𝑡 (20)𝑉(𝑡) = 𝑉 ∙ 1 −𝑡 − (∆𝑡 + 𝑇 ) ∆𝑡 − 𝑉 ∙ 𝜏 ∆𝑡∙ 1 − 𝑒 ∆ ∙ 𝑒 + + 𝑉 ∙ 𝜏 ∆𝑡∙ 1 + 1 − 𝑒 ∆ 𝑒 ∙ 1 − 𝑒 (∆∆ ) (21)
Region IV: Post-orthostatic stress recovery of unspecified length.
601
𝑞(𝑡) = −𝑉 ∆𝑡 ∙ 1 − 𝑒 ∆ ∙ 1 − 𝑒 ∆ ∙ 𝑒 ( ∆ ) (22) 𝑉(𝑡) = 𝑉 ∙ 𝜏 ∆𝑡∙ 1 − 𝑒 ∆ ∙ 1 − 𝑒 ∆ ∙ 𝑒 ( ∆ ) (23)602
Initial Conditions603
The following 23 non-linear algebraic equations are used to find the initial conditions, and they
604
describe the blood flow in the compartments assuming that the system is in steady state (54). The first
605
equation equates the right ventricular stroke volume and the left ventricular stroke volume, and the last
606
equation is based on the conservation of volume equating the difference between the total volume and
607
the unstressed volume, and the distending volume in each compartment.
608
609
𝐶 (𝑃 − 𝑃 ) − 𝐶 (𝑃 − 𝑃 ) = 𝐶 (𝑃 − 𝑃 ) − 𝐶 (𝑃 − 𝑃 ) (24) 𝐶 (𝑃 − 𝑃 ) − 𝐶 (𝑃 − 𝑃 ) = 𝑇 ∙𝑃 𝑅 (25) 𝑇 ∙𝑃 𝑅 = 𝐼 ∙ 𝑃 − 𝑃 𝑅 + 𝑃 − 𝑃 𝑅 (26) 𝐼 ∙𝑃 − 𝑃 𝑅 = 𝐼 ∙ 𝑃 − 𝑃 𝑅 (27) 𝐼 ∙𝑃 − 𝑃 𝑅 = 𝐼 ∙ 𝑃 − 𝑃 𝑅 (28) 𝐼 ∙𝑃 − 𝑃 𝑅 = 𝐼 ∙ 𝑃 − 𝑃 𝑅 (29) 𝐼 ∙𝑃 − 𝑃 𝑅 = 𝐼 ∙ 𝑃 − 𝑃 𝑅 (30) 𝐼 ∙𝑃 − 𝑃 𝑅 = 𝐼 ∙ 𝑃 − 𝑃 𝑅 (31) 𝐼 ∙𝑃 − 𝑃 𝑅 = 𝐼 ∙ 𝑃 − 𝑃 𝑅 + 𝑃 − 𝑃 𝑅 + 𝑃 − 𝑃 𝑅 (32) 𝐼 ∙𝑃 − 𝑃 𝑅 = 𝐼 ∙ 𝑃 − 𝑃 𝑅 (33)𝐼 ∙𝑃 − 𝑃 𝑅 = 𝐼 ∙ 𝑃 − 𝑃 𝑅 (34) 𝐼 ∙𝑃 − 𝑃 𝑅 = 𝐼 ∙ 𝑃 − 𝑃 𝑅 (35) 𝐼 ∙𝑃 − 𝑃 𝑅 = 𝐼 ∙ 𝑃 − 𝑃 𝑅 (36) 𝐼 ∙𝑃 − 𝑃 𝑅 = 𝐼 ∙ 𝑃 − 𝑃 𝑅 (37) 𝐼 ∙𝑃 − 𝑃 𝑅 = 𝐼 ∙ 𝑃 − 𝑃 𝑅 (38) 𝐼 ∙𝑃 − 𝑃 𝑅 = 𝐼 ∙ 𝑃 − 𝑃 𝑅 + 𝑃 − 𝑃 𝑅 + 𝑃 − 𝑃 𝑅 (39) 𝐼 ∙𝑃 − 𝑃 𝑅 = 𝐼 ∙ 𝑃 − 𝑃 𝑅 (40) 𝐼 ∙ 𝑃 − 𝑃 𝑅 + 𝑃 − 𝑃 𝑅 = 𝑇 ∙ 𝑃 − 𝑃 𝑅 (41) 𝑇 ∙𝑃 − 𝑃 𝑅 = 𝑇 ∙ 𝑃 − 𝑃 𝑅 (42) 𝑇 ∙𝑃 − 𝑃 𝑅 = 𝐼 ∙ 𝑃 − 𝑃 𝑅 (43) 𝐼 ∙𝑃 − 𝑃 𝑅 = 𝐼 ∙ 𝑃 − 𝑃 𝑅 (44) 𝐼 ∙𝑃 − 𝑃 𝑅 = 𝑇 ∙ 𝑃 − 𝑃 𝑅 (45) 𝑉 − 𝑉 = 𝐶 ∙ ∆𝑃 + 2𝑉 𝜋 ∙ 𝑎𝑟𝑐𝑡𝑎𝑛 𝜋𝐶 2𝑉 ∙ ∆𝑃 ∈ , , ∈ , ,, ,…, ,, , , , , (46)
610
611
612
B. Parameters of the Cardiovascular Model
613
614
(Insert Table 4)
615
616
C. Baseline Steady State Flows and Volume Distributions
617
618
(Insert Table 5)
620
621
ACKNOWLEDEMENTS
622
We thank the subjects who kindly participated in the experimental study conducted at the
623
Massachusetts Institute of Technology.
624
625
GRANTS
626
This project was supported by the MIT/Skolkovo development project (Seed Grant 6925991),
627
and the National Space Biomedical Research Institute through NASA NCC 9-58. In addition, the
628
Fulbright Commission has provided additional support.
629
630
DISCLOSURES
631
No conflicts of interest, financial or otherwise, are declared by the authors.