The role of native woody species on the restoration of campos rupestres in quarries 1
2
Soizig Le Stradic, Elise Buisson, Daniel Negreiros, Pascal Campagne & G. Wilson 3
Fernandes 4
Le Stradic, S. (Corresponding author, soizig.lestradic@gmail.com) Buisson, E. 5
(elise.buisson@univ-avignon.fr) & Campagne, P. (campagne@aesop.rutgers.edu) : UMR 6
CNRS/IRD 7263/237 IMBE - Institut Méditerranéen de Biodiversité et d'Ecologie – 7
Université d’Avignon et des Pays de Vaucluse, IUT, Agroparc, BP 61207, 84 911 Avignon 8
cedex 9, France. 9
Le Stradic, S., Negreiros, D. (negreiros.eco@gmail.com) & Fernandes, G.W. 10
(gw.fernandes@gmail.com) : Ecologia Evolutiva & Biodiversidade/Instituto de Ciências 11
Biológicas, Universidade Federal de Minas Gerais, 30161-970 Belo Horizonte MG, CP 486, 12 Brazil. 13 14 Abstract 15
Questions: Can shrub and tree seedlings be reintroduced in an extremely harsh environment 16
by transplantation? Does the growth strategy of species affect their survival? What factors 17
influence the transplantation success? Do transplanted species influence their immediate 18
vicinity, e.g. promoting colonization by native species? 19
Location: Campos Rupestres, Espinhaço range, Minas Gerais, Brazil. 20
Methods: We studied the reintroduction of four native tree and 14 native shrub species. Their 21
transplantation success (survival, growth, and reproduction) and their impacts on their 22
immediate vicinity (understorey composition, soil surface indicators such as the cover of 23
moss, biological crust, bare ground, litter, herbaceous cover, and soil characteristics) were 24
assessed 4.5 years after transplantation. 25
Results: While some transplanted species had low survival (< 30%), half of them had a 26
survival >78% 4.5 years after transplantation. Plant growth was barely correlated to the 27
transplantation success in such harsh environment. Transplanted species did not influence soil 28
and understorey plant composition but significantly impacted soil surface indicators. The 29
shrub species with higher survival rates usually allowed the establishment of an understorey 30
herbaceous cover which may increase soil erosion control. This is also true for some species 31
for those the survival was <40%: Diplusodon orbicularis (survival: 39%) and Lavoisiera 32
campos-portoana (37%). Crown volume had a direct effect on light reaching the soil (e.g.
33
Jacaranda caroba or Collaea cipoensis had a less dense canopy more permeable to light
34
allowing understorey species). On the other hand, crown volume was positively correlated to 35
the amount of litter: Fabaceae species, such as Chamaecrista semaphora and Mimosa 36
foliolosa, had denser canopy and produced a thick layer of litter, limiting herbaceous species
37
establishment. Three tree species (Enterolobium ellipticum, Kielmeyera petiolari, and 38
Zeyhera tuberculosa) neither had high survival nor did facilitate the establishment of the
39
herbaceous cover. The layout and spacing of species and individuals must thus be considered 40
carefully to insure recolonization by native shrub and herbaceous species. 41
Conclusion: This study demonstrates the practical efficiency of some native species to restore 42
a harsh tropical ecosystem as the campos rupestres in terms of their transplantation success, 43
their effects on both the establishment of herbaceous species and soil conservation. 44
45
Keywords: assessment of restoration success;, Cerrado; herbaceous understorey; neotropical 46
mountain grasslands; Serra do Cipó; transplantation success. 47
Abbreviations: Dret : Dasyphyllum reticulatum ; Jcar : Jacaranda caroba ; Abon: 48
Actinocephalus bongardii; Cfas: Calliandra fasciculata; Csem.: Chamaecrista semaphora,
49
Mfol.: Mimosa foliolosa; Ccip.: Collaea cipoensis; Dhir.: Diplusodon hirsutus; Dorb.: 50
Diplusodon orbicularis; Hbyr.: Heteropterys byrsonimifolia; Lcam.: Lavoisiera
campos-51
portoana; Mtax.: Marcetia taxifolia; Thet.: Tibouchina heteromalla; Lpac.: Lafoensia pacari;
Kpet.: Kielmeyera petiolaris; Eell.: Enterolobium ellipticum; Edys.: Eugenia dysenterica; 53
Ztub.: Zeyhera tuberculosa. 54
Nomenclature: Lista de Espécies da Flora do Brasil 2013 in http://floradobrasil.jbrj.gov.br/ 55
Running head: Campo rupestre restoration 56
57
Introduction 58
Ecological restoration is the process of intentionally assisting the recovery of degraded 59
ecosystems in order to repair ecosystem processes, productivity and services, as well as to re-60
establish the biotic integrity (SER 2004). Grassland restoration projects are often hampered 61
by abiotic constraints, such as increased soil nutrients in case of degradation by intensive 62
agriculture or the alteration of soil chemical and physical characteristics (i.e. limited nutrient 63
availability, low water availability) in case of degradation by quarrying and mining activities 64
(Ash et al. 1994, Jim 2001, Wong 2003, Yuan et al. 2006). Biotic constraints also affect 65
seedling establishment through the lack of reliable seed sources, the limited dispersal of 66
appropriate propagules or the presence of competitive exotic species (Ash et al. 1994, 67
Bradshaw 1997, Bakker & Berendse 1999, Wilson 2002, Shu et al. 2005). 68
Open ecosystems, such as grasslands or savannas, represent more than 31% of world 69
vegetation, but they have drastically decreased or have been highly altered throughout the 70
world over the last decades (Gibson 2009), due to intensification of agricultural practices 71
(Green 1990, Klink & Moreira 2002), land abandonment, invasive species, civil engineering 72
and changes in disturbance regimes (Hoekstra et al. 2005, Gibson 2009). These ecosystems 73
are important not only from the perspective of conserving biodiversity (FAO 1998), but also 74
in maintaining ecosystem services, such as increased water quality or decreased soil erosion 75
(Osborne et al. 1993, Berger & Rey 2004, MEA 2005 a, b). Moreover, since the process of 76
natural succession is slow after degradation, especially by quarrying and mining activities 77
(Bradshaw 1983, Davis et al. 1985, Bradshaw 1997), their restoration is often attempted. 78
The Cerrado is the richest tropical savanna in the world, representing the second 79
largest vegetation formation of Brazil originally covering c.a. 2.2 million km2 or 23% of the 80
country (Oliveira & Marquis 2002) and due to anthropogenic pressures (e.g. intensive 81
agriculture, mining, quarrying) is currently one of the most endangered biomes in South 82
America (Klink & Machado 2005, Hoekstra et al. 2005). This has led to biodiversity losses, 83
landscape fragmentation, biological invasions (Pivello et al. 1999), soil erosion, water 84
pollution and land degradation (Klink & Moreira 2002). Campos rupestres are one of the 85
physiognomies of the Cerrado biome, and are usually found above 900 meters high in 86
altitude. They are composed of a more or less continuous herbaceous stratum with 87
sclerophyllous evergreen shrubs and small trees growing between rocky outcrops, supporting 88
a high biodiversity with one of the highest levels of endemism in Brazil (Giulietti et al. 1997, 89
Carvalho et al. 2012). Such ecosystem is under extreme environmental conditions; their soils 90
are coarse textured and shallow, with high Al3+ and low nutrient content (Benites et al. 2007). 91
Few studies have been carried on such physiognomies of the Cerrado and they remain poorly 92
documented while restoration ecology studies are urgently needed. 93
According to the level of degradation, restoration of quarries and mines may require 94
seed addition (Cooper & MacDonald 2000, Turner et al. 2006, Kirmer et al. 2012, Ballesteros 95
et al. 2012), native species transplants (Ash et al. 1994, Soliveres et al. 2012), turves or 96
rhizomes transfer (Ash et al 1994, Cooper & MacDonald 2000). Currently in Brazil, many 97
mine and quarry mitigation projects use exotic species for revegetation, such as the African 98
grass Melinis minutiflora (Griffith & Toy 2001), to rapidly reach specific goals, e.g. to reduce 99
soil erosion. Exotic species are one of the major threats to local diversity, particularly when 100
degraded areas are close to roads where propagation and invasion risks are higher (Hansen & 101
Clevenger 2005; Barbosa et al. 2010). 102
Spontaneous regeneration of woody as well herbaceous campo rupestre species does 103
not seem to occur on degraded campos rupestres or is extremely slow (Le Stradic 2012) in 104
contrast with the seasonal deciduous forests (Sampaio et al 2007). Several non-mutually-105
exclusive hypotheses could explain the lack of spontaneous recruits in degraded areas 106
(Bradshaw 2000): i) species produce viable seeds but they do not disperse far enough to reach 107
degraded sites; ii) dispersed seeds arrive to degraded areas but do not germinate due to the 108
high temperature and dryness of the bare and nutrient poor and/or toxic substrate; iii) 109
dispersed seeds are able to germinate but further development of saplings does not take place 110
due to the extreme harshness of the degraded site, the stress caused by natural enemies, or 111
lack of symbiotic interactions with facilitating arbuscular mycorrhizal fungi. The first two 112
reasons and sometimes the third one can be overcome by reintroduction which consists in the 113
re-establishment of taxa in part of their native range from where they had disappeared or had 114
drastically declined (Maunder 1992; Young 2000). Transplantation of native species may thus 115
be a suitable substitute (Maunder 1992; Bradshaw 1997, Byers et al. 2006, Hölzel et al. 2012), 116
ensuring that a desired panel of species are introduced and avoiding limited seedling 117
establishment (Bradshaw 1997). 118
For practical reasons, restoration by reintroduction often involves a single species; 119
restoring full communities is often costly and difficult to implement (Sampaio et al. 2007). 120
Usually species are selected as they are keystone, structuring, dominant or rare species 121
(Maunder 1992; Byers et al. 2006). Recent interest in the outstanding biodiversity of campos 122
rupestres has led to germination studies of some native plants which is a necessary step to
123
perform restoration projects (Gomes et al. 2001, Silveira et al. 2012). Species propagation and 124
their performance under controlled conditions in greenhouses represented the next crucial step 125
for restoration programs (Negreiros et al. 2009). The third step consists in a pilot field study. 126
It is now widely accepted that monitoring should be carefully planned prior, during 127
and after all restoration projects (Holl & Cairns 2002). In order to provide a common basis for 128
the assessment of restoration success, numerous measurements (i.e. ecosystem attributes) 129
were proposed (SER 2004). However, most projects consider one or two measurements 130
among the three major ecosystem attributes: (1) species diversity; (2) vegetation structure; 131
and (3) ecological processes (Ruiz-Jaen & Aide 2005). When restoration projects are based on 132
(single-) native species reintroduction, monitoring and evaluation of success is often restricted 133
to survival and growth of these reintroduced species (Maunder 1992; Guerrant & Pavlik 134
1998). Nevertheless, introduced species can drastically change ecosystem functioning 135
(Simberloff et al. 2005) and monitoring should therefore assess the impact of introduced 136
species on their environment (SER 2004); 1) by measuring reintroduced species survival, 137
growth and recruitment ability and 2) by measuring the impacts of reintroduced species on 138
their direct environment. While short-term monitoring is needed to document the survival and 139
establishment of reintroduced species, mid-term and long-term monitoring is essential to 140
understand induced changes in ecosystem functioning (Maunder 1992; Sutter 1996). 141
In this context, we studied the reintroduction of 18 native campo rupestre tree and 142
shrub species to degraded areas. The questions raised by this study were: (1) can shrub and 143
tree seedlings be reintroduced in an extremely harsh environment by transplantation? ; (2) 144
does the growth strategy of species affect their survival?; (3) what factors influence the 145
transplantation success?; and finally (4) do transplanted species influence their environment, 146
i.e. the herbaceous understorey, the soil properties, and the soil surface indicators in their 147
immediate vicinity? In this experiment, we expected the ideal to-be-transplanted species to be 148
able to survive and to grow on harsh environments and to allow herbaceous species, 149
cryptogams and biological crust to colonize the understorey in order to increase total 150
vegetation cover and thus soil conservation. 151 152 Methods 153 STUDY SITE 154
Campos rupestres are encountered along the Espinhaço mountain range (states of
155
Minas Gerais and Bahia) in Brazil. Our study area is located in the southern portion of the 156
Espinhaço Range. Fieldwork was conducted in the Vellozia Private Reserve (19°16’45.7”S, 157
43°35’27.8”W; elevation 1200 m) in the buffer zone of the Serra do Cipó National Park 158
(Minas Gerais). The climate is classified as Cwb according to the Köppen’s system, which is 159
characterized by warm temperature, dry winter and warm summer. It is markedly seasonal, 160
with a rainy season during summer. The mean annual precipitation is 1622 mm and the annual 161
temperature is 21.2°C (Madeira & Fernandes 1999). 162
A study reported the presence of degraded areas along the highway MG010 in 1996 (Negreiro 163
et al. 2011) which dated back from 1990. They were exploited for gravel and/or were used to 164
park machines. These small quarries are common in the region: vegetation is destroyed and 165
soils are disturbed and when exploitation stops, soils are not returned entirely and 166
construction debris may be added resulting in a high-altered soil. All of these degraded areas 167
are surrounded by pristine campos rupestres, that is why we chose them as the reference 168
ecosystem. Two experimental degraded areas, with a sandy altered substrate, were selected. 169
Sites were located a few tens of meters apart, thus, for both sites, exploitation stop at the exact 170
same time and the mixed soil horizons were put back in the same way in order to have true 171
site replicates. Indeed, sites further apart may have different soil granulometry due to the way 172
that soil horizons are mixed after exploitation. 173
174
EXPERIMENTAL DESIGN 175
Eighteen native species were planted: fourteen shrub species and four tree species 176
(Table 1). In 2002, seeds of all eighteen species were gathered in the field in areas 177
surrounding the degraded areas. Mature fruits were collected from at least ten individuals of 178
each species. For Chamaecrista semaphora, Mimosa foliolosa, Collaea cipoensis and 179
Enterolobium ellipticum, seed dormancy was broken by mechanical scarification (Gomes et
180
al. 2001). In November 2002, seeds were hydrated for 24 hours and each seed was sown in 181
black polythene bags (8cm diameter and 20cm deep) directly in the substrate, composed of 182
1/3 of soil from around the degraded areas, 1/3 of peat and 1/3 of organic compost of confined 183
cattle dung. To correct for soil acidity and nutrients, 2L dolomitic limestone and 1L NPK 184
(4:14:8) were added for 360L of substrate. Seedlings were placed in a greenhouse: 50% light, 185
watering by micro-sprinklers for 15 minutes, three times a day, equivalent to 17.5 mm/day. At 186
the end of April 2003, seedlings were transferred out of the greenhouse and exposed to 187
ambient conditions, while watering by micro-sprinklers was gradually reduced. 188
Between 20 Jul 2003 and 26 Jul 2003, we randomly assigned 64 eight month-old 189
seedlings (except Lavoisiera campos-portoana: 27 months-old) of each species to be 190
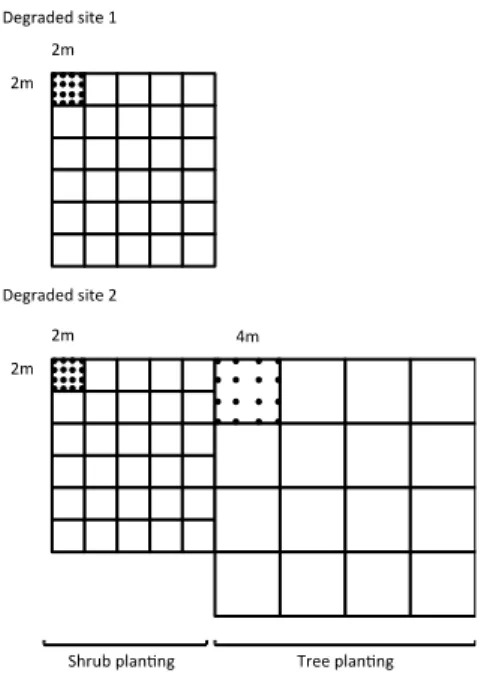
transplanted to the degraded areas. Shrubs were transplantated on both degraded areas; while 191
trees were transplantated on only the largest degraded area. Seedling transplantation was 192
carried out according to the experimental design explained in Figure 1. As planting was 193
carried out during the dry season, plants were irrigated by sprinklers during the first two 194
months. Plants received water for 15 minutes at every other 10 days. 195
196
MONITORING OF THE SURVIVAL AND GROWTH OF PLANTED SPECIES 197
Survival was recorded for each individual in August 2003 (date of transplantation), 198
September 2003, February 2004, April 2006 and February 2008 (4.5 years after 199
transplantation). Some individuals were considered dead one year, but they had to be 200
considered alive after due to resprouting. At each date, growth was evaluated by measuring 201
the height of the main stem, crown volume (calculated using the largest crown diameter, the 202
largest perpendicular diameter to the first one and crown height) and basal diameter of each 203
individual. These variables are known to reflect the growth of both roots and shoot systems 204
(Niklas 1993; Negreiros et al. 2009). Relative Growth Rates (RGRs) were calculated for 205
diameter, height and volume as: RGR= (Ln xtj – Ln xti) / (tj – ti) where x denotes the variable 206
measured at two different dates ti and then tj. Since it is important to assess the sustainability
of a species in a restored area through its reproductive ability, we recorded the occurrence of 208
new sprouts, individuals with flowers or fruits and new seedlings in February 2008. 209
210
UNDERSTOREY AND SOIL SAMPLING 211
In February 2008, on each plot, four 20×20cm quadrats were set randomly to assess 212
soil surface indicators and the composition of species colonizing the understorey (understorey 213
composition and richness). Percent of cover of each understorey species was recorded. 214
Monitored soil surface indicators were: (I) cover of moss (%); (II) biological crusts (thin 215
organic layer formed by cyanobacteria, green algae, lichens, fungus and heterotrophic bacteria 216
(Belnap & Lange 2001)); (III) cover of bare ground (%); (IV) litter cover (%); and (V) 217
herbaceous plant cover (%) (hereafter named herbaceous cover). In order to assess the 218
influence of transplanted species on light reaching the ground, canopy closure (named shade) 219
was estimated based on the vertical projection of the crown area weighted by an index of 220
foliage density (Daubenmire 1959). This index was calculated from the analysis of four 221
canopy pictures for each species using an image processing software which assessed the 222
percentage of the picture with foliage. 223
In order to determine whether species influence soil chemical properties, one soil 224
sample was collected on each plot, resulting from four sub-samples which were mixed and 225
homogenized, dried and sieved prior to chemical analyses. The following chemical analyses 226
were performed: P and K in mg/dm3, N and C in dag/kg, Mg2+, Al3+, Ca2+ in cmolc/dm3, 227
Organic Matter (OM) in dag/kg –P, Na, K with the Mehlich 1 extraction method, Ca2+, Mg2+, 228
Al3+ with 1 mol/L KCl extraction, OM = C.Org x 1.724 following the Walkley-Black 229 method). 230 231 DATA ANALYSIS 232
The effects of the qualitative variables “sites” and “plots” on survival (0 or 1 at the individual 233
level) at the end of the survey were tested using GLM (Generalized Linear Models) with a 234
binomial distribution and a logit link function (Crawley 2007). Then, the effect of the 235
variables “initial size of individuals” (size when transplanting) and “RGR” on individual 236
survival were analyzed with GLM procedures (binomial distribution and logit link function) 237
by setting the “plot” and “site” effects as an offset component of the GLM. An offset specifies 238
an a priori known component to be included in the linear predictor during fitting (using the R 239
package stats) (Crawley 2007). Differences in survival according to the plant family and plant 240
stature levels were tested at the different times of the survey (2004, 2006 and 2008) using χ² 241
tests. 242
Similar treatments being expected to lead to similar effects in both sites, multivariate 243
analyses were performed to assess the co-structure of their variables. Three co-inertia 244
analyses were thus ran between site 1 and 2 considering: (i) soil surface indicators (2 matrices 245
of 30 plots × 6 soil surface indicator), (ii) soil chemistry (2 matrices of 30 plots × 9 soil 246
variables) and understorey composition data (2 matrices of 30 plots x 81 understorey species) 247
separately (Chessel et al. 2009). The significance of the coinertia coefficient was estimated 248
with 999 Monte Carlo permutations. 249
Then, as a co-structure was found only for soil surface indicators, we further explored 250
the effects of transplanted species on these indicators, by running an inter-class Principal 251
Component Analysis (76 transplanted and control plots × 6 soil surface indicators; PCA-252
between; ade4 R package, Chessel et al. 2009). Simple ANOVAs, followed by post-hoc tests 253
(Tukey HSD: Honestly Significant Difference) were performed: herbaceous cover and 254
understorey richness were treated as dependent variables and species and control plots as 255
categorical predictors. Normality and homoscedasticity assumptions were checked and a 256
square root transformation was applied (Sokal & Rohlf 1998). Species morphology especially 257
the crown volume was expected to impact on the amount of light reaching the soil. In order to 258
assess the relationship between crown volume at the end of the survey and soil surface 259
indicators, tests for association between paired samples using Spearman's ρ were carried out. 260
All statistical analyses were performed using the software R (R Development Core Team 261 2009). 262 263 Results 264
SURVIVAL AND GROWTH OF PLANTED SPECIES 265
Differences in terms of survival and growth were observed. Four and a half years after 266
transplantation, some species were characterized by a fairly high survival (above 78%): 267
Calliandra fasciculata, Collaea cipoensis, Jacaranda caroba, Dasyphyllum reticulatum,
268
Heteropterys byrsonimifolia, Tibouchina heteromalla, Eugenia dysenterica, Diplusodon
269
hirsutus and Lafoensia pacari. On the contrary survival was lower than 50% for
270
Actinocephalus bongardii, Chamaecrista semaphora, Diplusodon orbicularis, Enterolobium
271
ellipticum, Lavoisiera campos-portoana and Zeyhera tuberculosa (Table 2). In addition,
272
survival of seven species significantly differed depending on the plot and/or the site: A. 273
bongardii, C. fasciculata, C. semaphora, D. hirsutus, D. orbicularis, J. caroba or Kielmeyera
274
petiolaris. Individuals growing in the site 2 generally presented a higher survival (Table 2).
275
Beyond their simple survival, some species were able to colonize available sites: 276
Chamaecrista semaphora, C. cipoensis, Marcetia taxifolia and M. foliolosa recruited more
277
than 10 seedlings. Others expanded through resprouting, such as the majority of individuals of 278
C. cipoensis, D. reticulata, D. hirsutus, H. byrsonimifolia, L. pacari,and T. heteromalla
279
(Table 2). Finally no signs of reproduction were observed in Z. tuberculosa, E. dysenterica 280
and E. ellipticum (Table 2). 281
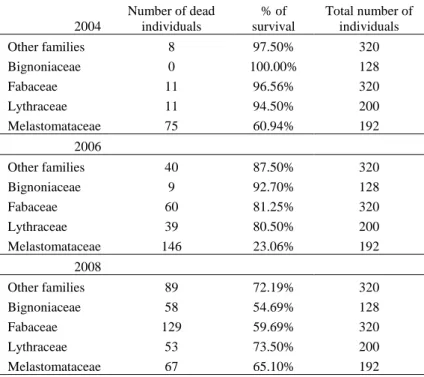
Species appeared to differentially survive according to their families at different dates 282
(respectively χ2=319.8, df=4, P<0.001 in 2006, χ2=21.8, df=4, P<0.001 in 2008). 283
Melastomataceae suffered higher mortality (at least of the aboveground parts) than the other 284
families at the beginning and during the first years, as 39% of their individuals died during the 285
first six months and 76% after 2.5 years, especially L. campo-portoana (Table 2 & Table 3). 286
Melastomataceae species were able to resprout, thus increasing their survival rates 4.5 years 287
after the transplantation (Table 3) compared to the two first years after the transplantation. At 288
the end of the survey, Fabaceae and Bignoniaceae were the families with the highest mortality 289
rate (respectively 59.69% and 54.69% of survival) (Table 3). Shrubs presented higher 290
mortality than trees at the beginning and during the first years of the transplantation 291
(respectively 10% vs. 6% respectively for 2004; χ2=3.7, df=1, P=0.052 and 29% vs.14% 292
respectively for 2006; χ2=21.9, df=1, P<0.001), while at the end of the survey shrubs were 293
characterized by a lower mortality than trees (31% vs. 45% respectively; χ2=15.6, df=1, 294
P<0.001).
295
For most species, the RGR did not appear to significantly reflect the final survival 296
probability. However, when such effects where observed, a faster growth was associated with 297
a higher survival, excepted for C. semaphora (Table 4). Survival 4.5 year after the 298
transplantation was positively related to the initial size of individuals for A. bongardii, D. 299
reticulatum and M. taxifolia and to a lesser extent for E. dysenterica and C. fasciculata (Table
300
4). For only two species, E. ellipticum and M. taxifolia, the survival 6 months after the 301
transplantation was positively related to the RGR during the first month (Table 4). The RGR 302
during the first 6 months was positively linked to the survival 2.5 years after the 303
transplantation (in 2006) for five species: C. fasciculata, D. orbicularis, K. petiolaris, M. 304
taxifolia and M. foliolosa. Finally, for just three species, C. fasciculata, D. reticulatum and Z.
305
tuberculosa, the RGRs during the first years, between 2004 and 2006, were positively
306
correlated with the survival at the end of the survey, 4.5 years after the transplantation, while 307
it was negatively correlated with the survival of one species: C. semaphora (Table 4). 308
309
UNDERSTOREY RECOLONISATION 310
Similar treatments should lead to similar effects; we then expected that the factor 311
“species” lead to some structure between the two sites. However among the three co-312
inertia analyses run between site 1 and 2, a significant co-structure was found only for soil 313
surface indicators (RV=0.390, P<0.05 Monte-Carlo permutations), and not for soil or 314
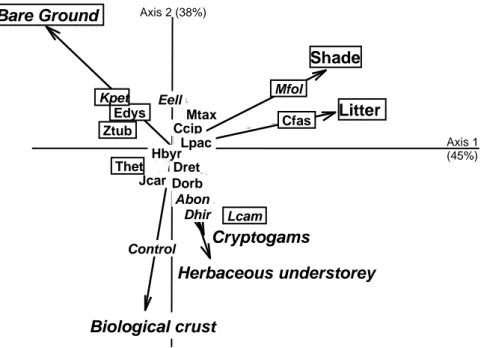
understorey composition data (RV=0.136, P=0.17 and RV=0.595, P=0.34 respectively). A first 315
PCA was carried out and indicated that C. semaphora was highly correlated with percent 316
cover of litter masking other effects (Inertia = 0.42, P<0.001- Monte-Carlo permutations). 317
Another PCA was thus carried out, without C. semaphora (Inertia = 0.35, P <0.01- Monte-318
Carlo permutations), indicating on the axis 1 (45% of the total inertia) that Eugenia 319
dysenterica (8%), Z. tuberculosa (9%) and K. petiolaris (10%) were characterized by bare
320
ground (axis contribution: 23%) while C. fasciculata (29%) M. foliolosa (26%) and L. 321
campos-portoana (9%) were correlated with high cover of litter and shade (axis contribution:
322
38% and 34% respectively) (Fig. 2). Axis 2 (38% of the total inertia) underlined that 323
Actinocephalus bongardii (6%), D. hirsutus (10%), L. campos-portoana (13%) and control
324
plot (27%) were characterized by a dense cover of biological crust (39%) and to a lesser 325
extent by a cover of moss (11%) and herbaceous vegetation (18%) contrary to E. ellipticum 326
(8%) and K. petiolaris (10%) which were distinguished by a higher cover of bare ground 327
(21%). 328
The transplanted species appeared to influence both species richness and the 329
herbaceous cover of the understorey. Calliandra fasciculata, J. caroba, D. reticulatum, D. 330
orbicularis, L.campos-portoana, A. bongardii and control plots had significantly higher
331
understorey richness than that of other species (F=3.33, P<0.001). Moreover the pre-cited 332
species as well as D. hirsutus, C. cipoensis and control plots had significantly higher 333
herbaceous cover than that of other species (F = 2.78, P<0.001). The floristic survey of the 334
herbaceous understorey led to the identification of 69 species, of which the majority were 335
represented by ruderal species which were likely to be dispersed from the road and that did 336
not occur on the surrounding savannas. The most represented family was Poaceae (21 337
species), followed by Fabaceae (15) and Asteraceae (8). Two invasive species were identified: 338
Melinis repens (from Africa; Starr et al. 2006) and Euphorbia hirta (from India, USDA
339
2008). 340
Crown volume, was positively correlated with the cover of litter (Spearman’s ρ=0.65, 341
P<0.01) and, since it influenced the amount of light reaching the soil, with shade (Spearman’s
342
ρ=0.74, P<0.001). Crown volume was negatively correlated with the cover of bare ground
343
(Spearman’s ρ=-0.54, P<0.05). No significant correlations between crown volume and 344
biological crust, moss and herbaceous cover were found. 345
346
Discussion 347
The restoration success typically depends on multiple criteria. In this survey of a 348
transplantation experiment, we considered two crucial aspects: (i) the capacity of transplanted 349
species to settle and reproduce in the degraded area; (ii) the effect of the re-introduced species 350
on their immediate environment which may result in an increased re-colonization of the site 351
by other species. This study represents a landmark in the restoration of this type of tropical 352
mountain savannas. We report one of the first conclusive restoration projects on these highly 353
threatened ecosystems and emphasise that transplantation in degraded sites is a very good 354
way to reintroduce native species and increase plant cover in harsh environments. 355
356
SURVIVAL AND GROWTH OF PLANTED SPECIES 357
Prior to the analysis of the efficiency of transplanted species to modify their 358
environment, the first step in restoration using transplants is to identify species characterized 359
by a high survival. Although some native species transplanted in this study was characterized 360
by a low survival (<50%), half of our species panel showed a high survival (>78%) 4.5 years 361
after transplantation in highly degraded areas. Those species, C. fasciculata, C. cipoensis, J. 362
caroba, D. reticulatum, H. byrsonimifolia, T. heteromalla, E. dysenterica, D. hirsutus and L.
363
pacari, are therefore excellent candidates to restore degraded areas of highland savannas.
364
While native trees presented a low survival compared to the native shrubs, the tree species E. 365
dysenterica was also successfully transplanted (survival > 96%) and could be reintroduced
366
with success, even if its contribution to recruitment would probably occur in the longer term. 367
Beyond survival, planted species, were able to reproduce vegetatively and/or sexually 368
and therefore initiate the self-recolonisation of the degraded sites. This was also true 369
concerning some species presenting low survival and in another hand 1) which are able to 370
recruit numerous seedlings, such as the Fabaceae species: Mimosa foliolosa or Chamaecrista 371
semaphora, or, 2) which are able to resprout like Melastomataceae species. This is
372
particularly interesting since most of the transplanted species do not seem to fastly re-colonize 373
degraded sites. They are not generally found in disturbed areas which have been abandoned 374
for years (Le Stradic 2012), and their seeds are not detected in the seed bank (Medina & 375
Fernandes 2007). 376
In addition, species lifespan should balance any evaluations exclusively based on the 377
survival of transplanted individuals. Actinocephalus bongardii presented the lowest survival 378
of all planted species (< 10%), but this species commonly lives only three to four years 379
(Oriani et al. 2008) and the transplanted individuals survived well during the first two years. 380
Actinocephalus bongardii has bloomed every year and has produced a large number of seeds
381
although few recruitements are currently found. A. bongardii thus participated in degraded 382
area stabilization during the first years. Moreover, dead individuals produced a fine litter 383
which may have played a role in increasing soil organic matter and nutrients and in allowing 384
colonisation by herbaceous species. 385
Plant growth did not appear to be a generic predictor of individual survival. Early 386
survival, reflecting the species ability to establish on degraded sites, was poorly related to 387
early RGR. In the same way, for only five species, i.e. C. fasciculata, D. orbicularis, D. 388
hirsutus, K. petiolaris, M. foliolosa and M. taxifolia, the growth rate partially reflected the
389
ability of an individual to persist in degraded areas. In a majority of the species, survival at 390
the end of the survey was not related to the RGR measured on shoots which might be the 391
result of an investment in root growth. 392
However, if growth is not a critical factor determining the survival in degraded areas, 393
we can expose some hypotheses explaining the low survival of some species. First edaphic 394
conditions on degraded sites are more stressful than on their non-degraded counterparts. 395
Abiotic conditions could limit the early stage of plant establishment (Maestre et al. 2006); 396
maladjustment to the physical and chemical conditions of the degraded sites, critical in the 397
short-term, may lead to a high mortality during the early stage (e.g., as observed for 398
Melastomataceae). Establishment of tree and shrub seedlings in Neotropical savannas is 399
highly constrained by drought, fire and competition with herbaceous species and thus depends 400
on seedling ability to access water (Medina & Silva 1990). 401
In addition, on degraded sites, species distribution is less dense which modify species 402
interactions compared to pristine areas. Fabaceae species bring, for the plant community, the 403
potentially important feature of fixing atmospheric nitrogen. Unfortunately, two tested 404
Fabaceae (M. foliolosa and C. semaphora) recorded high late mortality, possibly due to the 405
effects of intra-specific competition occurring at the relatively small experimental plot scale. 406
In a different way, Enterolobium ellipticum recorded a high mortality rate during the last year 407
due to the parasitism of all individuals by Struthanthus flexicaulis Mart. (Loranthaceae). 408
409
COMMUNITY RESTORATION 410
Candidate species for future restoration projects can be listed on the basis of survival 411
but the next step must be to assess the efficiency of transplanted species to modify their 412
environment (i.e. nurse species, Padilla & Pugnaire 2006). Our work shows that transplanted 413
species, even if they did not significantly influence soil properties and understorey plant 414
composition, affected significantly their immediate vicinity modifying soil surface indicators, 415
potentially increasing the establishment of recruits or future colonization by other species. A 416
large fraction of our species (i.e. C. fasciculata, C. cipoensis, J. caroba, D. reticulatum, D. 417
orbicularis, D. hirsutus L. campos-portoana and A. bongardii) allowed the establishment of
418
an herbaceous strata participating to the soil stabilisation. We, however, did not find a 419
potential nurse effect of our species, as an equal herbaceous cover was also present on control 420
plots. In addition, large part of the new herbaceous cover is composed by ruderal species, 421
which were not encountered on pristine highland savannas, underlining the real limitation of 422
savanna species to immigrate on degraded areas. 423
Colonization of the understorey by herbaceous species is partly influenced by the 424
amount of light reaching the ground and therefore by the canopy density and morphology of 425
transplanted shrubs and trees. Jacaranda caroba and C. cipoensis have a canopy which is 426
more permeable to light. They thus favour colonisation by herbaceous species, by contrast 427
with C. semaphora. Canopy opening influences regeneration of herbaceous understorey under 428
tree and shrub cover (Cusack & Montagnini 2004; Hobbs & Mooney 1986), especially since 429
savannah species are not shade tolerant (Hoffmann & Franco 2003). 430
Denser plant cover should increase soil stability (Snelder & Bryan 1995) but according 431
to Rey (2003) vegetation cover of 30% is already effective to control erosion and to trap 432
sediments. Marcetia taxifolia, characterized by an average cover of the herbaceous 433
understorey (23.8% ± 7.3), has significant cryptogam cover (30% ± 9.5) which also 434
participates in erosion control. The ground does not necessarily have to be covered with 435
shrubs; if their establishment is promoted, biological crusts and cryptogams can also play a 436
major role in erosion control (Belnap & Lange 2001). 437
On the contrary, we highlighted that some species can limit re-colonisation by 438
understorey species. For example, in this study, we showed that Fabaceae species (i.e. C. 439
semaphora, M. foliolosa, C. fasciculate) were characterized by a high production of a thick
litter. Leaves of plants of the genus Chamaecrista are rich in secondary compounds such as 441
tannins (e.g. Madeira et al. 1998); tannin-rich litter decomposes very slowly and it has been 442
shown that grasses may be sensitive to tannins released during leaf decomposition (Facelli 443
1991). This litter thus induced a strong inter-specific competition not favourable to 444
colonisation by herbaceous understorey. In addition species of the genus Mimosa are often 445
competitive (Braithwaite et al. 1989; IUCN 2002) due to their architecture, dense foliage and 446
the shade they create. 447
A bad planting protocol can thus also lead to some re-colonization limitation, beyond a 448
higher mortality by intra-specific competition, as we have just mentioned with the example of 449
Fabaceae which should be planted far apart from one another due to their plant architecture 450
and physiology. Therefore, when designing planting protocols, intra- and inter-specific 451
competition and the effects of shade and litter have to be taken into account. To increase bare 452
ground colonization by herbaceous species, plantation should be spaced out, as previously 453
stated, and various types of plant architecture must be combined. 454
455
Conclusion 456
This work shows that the reintroduction of native species into a harsh environment is possible 457
using seedling transplantation. Species, such as C. fasciculata, C. cipoensis, J. caroba, D. 458
reticulatum and D. hirsutus, are excellent candidate to restoration project since they were able
459
to settle and reproduce in the degraded area and they allowed the re-colonization of the site by 460
understorey species. Our work emphasise that plant growth did not seem a good criterion to 461
determine the transplantation success in such harsh environment. Intra-specific competition, 462
leading to higher mortality, was observed especially for Fabaceae species. Therefore, a 463
particular attention should be taken when planning restoration. A suitable planting design, 464
including space between competitive species, is necessary to avoid mortality due to 465
competition and to allow recolonisation. 466
Botanical and ecological knowledge of these ecosystems is still poor and needs to be 467
improved in order to provide a better basis for selection of species to be transplanted. 468
Monitoring is important to measure herbaceous understorey colonization (herbaceous, moss 469
or biological crust cover and richness of herbaceous understorey) and to assess the efficiency 470
of recruitment of transplanted species. Long-term monitoring is necessary; the influence of 471
transplanted species on soil properties and understorey plant composition might occur on a 472 longer time. 473 474 Acknowledgements 475
We are grateful to A.M.O. Paiva, M.N.A. Pereira and M.B.L. Moraes for their field 476
and laboratory support and to two anonymous referees for their valuables comments. We also 477
thank CNPq (558250/2009-2, 563304/2009-3, 303352/2010-8, 561883/2010-6), FAPEMIG 478
(EDT-465/07, APQ-04105-10) and the Conseil Général du Morbihan for financial support. 479
480
Bibliography 481
Ash, H.J., Gremmell, R.P. & Bradshaw, A.D. 1994. The introduction of native plant species 482
on industrial waste heaps : a test of immigration and other factors affecting succession 483
primary. Journal of Applied Ecology 31: 74-84. 484
Bakker, J.P. & Berendse, F. 1999. Constraints in the restoration of ecological diversity in 485
grassland and heathland communities. Tree 14: 63-68. 486
Ballesteros, M., Cañadas, E.M., Foronda,A., Fernández-Ondoño, E., Peñas, P. & Lorite, J. 487
2012. Vegetation recovery of gypsum quarries: short-term sowing response to different 488
soil treatments. Applied Vegetation Science 15: 187–197. 489
Barbosa, N.P.U., Fernandes, G.W., Carneiro, M.A.A & Júnior, L.A.C. 2010. Distribution of 490
non-native invasive species and soil properties in proximity to paved roads and unpaved 491
roads in a quartzitic mountainous grassland of southeastern Brazil (rupestrian fields). 492
Biological Invasions 12: 3745-3755.
493
Belnap, J. & Lange, O.L. 2001. Biological soil crusts: structure, function and management. 494
Springer-Verlag, Berlin. 495
Benites, V.M., Schaefer, C.E.G.R., Sima, F.N.B & Santos, H.G. 2007. Soils associated with 496
rock outcrops in the Brazilian mountain ranges Mantiqueira and Espinhaço. Revista 497
Brasileira de Botânica 30: 569-577.
498
Berger, F. & Rey, F. 2004. Mountain protection forests against natural hazards and risks: new 499
French developments by integrating forests in risk zoning. Natural Hazards 33: 395– 500
404. 501
Bradshaw, A D. 1983. The Reconstruction of Ecosystems : Presidential Address to the British 502
Ecological. Journal of Applied Ecology 20, no. 1: 1-17. 503
Bradshaw, A.D. 1997. Restoration of mined lands - using natural processes. Ecological 504
Engineering 8: 255-269.
505
Bradshaw, A.D. 2000. The use of natural processes in reclamation — advantages and 506
difficulties. Landscape and Urban Planning 51: 89-100. 507
Braithwaite, R.W., Lonsdaleb, W.M. & Estbergs, J.A. 1989. Alien vegetation and native biota 508
in tropical Australia: the impact of Mimosa pigra. Biological Conservation 48: 189-210. 509
Byers, J.E., Cuddingtonn, K., Jones, C.G., Talley, T.S., Hastings, A., Lambrinos, J.G., 510
Crooks, J.A. & Wilson, W.G. 2006. Using ecosystem engineers to restore ecological 511
systems. Trends in Ecology and Evolution 21: 493-500. 512
Carvalho, F., De Souza, A.F., Carrenho, R., Moreira, F.M.S., Jesus, E.C. & Fernandes, G.W. 513
2012. The mosaic of habitats in the high-altitude Brazilian rupestrian fields is a hotspot 514
for arbuscular mycorrhizal fungi. Applied Soil Ecology 52: 9-19. 515
Chessel, D., Dufour, A.B. & Dray, S. 2009. Analysis of Ecological Data : Exploratory and 516
Euclidean methods in Environmental sciences, http://pbil.univ-lyon1.fr/ADE-4. 517
Cooper, D.L. & MacDonald, L.H. 2000. Restoring the Vegetation of Mined Peatlands in the 518
Southern Rocky Mountains of Colorado, U.S.A. Restoration Ecology 8: 103-111. 519
Crawley, M.J. 2007. The R Book. John Wiley & Sons Ltd, Chichester. 520
Cusack, D. & Montagnini, F. 2004. The role of native species plantations in recovery of 521
understorey woody diversity in degraded pasturelands of Costa Rica. Forest Ecology 522
and Management 188: 1-15.
523
Daubenmire, R.A. 1959. Canopy-coverage method of vegetational analysis. Northwest 524
Science 33: 43-64.
525
Davis, B.N.K., Lakhani, K.H., Brown, M.C. & Park, D.G. 1985. Early seral communities in a 526
limestone quarry : an experimental study of treatment effects on cover and richness of 527
vegetation. Journal of Applied Ecology 22: 473-490. 528
Facelli, J.M. 1991. Plant litter: its dynamics and effects on plant community structure. The 529
Botanical review 57: 1-32.
530
FAO. 1998. Unasylva - Moving mountains. Food and Agriculture Organization of the United 531
Nations, eds S.A. Dembner, Rome, Italy. 532
Gibson, D.J. 2009. Grasses and grassland ecology. Oxford University Press. UK. 533
Giulietti, A.M., Pirani, J.R. & Harley, R.M. 1997. Espinhaço range region: eastern Brazil. In: 534
V.H.H.S.D. Davis, Herrera-MacBryde, O., Villa-Lobos J. & Hamilton A.C. (eds) 535
Centre of plants diversity: a guide and strategy for their conservation, pp. 397-404.
536
WWF / WVU, Cambridge. 537
Gomes, V., Madeira, J.A., Fernandes, G.W. & Lemos Filho, J.P. 2001. Seed dormancy and 538
germination of sympatric species of Chamaecrista (Leguminosae) in a rupestrian field. 539
International Journal of Ecology and Environmental Sciences 27 : 191-197.
540
Green, B.H. 1990. Agricultural intensification and the loss of habitat, species and amenity in 541
British grasslands: a review of historical change and asseement os future prospects. 542
Grass and Forage science 45:365-372.
Griffith, J.J. & Toy, T.J. 2001. Evolution dans la remise en végétation des mines de fer dans 544
l'Etat du Minas Gerais, au Brésil. Unasylva 207 52: 9-16. 545
Guerrant, E.O. & Pavlik, B.M. 1998. Reintroduction of rare plants: genetics, demography, 546
and the role of ex situ conservation methods. In P.M.K. Peggy Lee Fiedler (eds) 547
Conservation Biology: For the Coming Decade, pp. 80-108. Springer.
548
Hansen, M.J. & Clevenger, A.P. 2005. The influence of disturbance and habitat on the 549
presence of non-native and plant species along transportation corridors. Biological 550
Conservation 123: 249–259.
551
Hobbs, R.J. & Mooney, H.A. 1986. Community changes following shrub invasion of 552
grassland. Oecologia 70: 508-513. 553
Hoekstra, J.M., Boucher, T.M., Ricketts, T. H. & Roberts, C. 2005. Confronting a biome 554
crisis: global disparities of habitat loss and protection. Ecology Letters 8:23–29. 555
Hoffmann, W.A. & Franco, A.C. 2003. Comparative growth analysis of tropical forest and 556
savanna woody plants using phylogenetically independent contrasts. Journal of Ecology 557
91: 475-484. 558
Holl, K.D. & Cairns, J. Jr. 2002. Monitoring and appraisal. In: Perrow, M.R. & Davy, A.J. 559
(eds) Handbook of Ecological Restoration, pp 411–432. Cambridge University Press, 560
United Kingdom. 561
Hölzel N., Buisson, E. & Dutoit, T. 2012. Editorial: “Species introduction – a major topic in 562
vegetation restoration”. Applied Vegetation science 15: 161–165 563
IUCN Species Survival Commission 2002. Turning the tide: the eradication of invasive 564
species (Proceedings of the International Conference on Eradication of Island
565
Invasives), ed C.R. Veitch & M.N. Clout, Switzerland.
566
Jim, C.Y. 2001. Ecological and Landscape Rehabilitation of a Quarry Site in Hong Kong. 567
Restoration Ecology 9: 85-94.
Kirmer, A., Baasch, A. & Tischew, S. 2012. Sowing of low and high diversity seed mixtures 569
in ecological restoration of surface mined-land. Applied Vegetation Science 15: 198– 570
207. 571
Klink, C.A. & Machado, R.B. 2005. Conservation of the Brazilian cerrado. Conservation 572
Biology 19: 707–713.
573
Klink, C.A. & Moreira, A.G. 2002. Past and Current Human Occupation, and Land Use. In: 574
Oliveira, P.S. & Marquis, R.J. (eds) The Cerrados of Brazil - Ecology and natural 575
history of a neotropical savanna, pp 69-88. Columbia University Press, NewYork.
576
Lista de Espécies da Flora do Brasil. 2013. http://floradobrasil.jbrj.gov.br/ 577
Le Stradic, S. 2012. Composition, phenology and restoration of campo rupestre mountain 578
grasslands – Brazil. Ph.D. Thesis, Université d’Avignon et des Pays de Vaucluse,
579
Avignon, FR & Universidade Federal de Minas Gerais, Belo Horizonte, BR. 580
Madeira, J.A. & Fernandes, G.W. 1999. Reproductive phenology of sympatric taxa of 581
Chamaecrista (Leguminosae) in Serra do Cipo, Brazil. Journal of Tropical Ecology 15: 582
463-479. 583
Madeira, J.A., Ribeiro, K.T. & Fernandes, G.W. 1998. Herbivory, tannins and sclerophylly in 584
Chamaecrista linearifolia (Fabaceae) along an altitudinal gradient. Brazilian Journal of 585
Ecology 2: 1-10.
586
Maestre, F.T., Cortina, J. & Vallejo, R. 2006. Are ecosystem composition, structure, and 587
functional status related to restoration success? A test from semiarid Mediterranean 588
steppes. Restoration Ecology 14: 258–266. 589
Maunder, M. 1992. Plant reintroduction: an overview. Biodiversity and Conservation 1: 51-590
61. 591
MEA Millenium Ecoystem Assessment 2005 a. Dryland Systems In: Hassan, R., Scholes, R. 592
& Ash., N. (eds) Ecosystems and human well-being : current state and trends, pp. 623-593
662. Island Press, Washington, US. 594
MEA Millenium Ecoystem Assessment 2005 b. Mountain Systems In: Hassan, R., Scholes, R. 595
& Ash., N. (eds) Ecosystems and human well-being : current state and trends, pp. 681-596
716. Island Press, Washington, US. 597
Medina, B.M.O. & Fernandes, G.W. 2007. The potential of natural regeneration of rocky 598
outcrop vegetation on rupestrian field soils in "Serra do Cipo", Brazil. Revista 599
Brasileira de Botânica 30: 665-678.
600
Medina, E. & Silva, J.F. 1990. The savanna of northern South-America: A steady state 601
regulated by water-fire interactions on a background of low-nutrient availability. 602
Journal of Biogeography 17: 1-11.
603
Negreiros, D., Fernandes, G.W., Silveira, F.A.O. & Chalub, C. 2009. Seedling growth and 604
biomass allocation of endemic and threatened shrubs of rupestrian fields. Acta 605
Oecologica 35: 301–310.
606
Negreiros, D., Fernandes G.W., Berbara, R.L.L., Rodarte, L.H. & Barbosa, N.P.U. 2011. 607
Caracterização fisico-quimica de solos quartziticos degradados e areas adjacentes de 608
campo rupetsre na Serra do Cipo, MG, Brasil. Neotropical Biology and Conservation 6: 609
156-161. 610
Niklas, K.J. 1993. The allometry of plant reproductive biomass and stem diameter. American 611
Journal of Botany 80: 461-467.
612
Oliveira, P.S. & Marquis, R.J. 2002. The cerrados of brazil: ecology and natural history of a 613
neotropical savanna. Columbia University Press, New York.
614
Oriani, A., Scatena, V.L. & Sano, P.T. 2008. Morphological architecture of Actinocephalus 615
(Koern.) Sano (Eriocaulaceae-Poales). Flora 203: 341-349. 616
Osborne, L.L. & Kovacic D.A. 1993 Riparian vegetated buffer strips in water-quality 617
restoration and stream management, Freshwater Biology 29: 243-258. 618
Padilla, F.M. & Pugnaire, F.I. 2006. The role of nurse plants in the restoration of degraded 619
environments. Frontiers Ecology Environment 4: 196-202. 620
Pivello, V.R., Shida, C.N. & Meirelles, S.T. 1999. Alien grasses in Brazilian savannas: a 621
threat to the biodiversity. Biodiversity and Conservation 8: 1281-1294. 622
R Development Core Team 2009. R: A language and environment for statistical computing. R 623
Foundation for Statistical Computing, Vienna, Austria. 624
Rey, F. 2003. Influence of vegetation distribution on sediment yield in forested marly gullies. 625
Catena 50: 549- 562.
626
Ruiz-Jaen, M.C. & Aide, T.M. 2005. Restoration success: how is it being measured? 627
Restoration Ecology 13: 569-577.
628
Sampaio, A.B., Holl, K.D. & Scariot, A. 2007. Does Restoration Enhance Regeneration of 629
Seasonal Deciduous Forests in Pastures in Central Brazil? Restoration Ecology 15: 462– 630
471. 631
SER 2004. The SER international Primer on Ecological Restoration. Society for Ecological 632
Restoration International Science & Policy Working Group. 633
http://www.ser.org./content/ecological_restoration_primer.asp.
634
Shu, W.S., Ye, Z.H., Zhang, Z.Q., Lan, C.Y. & Wong, M.H. 2005. Natural Colonization of 635
Plants on Five Lead/Zinc Mine Tailings in Southern China. Restoration Ecology 13, no. 636
1: 49-60. 637
Silveira, F.A.O., Ribeiro, R.C., Oliveira, D.M.T., Fernandes, G.W. & Lemos-Filho, J.P. 2012. 638
Evolution of physiological dormancy multiple times in Melastomataceae from 639
Neotropical montane vegetation. Seed Sciences Research 22: 37-44. 640
Simberloff, D., Parker, I.M. & Windle, P.N. 2005. Introduced species policy, management, 641
and future research needs. Frontiers in Ecology and the Environment 3: 12–20. 642
Snelder, D.J. & Bryan, R.B. 1995. The use of rainfall simulation tests to assess the influence 643
of vegetation density on soil loss on degraded rangelands in the Baringo District, 644
Kenya. Catena 25: 105-116. 645
Sokal, R.R. & Rohlf, F.J. 1998. Biometry: the principles and practice of statistics in 646
biological research. New York.
647
Soliveres, S., Monerris, J. & Cortina, J. 2012. Irrigation, organic fertilization, and species 648
successional stage modulate the response of woody seedlings to herbaceous competition 649
in a semi-arid quarry restoration. Applied Vegetation Science 15: 175–186. 650
Starr, F., Starr, K. & Loope, L.L. 2006. New plant records for the Hawaiian archipelago. 651
Bishop Museum Occasional Papers 87: 31–43.
652
Sutter, R.D. 1996 Monitoring. In: Falk, D., Millar, C. & Olwell, M. (eds) Restoring diversity: 653
strategies for reintroduction of endangered plants, pp. 235-264. Island Press,
654
Washington, D.C. 655
Turner, S.R., Pearce, B., Rokich, D.P., Dunn, R.R., Merritt, D.J., Majer, J.D. & Dixon, K.W. 656
2006. Influence of Polymer Seed Coatings, Soil Raking , and Time of Sowing on 657
Seedling Performance in Post-Mining Restoration. Restoration Ecology 14: 267-277. 658
USDA (United States Department of Agriculture) 2009. The PLANTS Database. USDA, 659
Natural resources conservation services, national plant data center, Baton rouge,
660
Louisiana. URL: http://plants.usda.gov. 661
Wilson, S. D. 2002. Prairies. Chapter 19. In Perrow, M.R. & Davy, A.J. (eds). Handbook of 662
ecological restoration. Volume 2. Restoration in practice. pp. 443–465. Cambridge
663
University Press, New York, US. 664
Wong, M.H. 2003. Ecological restoration of mine degraded soils , with emphasis on metal 665
contaminated soils. Ecological Restoration 50: 775-780. 666
Young, T.P. 2000. Restoration ecology and conservation biology. Biological Conservation 667
92: 73-83. 668
Yuan, J., Fang, W., Fan, L., Chen, Y., Wang, D. & Yang, Z. 2006. Soil Formation and 669
Vegetation Establishment on the Cliff Face of Abandoned Quarries in the Early Stages 670
of Natural Colonization. Restoration Ecology 14: 349-356. 671
Table 1: List of transplanted species. Abbrev: abbreviations used in tables and figure. Stature: is the stature of 672
the plant in the study. Actinocephalus bongardii is an herb but was considered as a shrub due to its stature
673
674 Species Abbrev. Family Stature
Dasyphyllum reticulatum (DC.)
Cabrera Dret Asteraceae Shrub
Jacaranda caroba (Vell) A. DC. Jcar Bignoniaceae Shrub Actinocephalus bongardii A. St.-Hil
Sano Abon Eriocaulaceae Shrub
Calliandra fasciculata Benth. var.
bracteosa (Bentham) Barneby Cfas Fabaceae Shrub
Chamaecrista semaphora HS. Irwin &
Barneby Csem Fabaceae Shrub
Mimosa foliolosa Benth. ssp. pachycarpa (Bentham) Barneby var. pachycarpa
Mfol Fabaceae Shrub
Collaea cipoensis Fortunato Ccip Fabaceae Shrub
Diplusodon hirsutus (Cham &
Schlecht) DC Dhir Lythraceae Shrub
Diplusodon orbicularis Koehne Dorb Lythraceae Shrub
Heteropterys byrsonimifolia A. Juss Hbyr Malpighiaceae Shrub Lavoisiera campos-portoana Mell.
Barr Lcam Melastomataceae Shrub
Marcetia taxifolia A. St.-Hil DC Mtax Melastomataceae Shrub Tibouchina heteromalla (D. Don)
Cogn. Thet Melastomataceae Shrub
Lafoensia pacari A. St.-Hil Lpac Lythraceae Shrub
Kielmeyera petiolaris Mart. Kpet Clusiaceae Tree
Enterolobium ellipticum Benth. Eell Fabaceae Tree
Eugenia dysenterica DC. Edys Myrtaceae Tree
Table 2: Overall and site-specific survival (%) in February 2008. Reproduction was recorded as the percentage 675
of individuals with flowers and/or fruits, the number of seedlings recruiting and the percentage of individuals
676
using vegetative reproduction. For species abbreviations, see Table 1. Site and plot effects were assessed using
677
GLM procedures. / : no data, empty cell: non-significant, *: P < 0.05, **: P <0.01, ***: P < 0.001 (2 plots in
678
each site with 16 plants in each plot)
679 Survival 2008 (%) Individuals with flowers or/and fruits (%) Number of seedlings recruiting for 64 transplanted plants Individuals using vegetative reproduction (%) Species Overall (Site 1 - Site 2)
Site effect Plot effect Lafoensia pacari 100 (100.0 - 100.0) 0 0 100 Eugenia dysenterica 96.9 / 0 0 0 Heteropterys byrsonimifolia 96.9 (100.0 - 93.8) 0 0 96.9 Tibouchina heteromalla 96.9 (96.9 - 96.9) 32.8 1 95.3 Dasyphyllum reticulatum 89.1 (87.5 - 90.6) 39.1 1 89.1 Collaea cipoensis 82.8 (90.6 - 75.0) 46.9 10 82.8 Calliandra fasciculata 81.3 (65.6 - 96.9) *** ** 40.6 3 0 Jacaranda caroba 81.3 (84.4 - 78.1) ** 0 1 0 Diplusodon hirsutus 78.1 (62.5 - 93.8) ** *** 34.4 0 78.1 Kielmeyera petiolaris 67.2 / ** 6.3 0 0 Marcetia taxifolia 60.9 (56.3 - 65.6) 53.1 15 0 Mimosa foliolosa 59.4 (65.6 - 53.1) 40.6 11 0 Chamaecrista semaphora 46.9 (28.1 - 65.6) ** * 46.9 15 0 Diplusodon orbicularis 39.1 (25.0 - 53.1) * * 12.5 2 0 Lavoisiera campos-portoana 37.5 (28.1 - 46.9) 29.7 0 37.5 Enterolobium ellipticum 28.1 / 0 0 0 Zeyhera tuberculosa 28.1 / 0 0 0 Actinocephalus bongardii 10.9 (18.8 - 3.1) * * 9.4 1 0 680 681
Table 3: Number and percentage of dead individuals in 2004, 2006 and 2008 according to their families. 682
Resprouting individuals were taken into account, which increased survival rate for some families (e.g.
683 Melastomataceae species) 684 2004 Number of dead individuals % of survival Total number of individuals Other families 8 97.50% 320 Bignoniaceae 0 100.00% 128 Fabaceae 11 96.56% 320 Lythraceae 11 94.50% 200 Melastomataceae 75 60.94% 192 2006 Other families 40 87.50% 320 Bignoniaceae 9 92.70% 128 Fabaceae 60 81.25% 320 Lythraceae 39 80.50% 200 Melastomataceae 146 23.06% 192 2008 Other families 89 72.19% 320 Bignoniaceae 58 54.69% 128 Fabaceae 129 59.69% 320 Lythraceae 53 73.50% 200 Melastomataceae 67 65.10% 192
Table 4: Effects of the early RGR (between August 2003 and September 2003), the mid-term RGR (between September 2003 and February 2004) and the late RGR (between 685
February 2004 and April 2006) on respectively the survival in 2004, 2006 and 2008, using GLM procedures. Effects of the initial plant size (diameter, height and volume in 2003) on
686
the survival in 2008 using GLM procedures. / : no data, empty cell: non-significant, +: significant positive GLM coefficient value with P < 0.05, ++: with P < 0.01, +++: with P <
687
0.05, - -: significant negative GLM coefficient value with P < 0.01, - - -: with P < 0.001
688 Effect of early RGR on survival in 2004 (transplantation + 6 months) Effect of mid RGR on survival in 2006 (transplantation + 2.5 years) Effect of late RGR on survival in 2008 (transplantation + 4.5years)
Effect of initial plant size on survival in 2008
Species Diameter Height Volume Diameter Height Volume Diameter Height Volume Diameter Height Volume
Abon + + Cfas + + ++ +++ + Csem - - - Ccip Dret ++ +++ ++ + + Dhir + Dorb ++ ++ +++ Eell + Edys + Hbyr Jcar Kpet + ++ Lpac Lcam / / / / / / Mtax +++ ++ ++ + + Mfol +++ +++ +++ Thet / / / Ztub +++ + 689 690
691
Figure 1: sketch of the experimental design: two sites were assigned to shrub transplantation. In each site, 30 4-692
m² plots were defined and two plots were randomly assigned to each shrub species (14 species x 2 plots); only
693
two 4-m2 plots remained unplanted as controls for the study of species influence on soil surface indicators.
694
Because of the small size of both sites, we could not place 28 control plots with nothing planted on them, as it
695
would be an ideal scenario. One site was assigned to tree transplantation, sixteen 16-m² plots were assigned for
696
tree species plantation (4 species x 4 plots). In each plot, 16 individuals of one species were transplanted 1m
697
apart for tree species and 0.5m apart for shrub species.
698 699
Bare Ground Abon Cfas Ccip Control Dret Dhir Dorb Eell Edys Hbyr Jcar Kpet Lpac Lcam Mtax Mfol Thet Ztub Axis 1 (45%) Axis 2 (38%) Shade Cryptogams Herbaceous understorey Biological crust Litter 700
Figure 2: Inter-class PCA carried out on various soil surface indicators and shade, projection of two first 701
principal components [72 points × 6 variables]. Variables and species contributing to axis 1 are framed and to
702
axis 2 are in italics. Monte-Carlo permutations: inertia = 0.35, P < 0.01. Chamaecrista semaphora was not
703
included in the analysis. Abbreviations refer to Table 1.
704 705 706