HAL Id: hal-02335593
https://hal.archives-ouvertes.fr/hal-02335593
Submitted on 18 Jan 2021HAL is a multi-disciplinary open access archive for the deposit and dissemination of sci-entific research documents, whether they are pub-lished or not. The documents may come from teaching and research institutions in France or abroad, or from public or private research centers.
L’archive ouverte pluridisciplinaire HAL, est destinée au dépôt et à la diffusion de documents scientifiques de niveau recherche, publiés ou non, émanant des établissements d’enseignement et de recherche français ou étrangers, des laboratoires publics ou privés.
Unraveling Direct Formation of Hierarchical Zeolite
Beta by Dynamic Light Scattering, Small Angle X-ray
Scattering, and Liquid and Solid-State NMR: Insights at
the Supramolecular Level
Maria Castro, Pit Losch, Woojin Park, Mohamed Haouas, Francis Taulelle,
Claudia Loerbroks, Gert Brabants, Eric Breynaert, Christine Kirschhock,
Ryong Ryoo, et al.
To cite this version:
Maria Castro, Pit Losch, Woojin Park, Mohamed Haouas, Francis Taulelle, et al.. Unraveling Direct Formation of Hierarchical Zeolite Beta by Dynamic Light Scattering, Small Angle X-ray Scattering, and Liquid and Solid-State NMR: Insights at the Supramolecular Level. Chemistry of Materials, American Chemical Society, 2018, 30 (8), pp.2676-2686. �10.1021/acs.chemmater.8b00109�. �hal-02335593�
Unraveling direct formation of hierarchical zeolite Beta by DLS, SAXS, liquid and solid
state NMR: Insights at the supramolecular level
M. Castro 1, P. Losch 1*,W. Park 2, M. Haouas 3, F. Taulelle 3, C. Loerbroks 1, E. Breynaert 4,
G. Brabants 4, C. E. A. Kirschhock 4, R. Ryoo 2, W. Schmidt1*
1Max-Planck-Institut für Kohlenforschung, Germany 2CNCR, Institute for Basic Science, Republic of Korea
3 Institut Lavoisier de Versailles, UVSQ, CNRS, Université Paris-Saclay, Versailles, France 4Center for Surface Chemistry and Catalysis, KU Leuven, Belgium
Abstract
A case study on the understanding of the formation of hierarchical Beta zeolites using gemini-type piperidine based multi-ammonium surfactant (N6-diphe) is reported. Complementary techniques were
used to investigate N6-diphe's structure directing effect at the molecular level. The herein developed
toolbox applicable to clear solutions and dense gels, combined with a characterization of the resulting zeolite materials disclosed a series of self-assembly processes that govern the growth (and growth inhibition) of nano-Beta zeolite crystals, which assemble in micron-sized aggregates. In clear solution, small angle X-ray scattering and liquid state NMR provide insights about the formation of nanoparticles and their degree of order. 14N and 1H-DOSY NMR probe the dynamics and mobility of soluble species. In a dense gel, on the other side, 27Al- and 29Si-(MAS)-NMR elucidate the varying local connectivity between initial nano-objects and the final solid products. It has been found that, cylindrical micelles control the transformation of solubilized silica and alumina during the formation of zeolite nuclei and guide their crystal growth to nano-Beta rods with bimodal mesoporosity. The predominant smaller mesopores originate from the template's hydrophobic alkyl chains, while larger mesopores (10 to 30 nm) are supposed to result from a spinodal decomposition-type segregation of phases consisting of as-formed hydrophobic zeolite rods and an aqueous solution.
Keywords: Nano-Beta, self-assembly mechanism, spinodal decomposition.
Introduction
Microporous crystalline aluminosilicates, known as zeolites, exist with different structure topologies (currently 232 structure types are known).1 Even though millions of structures are theoretically predicted,2
they remain difficult to be obtained experimentally. Nonetheless, a multitude of parameters can be varied resulting in a highly diverse pool of zeolites allowing for adaptation of properties to certain needs, e.g., in catalysis, adsorption or separation technology. Synthesis parameters enable direction of structure types, zeolite composition, and morphology control as well as introduction of larger pores via constructive and/or destructive methods.3 For upgrading of biomass to renewable liquid fuels or base chemicals, feedstocks often comprise rather bulky molecules. The latter only diffuse very slowly within the
1 Database, revised 2017: http://asia.iza-structure.org/IZA-SC/ftc_table.php
2 Blatov, V. A.; Ilyushin, G. D.; Proserpio, D. M. Chem. Mater. 2013, 25, 412–424.
3 Schwieger, W.; Machoke, A. G.; Weissenberger, T.; Inayat, A.; Selvam, T.; Klumpp, M.; Inayat, A.
micropores of zeolites, they are sometimes even much larger than the micropore diameters of the zeolites. Therefore, the introduction of larger pores in zeolites is considered highly favorable for conversion of bulkier molecules in zeolite-based catalysts.4 Mass transport limitation is still a major drawback for
catalysis in zeolites. Destructive methods (dealumination or desilication) for the generation of hierarchical pore systems, consisting of smaller micropores connected to larger meso- and macropores as transport pores, are comparably cheap. They are applied at industrial scale and oppose to constructive techniques, employing highly engineered but more expensive supramolecular structure directing agents. The benefits and drawbacks of organotemplated syntheses of nano-sized or hierarchically porous zeolites are extensively reviewed.5 The constructive synthesis with rationally designed surfactant molecules exhibiting
functional groups, such as quaternary ammonium centers to enhance the interaction with growing zeolite crystals, appears nonetheless elegant.
Examples for this route include amongst others the syntheses of mesoporous MFI and LTA zeolites via soft template engineering.6,7 Later on, pillared MFI nano-sheets with thicknesses of unit cell dimensions have been synthesized with poly-cationic surfactants.8 The same group recently achieved the synthesis of
highly porous Beta zeolites using a series of novel gemini-type poly quaternary ammonium surfactants (Figure S1).9 Hierarchical Beta zeolites have been often reported as promising candidates in heterogeneous catalysis, e.g., for Friedel Crafts acylation and alkylation reactions,9,10 for selective synthesis of lactide monomers enhancing a more cost-efficient production of bio-plastics,11 for continuous transformation of bio-sourced ethanol into hydrocarbons in a gas phase reaction,12 or for continuous
halogenation of aromatics in liquid phase.13 Understanding direct formation of hierarchical Beta zeolite is
of high interest for both, researchers working on materials synthesis and for those working in heterogeneous catalysis.
In previous work Ryoo and coworkers have described a reasonable self-assembly mechanism for pillared MFI zeolite14 but the formation of rod shaped nano-Beta crystals as obtained with the use of gemini-type
multi-quaternary ammonium cations remains unsatisfactorily understood. The investigation of zeolite self-assembly and crystallization presents a persisting challenge.15 It is generally accepted that weak and strong
4 Thomas, J. M.; Harris, K. D. M. Energy Environ. Sci. 2016, 9, 687–708.
5 a) Mintova, S.; Gilson, J.-P.; Valtchev, V. Nanoscale 2013, 5, 6693–703. b) Pérez-Ramírez, J.;
Christensen, C. H.; Egeblad, K.; Christensen, C. H.; Groen, J. C. Chem. Soc. Rev. 2008, 37, 2530–42.
6 Choi, M.; Cho, H. S.; Srivastava, R.; Venkatesan, C.; Choi, D.-H.; Ryoo, R. Nat. Mater. 2006, 5, 718–
723.
7 Cho, K.; Cho, H. S.; de Ménorval, L.-C.; Ryoo, R. Chem. Mater. 2009, 21, 5664–5673. 8 Choi, M.; Na, K.; Kim, J.; Sakamoto, Y.; Terasaki, O.; Ryoo, R. Nature 2009, 461, 246–249.
9 Na, K.; Jo, C.; Kim, J.; Cho, K.; Jung, J.; Seo, Y.; Messinger, R. J.; Chmelka, B. F.; Ryoo, R. Science
2011, 333, 328–32.
10 Corma, A.; Garcfa, H. Catal. Today 1997, 38, 257–308.
11 Dusselier, M.; Wouwe, P. Van; Dewaele, A.; Jacobs, P. A.; Sels, B. F. Science 2015, 349, 78–80. 12 Astafan, A.; Benghalem, M. A.; Pouilloux, Y.; Patarin, J.; Bats, N.; Bouchy, C.; Daou, T. J.; Pinard, L.
J. Catal. 2016, 336, 1–10.
13 Losch, P.; Kolb, J. F.; Astafan, A.; Daou, T. J.; Pinard, L.; Pale, P.; Louis, B. Green Chem. 2016, 18,
4714–4724.
14 Na, K.; Choi, M.; Park, W.; Sakamoto, Y.; Terasaki, O.; Ryoo, R. J. Am. Chem. Soc. 2010, 132, 4169–
77.
15 Goesten, M. G.; Zhu, X.; Mezari, B.; Hensen, E. J. M. Angew. Chem., Int. Ed. 2017,
interactions between template and building units lead to the formation of aluminosilicate framework around structure directing agents (SDAs). The mechanism of zeolite formation is commonly studied in colloidal precursor suspensions permitting to follow the growth process with a number of non-invasive techniques.16
We have used a set of complementary characterization techniques that enabled snapshots of zeolite Beta growth at the different stages of crystallization using a gemini-type poly quaternary ammonium surfactant as structure-directing agent. The molecule is denoted here as N6-diphe in accord with the original work by
Ryoo and coworkers.9 Small angle X-ray scattering (SAXS) combined with liquid state nuclear magnetic
resonance (NMR), mass spectrometry (MS) and dynamic light scattering (DLS) constitute a powerful toolbox for studying formation of nano-objects.17 Nano-aggregates (NA), secondary nanoparticles (sNP),
tertiary nanoparticles (tNP), and crystalline nanoparticles (cNP), can be differentiated, since each type of objects has a different signature (size, shape, and average internal connectivity <n>). In order to cast light on the N6-diphe-induced self-assembly mechanism, these techniques were associated with a thorough
characterization of fully crystallized materials and theoretical evaluation of properties of a SDA molecule in water by molecular modeling. Ultimately, based on the presented snapshots, we propose a self-assembly mechanism that illustrates the formation of hierarchically porous Beta zeolite.
Results and Discussion
The syntheses using N6-diphe-based structure-directing agents (SDA) have been reported to result in
zeolite Beta with a hierarchical pore system, consisting of interconnected micro- and mesopores.9 In the
present work, two slightly different SDAs were used. In a first series of experiments N6-diphe(OH)6 was
used in a more dilute system, denoted here as “sol” since the reaction proceeds in a transparent reaction mixture. Such reaction systems are more favorable for investigating processes in solution. The zeolite synthesized in that system is accordingly denoted as Nano-Betasol. In a second series, N6-diphe(Cl)4(Br)2
was employed as SDA. The paste-like reaction mixture had higher silica concentration and is denoted as “gel” in the following, the product denoted as Nano-Betagel. The pH required for the generation of zeolite
Beta is set directly by the N6-diphe(OH)6 in the sol system, whereas for the gel system addition of sodium
hydroxide is required. Thus, both reaction systems have slightly different compositions. The synthesis conditions are summarized in Table S1 in the supporting information.
The fact that materials with hierarchical pore systems can be realized from both systems is proven by argon sorption experiments as illustrated in Figure 1. The textural parameters derived from the sorption experiments are summarized in Table 1. Pore size distribution plots for Nano-Betasol. and Nano-Betagel
zeolites show the presence of the typical micropores of zeolite Beta (first maxima of pore size distributions at pore diameters < 1 nm). The presence of mesopores in both materials is evidenced by steep adsorption and desorption steps in the relative pressure range of p/p0 = 0.4-0.9. The hystereses between
adsorption and desorption data are typical for capillary condensation in mesopores. Nano-Betasol. and
Nano-Betagel zeolites (Table 1, Figure 1) have quite remarkable textural properties. Their total pore
volumes reach 1.1 and 0.9 cm3.g-1 whereby Nano-Beta
Gel has slightly lower micro- and mesopore volumes
compared to Nano-BetaSol. The micropore volumes are lower than those of a reference Beta zeolite that
16 Grand, J.; Awala, H.; Mintova, S. CrystEngComm 2016, 18, 650–664.
17 Castro, M.; Haouas, M.; Lim, I.; Bongard, H. J.; Schüth, F.; Taulelle, F.; Karlsson, G.; Alfredsson, V.;
was synthesized with tetraethylammonium hydroxide as the SDA (Vmicro = 0.24 cm3.g-1). Both Nano-Beta
materials have apparent specific surface areas and pore volumes similar to those of ordered mesoporous Al-MCM-41.9
Figure 1. Argon sorption data (87 K) for Nano-Betagel (hollow symbols) and Nano-Betasol. (full symbols). The left graph traces the adsorption-desorption isotherm of the two zeolites, while the right graph depicts the pore diameter distribution (NLDFT) for the two zeolites.
Table 1. Textural properties of different compared materials from argon sorption experiments at 87 K.
Sample Si/Ala N6-diphe Vtot
c (cm3.g-1) Vmicro d (cm3.g-1) Vmeso d (cm3.g-1) SBETb (m2.g-1) Smeso d (m2.g-1) Dmeso d,e (nm)
Nano-Betasol. 12.3 (OH)6 1.108 0.153 0.988 778 593 7.9 Nano-Betagel 15.4 (Cl)4(Br)2 0.899 0.117 0.866 724 542 5.8 a obtained by ICP analysis
b S
BET is apparent specific surface area calculated from data obtained at p/p0 = 0.05 to 0.3 using the
Brunauer-Emmett-Teller (B.E.T.) equation c total pore volume obtained at p/p
0 = 0.99
d diameters and volumes were evaluated using NLDFT model (see Fig. 1) e mean mesopore diameter
Electron microscopy provides further information on the textural properties of the synthesized materials. SEM micrographs of Nano-Betasol and Nano-Betagel are presented in Figure 2. Little differences between
these materials can be observed in HRSEM images (Figure 2, top row). Both Nano-Beta samples show a rugged surface consisting of small elongated particles with diameters of about 4-5 nm and lengths in the range of about 10-15 nm. No major differences in the primary particle dimensions in Nano-Betasol and
Nano-Betagel can be observed except that the elongated nanoparticles from the Nano-Betagel system appear
to be slightly smaller than those from the Nano-Betasol system. The primary particles are aggregated in
larger units and larger pores are observed between the aggregates. In order to visualize the organization of the larger pores, the samples were embedded in resin and then the embedded samples were cut with a microtome blade. The surfaces of these cuts were then investigated by HRSEM (Figure 2, middle row).
The images of the respective surfaces show the organization of a highly interconnected mesopore system for Nano-Betasol and Nano-Betagel. A bi-continuous organization of the aggregated nanoparticles and
larger mesopores is observed in the Nano-Beta materials. For both samples mesopores with sizes ranging from 5 to 30 nm are visible. TEM images (Figure 2, bottom row), provide further information. Nano-Betasol and Nano-Betagel consist of nanoparticles (≤ 10 nm) and lattice fringes within these particles
indicate that they are crystalline. XRD investigations provide evidence that the samples contain zeolite Beta (Figure 3). The reflections of the zeolite are substantially broadened due to the nanoscopic size of the crystalline particles.
Figure 2. Nano-Betasol (left) and Nano-Betagel (right). a) HRSEM of calcined samples, b) HRSEM images of the same samples after embedding of the samples in resin and polishing of the surfaces. c) TEM, arrows indicate direction of lattice fringes and circle the particle size.
Sorption analyses, electron microscopy and XRD thus provide clear evidence that the final products of Nano-Betasol and Nano-Betagel consist of crystalline zeolite Beta nanoparticles of a few nanometers in size.
The nanoparticles are aggregated and larger mesopores are observed which form a highly interconnected pore system throughout the larger aggregates of crystalline nanoparticles.
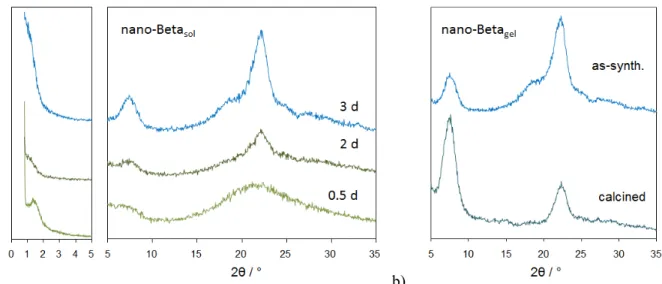
a) b)
Figure 3. a) Powder XRD patterns of samples withdrawn from hydrothermal synthesis of Nano-Betasol. with N6 -diphe(OH)6 after 12 h, 2 days and 3 days; b) comparison of XRD patterns of calcined Nano-Betagel synthesized with N6-diphe(Cl)4(Br)2.
Using the conventional tetraethylammonium hydroxide as structure-directing agent (SDA), we could show that during formation of colloidal zeolite Beta, amorphous initial nanoparticles (NPs) are formed in a first step. These are then transformed successively into crystalline zeolite Beta during hydrothermal synthesis.17 In order to understand how Nano-Beta materials are generated via self-organization, we thus monitored the formation processes of the mesoporous Nano-Beta materials, which have proven to be promising catalysts,9 with a similar combination of complementary analytical methods as we used in our
previous work.
A first hint of a supramolecular interaction of N6-diphe originates from molecular dynamics calculations
(see ESI for details), which were performed in water and with chloride counter-anions. One molecule of N6-diphe was simulated in a 10 nm long cubic box together with about 35000 water molecules and six
chloride ions. This poly-cationic surfactant molecule seems to be able to form a micelle structure. The N6
-diphe molecule tries coiling up its hydrophobic alkyl chains to minimize contact of these chains with water. The quaternary ammonium centers are exposed to the surrounding water as one would expect (Figures S2-S6). The N6-diphe molecule thus behaves quite similarly as conventional amphiphilic
surfactant molecules. It is flexible enough to organize in configurations that avoid contact of the alkyl chains with water. Micelle forming molecules are defined by their critical packing parameter (CPP).18 This parameter indicates the geometrical ability of a surfactant molecule to preferentially form inverse micelles (CPP > 1) or normal micelles (CPP < 1). In the present case, it seems that N6-diphe exhibits a CPP << 1
and thus can easily organize in normal micelles. The calculations allowed also estimation of the dimensions of specific units of the N6-diphe molecule (see ESI).
The self-assembly of the SDA with the aluminosilicate forming highly porous zeolite Beta was studied on suspensions withdrawn during aging of the synthesis sols/gels and during the successive hydrothermal reaction to form the crystalline product. DLS and SAXS were used to directly monitor the formation and growth of particles with time. It is important to note that the interpretation of DLS results (Figure S7 and Table S2) are biased by a spherical approximation and are strongly affected by hydration shells around charged particles. Nonetheless, these results discriminate between initial particles in the synthesis mixture
(size ~ 10 nm) and their progressive growth during the first 36 h of hydrothermal synthesis to particles with sizes of 20-30 nm. Particle sizes did not vary significantly during prolonged hydrothermal reaction. Small angle X-ray scattering (SAXS) enables the direct observation of formed nanoparticles (NPs), as well as evaluation of particle-particle interaction and determination of polydispersity and sizes of NPs. For consistency and direct comparison of SAXS and XRD data, all scattering data will be presented with the scattering angle 2θ as the abscissa throughout this study (the respective SAXS curves on q scale are shown in the supporting information). Figure 4a shows the SAXS data measured during aging of the reaction mixture for the Nano-Betasol. system. Directly after addition of N6-diphe(OH)6 to water, distinct minima
and maxima are observed in the scattering curve indicating the organization of N6-diphe molecules as
micellar units. The scattering curve cannot be fitted directly by using one individual conventional model (spherical, cylindrical or lamellar) for micelles in solutions. Only consideration of a combination of two types of micellar models (PolyCoShCylinder and LamellarParaCrystal)19 allows fitting of the experimental scattering curves (Figure S8). The two models that allowed for a satisfying fit with experimental data consider existence of lamellar paracrystals as well as of cylindrical core-shell particles. In lamellar paracrystals amphiphilic molecules form stacked bilayers, examples being folded sheets or multilamellar vesicles. For larger multilamellar vesicles with sizes in the range of micrometers, the layers can be also regarded as more or less flat stacks of lamellae. The thickness of the layer in the lamellar paracrystals was refined to be 7.1 nm. The scattering data show that cylindrical core-shell particles coexist with the lamellar paracrystals. The average core diameter was refined to be 4.8 nm and the shells have thicknesses of about 0.2 nm. The presence of the shell with higher scattering length density than the surrounding water can be explained by a denser packing of water molecules at the vicinity of the highly charged surfaces of the cylindrical N6-diphe micelles. The diameter of the cylindrical micelles was about 5
nm. The maximum length of the aliphatic chain in N6-diphe molecules was calculated to be 2.5 nm (see
results of MD calculation in ESI). That value corresponds well to a more or less radial arrangement of the stretched aliphatic side chains in cylindrical micelles. The thickness of the layers in the lamellar paracrystals indicate a slightly different arrangement and the half thickness of the bilayers corresponds better to the distances calculated from the end of the aliphatic side chains to the nitrogen atoms (N1) in the head group.
Upon addition of silica (hydrolyzed TEOS), the initially formed cylindrical N6-diphe micelles maintain
their core-shell structure as indicated by the SAXS patterns. However, the minima and maxima of the scattering curves shift towards lower 2θ angles (i.e. to lower q) indicating changes of the sizes of the particles. Simultaneously, the scattering intensities increase significantly with increasing silica concentration (increase of scattering contrast due to silica deposition). Applying the same combined models as described above allows evaluation of the properties of the SDA-silica core-shell particles and larger lamellar paracrystals. The scattering length density of the shell corresponds well to that of aluminosilica and the thickness of the shell increases with increasing silica concentration. As reported in Table S3, the silica shell thickness increases steadily from 0.35 nm at Si/OH = 0.33 to 1.07 nm at Si/OH = 2.77 whereas the diameter of the organic core remains more or less constant with values of about 4.4 ± 0.2 nm. The volume of aluminosilica shells in the system increases linearly with the Si/OH ratio, if a constant length of the core-shell cylinders is assumed. This suggests that the aluminosilica shell preferentially forms on the cylindrical N6-diphe micelles. One reason for the preferential deposition of silica on the
smaller cylindrical micelles could be the much larger sizes of lamellar paracrystals. Multilamellar vesicles
typically have sizes in the micrometer range and thus comparably low external surface areas. In addition, the inner bilayers within multilamellar vesicles are not accessible. Exchange of N6-diphe between different
micellar objects cannot be excluded and additional cylindrical micelles may form upon addition of silicate on the expense of the lamellar paracrystals. It is obvious that the reaction mixture contains substantially more N6-diphe than required for filling only the cylindrical micelles. A rough calculation shows that only
a small fraction of the SDA can get accommodated within the cores of the core-shell cylinders. The numbers in Table S3 show that at 298 K only 12 % of the SDA can be present in the cores at a Si/OH of 0.33. The fraction of SDA within the cores of the cylinders increases with increasing Si/OH ratio, however it is still only 21 % at a Si/OH of 2.77. Thus a major fraction of the N6-diphe must be located in the
lamellar paracrystals. It should be mentioned that the refined lengths of the cylindrical core-shell particles vary from about 5 to 10 nm. The overall scattering intensity is not much affected by that parameter and thus a certain scatter of refined values is observed. However, the lengths of the cylinders likely lie in that size range as corroborated by the DLS data (Figure S7 and Table S2).
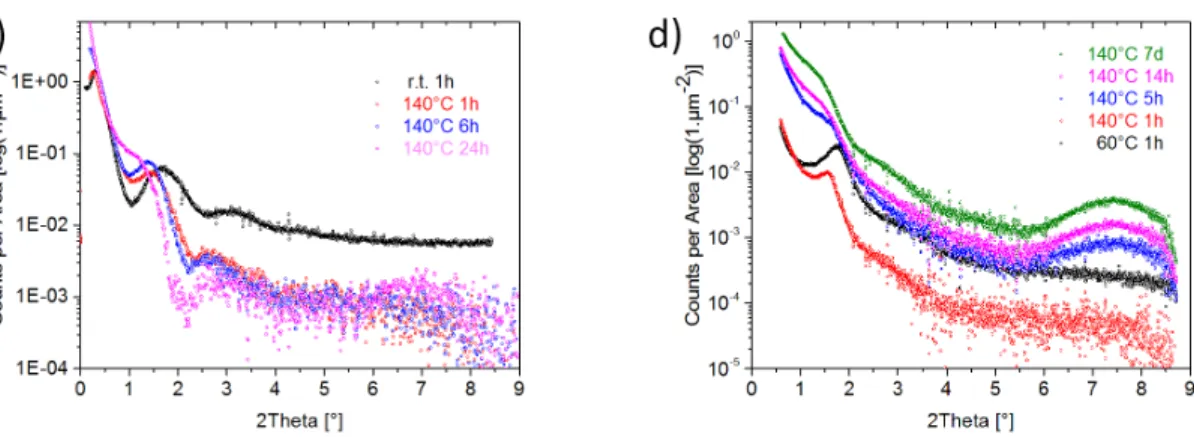
Figure 4c shows SAXS data for the Nano-Betasol system during the hydrothermal synthesis at 140°C. The
shift of the scattering intensities towards lower 2θ indicates that the samples withdrawn at 1, 6 and 24 h undergo a gradual growth of particle sizes with time, well in accord with the DLS data. The SAXS curve of the Nano-Betasol sample obtained after 24 h at 140°C can be fitted with a model for elongated particles
(either cylinders or parallelepipeds as shown in Figure S9) with diameters of about 5 nm and lengths of about 10 nm embedded in an organic phase. The position of an additional Gaussian Peak that needs to be considered for a satisfying fit of the data corresponds to a distance of about 8 nm which fits well to an average particle-to-particle distance between the aggregated zeolite Beta nano-crystallites. These particle dimensions and particle-to-particle distances are well in accord with the particles observed in the HRSEM and TEM images. An additional peak at 2θ of about 7.6° (q = 5.3 nm-1) indicates the formation of crystalline zeolite Beta after one day of hydrothermal reaction. One should note that in contrast to the particles initially formed at room temperature, where an organic core is embedded in a silicate shell, silica particles are embedded in an organic shell after the hydrothermal reaction. Thus, a transformation from an amorphous silicate shell into a zeolite embedded in an organic hydrocarbon shell (hydrophobic side chains of N6-diphe) has occurred during the reaction at 140°C. The external surfaces of the zeolite
Figure 4. SAXS raw data for a) the Nano-Betasol system (water, N6-diphe(OH)6 in water, and different amounts of added silica (TEOS) and b) the Nano-Betagel system (water, N6-diphe(Cl)4(Br)2 in water, and upon addition of NaOH, NaAlO2 + NaOH and full synthesis mixture; all measured after 1 h at 60°C, (X)6 indicates (Cl)4(Br)2). Background-corrected and desmeared SAXS data of samples withdrawn after different time of reaction at 140°C for c) Nano-Betasol and d) Nano-Betagel. Curves in b) and d) are shifted slightly along the ordinate for better visibility of the individual traces.
Formation of a zeolite Beta phase was corroborated by XRD measurements as shown in Figure 3a. After 12 h only broad peaks are visible indicating that the majority of the product is still amorphous. After one to two days of hydrothermal reaction broad reflections indicate the formation of very small crystalline domains of zeolite Beta in accord with the results from the SAXS data. With increasing reaction time, the reflections become more pronounced but they remain very broad, i.e., the nanoscopic zeolite Beta crystallites do not grow significantly in size.
In contrast to the clear solutions for which a mix of cylindrical core-shell particles and lamellar paracrystals was observed prior to hydrothermal reaction in the Nano-Betasol system, the self-organization
of the system seems to proceed slightly differently for more concentrated Nano-Betagel system. Figure 4b
shows SAXS curves measured on different gels obtained with varying compositions. All gels have been measured after aging at 60°C for one hour as pointed out in the synthesis protocol. Since gels containing the silicate caused very high scattering intensity at low 2θ (low q) for the Nano-Betagel system, the beam
stop of the SAXS instrument had to be set to higher angle to avoid quenching of the detector. This caused a loss of information from the respective range for these materials in the Nano-Betagel system. Even
though inspection of the SAXS curves is quite instructive. The curve of the N6-diphe(Cl)4(Br)2 in water
shows that also in that system cylindrical micelles are formed with core diameters of 4.8 nm and shell thickness of 0.5 nm, quite similar as observed for N6-diphe(OH)6 in water. Upon addition of NaOH to the
system the ionic strength of the solution increases substantially which strongly affects the micellar arrangement of the system. Diffraction peaks are observed in the SAXS curves which can be indexed in Ia-3d symmetry with a lattice parameter of a = 16.3 nm (Figure S10). The micelles thus seem to organize in a bi-continuous system of cylindrical micelles in a similar manner as observed for MCM-48 or KIT-6. 20
20 a) Monnier, A.; Schüth, F.; Huo, Q.: Kumar, D.; Margolese, D.; Maxwell, R.S.; Stucky, G.D.;
Krishnamurty, M.; Petrov, P.; Firouzi, A. Janicke, M.; Chmelka, B. Science 1993, 261, 1299-1303; b) Kim, T.-W. ; Kleitz, F.; Paul, B.; Ryoo R. J. Am. Chem. Soc. 2005, 127, 7601-7610; c) Jo, C.; Kim, K.; Ryoo, R. Microporous Mesoporous Mater. 2009, 124, 45-51.
A system containing the SDA, NaOH and NaAlO2 shows more or less the same diffraction peaks. The
complete reaction mixture which contains hydrolyzed silica in addition to SDA, NaOH and NaAlO2 does
not show the discrete diffraction peaks but a rather broad peak and some shoulders in the scattering curve. If a small fraction of the regularly organized micelles with Ia-3d symmetry would be present in that mixture, its concentration would be rather low or its order would be lost to large extent. The scattering curve of the complete gel obtained after aging at 60°C can be modelled by cylindrical core-shell particles and a Gaussian peak corresponding to a length of 5.1 nm (Figure S11). The core diameter of the particles is calculated as 4.4 nm and the silica shell thickness as 1.6 nm (Table S4).
During hydrothermal reaction at 140°C the scattering curve as well as the Gaussian peak are shifted towards smaller angles with time (Figure 4d) indicating a gradual growth of the core-shell cylinders. With increasing reaction time, the SAXS curve changes significantly. The curve of the final product can be modelled again by cylindrical nanoparticles with diameters of 3.8 nm and lengths of about 5 nm or a parallelepiped with sizes of 5.3 x 5.3 x 12.5 nm (Figure S11). For fitting the curves with the model, the nanoparticles are considered to be embedded in an organic matrix. Similar as for Nano-Betasol the sizes of
the elongated particles are calculated to lie in the range of about 4 to 5 nm in diameter and 5 to 12 nm in length, well in accord with the final particles observed by HRSEM. A Gaussian peak corresponding to a length of 6.8 nm is observed on top of the scattering curve from the cylindrical particles which could correspond to an average particle-particle distance. The occurrence of the broad reflection of zeolite Beta is observed after 5 h at 140°C in the Nano-Betagel system, indicating that the first zeolite Beta crystallites
are formed already shortly after the beginning of the hydrothermal reaction (Figures 4d and S12). Calcination of the final product at 550°C results in slight changes of the intensities of the reflections but the widths of the reflections are not affected significantly by the high temperature treatment (Figure 3b). NMR spectroscopy has been employed for investigating the processes taking place during the formation of the two materials on a molecular level. Liquid state NMR was used for the Nano-Betasol system and
solid state NMR for Nano-Betagel. The course of the Nano-Betasol formation with time was monitored by 1H, 1H DOSY, 14N, 27Al, and 29Si NMR. The signal narrowing of N
6-diphe resonances, both in 14N (Figure
5a) and 1H spectra (Figure 5b), with increasing reaction time is opposite to what had been observed for the formation of colloidal zeolite Beta.,17 and indicates an increased mobility of organic chains with the
progress of the synthesis. This increased mobility of organic chains is also corroborated by the increase of measured diffusion coefficients with the progress of the synthesis (Figure S13). The increasing mobility of the organic chains can be explained by change of their location from inside of the initially formed cylindrical micelles to the outside of the rod shaped nano-Beta crystallites (10 nm) which form during the hydrothermal treatment. Little change in 27Al NMR spectra (Figure S14) is observed during the synthesis where a single broad resonance is obtained at ca. 53-54 ppm. Hence, already at the start of the hydrothermal treatment aluminum in nanoaggregates is quantitatively connected to silicates in tetrahedral coordination. The 29Si NMR spectra (Figure S15) exhibit very broad resonances of nanoaggregated
silicates. No narrow signals of smaller oligomeric silicates are visible except for the signal of monomers in low concentration. The 27Al and 29Si NMR results indicate that the synthesis medium is exclusively
dominated by large particles of nanoaggregated silicate and aluminosilicate species, most probably surrounding N6-diphe molecules. This contrasts with the synthesis of colloidal zeolite Beta, where both
Figure 5. a) Liquid state 14N-NMR spectra of synthesis precursors of Nano-Betasol at different hydrothermal treatment. b) Average liquid state 1H NMR linewidth of N
6-diphe resonances for Nano-Betasol (red) and colloidal zeolite Beta17 (black) measured in synthesis solutionsat different hydrothermal treatment times.
The course of the synthesis of Nano-Betagel from gel precursor is monitored by means of 1H (Figure 6a), 29Si (Figure 6b), 27Al (Figure S16), and 13C MAS NMR (Figure S17). Figure 6a and 6b show narrow
lines for the aromatic protons of N6-diphe occurring simultaneously with the appearance of a characteristic 29Si feature (-112 ppm) typical for ordered zeolite domains. This indicates that the polar part of N
6-diphe,
the “TMP2+” group (4,4’-trimethylenebis(N-methyl, N-benzyl piperidinium))21 shown in Figure S1, is
located on structurally well-defined and ordered positions within the zeolite micropores. In other terms, the polar zeolite-directing head of N6-diphe seems to be occluded inside the nano-zeolites, whereas the
hydrophobic mobile alkyl chains are leading to very intense and strongly broadened signals in the range between 0 and 2 ppm. The hydrophobic part of the template is thus located outside of the microporous network. It is worth noting that the direct polarization and cross-polarization 29Si{1H} spectra are
comparable (Figure S18) indicating efficient CP transfer even for 4Q Si species. This suggests a strong
spin pool from the N6-diphe surfactant that should be spatially close to the silicate framework. Indeed, 13C-1H and 29Si-1H correlation experiments (Figure 7), show dipolar contact between the aromatic part of
the N6-diphe and the inorganic surface. This demonstrates again the structuring effect of the rigid polar
head of the N6-diphe. The 27Al spectra exhibit asymmetrical resonance that slightly narrows with
increasing synthesis time, indicative for increasing local order in the zeolitic network. Finally, 3QMAS experiment (Figure S19) revealed two distinct components with isotropic chemical shifts at ca. 54 and 57 ppm, representative for two distinct Al sites in the zeolitic nanorods. Maier et al. assigned these signals to aluminum atoms located on the T3-T9 positions, for the 57 ppm signal and T1, T2 position for the signal at 54 ppm.22
21 Hould, N.; Haouas, M.; Nikolakis, V.; Taulelle, F.; Lobo, R. Chem. Mater. 2012, 24, 3621–3632. 22 Maier, S.M.; Jentys, A. ; Lercher, J.A. J. Phys. Chem. C 2011, 115, 8005–8013.
-420 -380 -340 -300 -260 -220 δ(14N) ppm 3 h 1 h 24 h / 140°C 20 h 6 h 0 h
a)
b)
0 5 10 15 20 25 0" 10" 20" 30" 40" t (h) " 1H" lin ew id th "(Hz) " SDA(OH)6 TEAOHFigure 6. a) 1H MAS and b) 29Si{1H} CPMAS NMR of as synthesized Nano-Betagel. at different hydrothermal treatment: Narrow lines in a) indicate that the polar part of the template (the “TMP2+” group) is located on structurally well-defined positions within the zeolite micropores that correlates well with the appearance of the characteristic features of crystalline zeolite observed in b).
Figure 7. 2D Hetcor MAS a) 13C-1H and b) 29Si-1H correlation spectra of as-synthesized Nano-Beta
gel. at 140°C for 12 h. -4 -2 0 2 4 6 8 10 Structuring
a)
-130 -120 -110 -100 -90 -80 -70 6 h 1 h 7 d / 140°C 3 d 1 d Zeolite featureb)
δ(1H) ppm δ(29Si) ppm ! !! ! !! ! ! !! ! ! !! ! ! !! ! ! !! ! ! ! ! !! ! ! ! ! 0 40 80 120 ppm ! ! ! ! ! ! ! ! 1H 13C -2 2 6 10 ‘TMP interaction 2+’-silicaa)
1.9 ppm (silanol) Ca. 5 ppm (aromatic) -140 -120 -100 -80 ppm -2 2 6 10 1H 29Sib)
! ! Si! O! H! Si! O! H! Si! O! H! Si! O! H! Si! O! H! Si!O! H! ‘TMP2+’ SiO2% ‘TMP2+’Thus, SAXS and liquid state NMR led to insights on how Nano-Betasol zeolite forms in clear solutions.
Complementarily, solid state NMR proved to be a powerful tool to follow events at the molecular scale during the zeolite crystallization in denser Nano-Betagel synthesis mixtures.
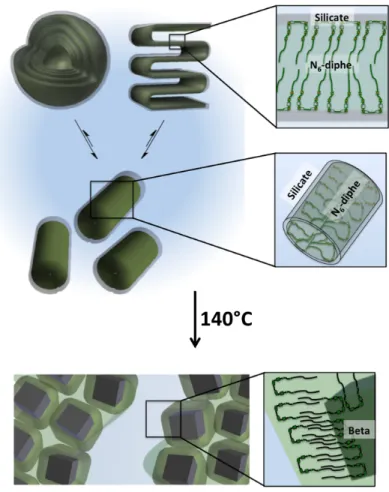
The results presented above shed some light on the building mechanism of crystalline zeolite Beta from amorphous silicate using a gemini-type piperidine based multi-ammonium surfactant as SDA (Figure 8). Prior to the hydrothermal synthesis, cylindrical core-shell particle with an outer aluminosilicate shell are formed in close proximity to the tetraalkylammonium-rich outer surface of the core consisting of N6
-diphe6+ molecules organized in micelles. All silica and alumina is located within the aluminosilicate shells
and no free oligomeric silica species are observed. The thicknesses of the inorganic shells have been estimated to be in the range of 0.2–0.5 nm, i.e., about one to three aluminosilicate layers. A major fraction of the SDA seems to be present as larger micellar objects such as multilamellar vesicles or larger lamellar paracrystals. During hydrothermal synthesis the amorphous aluminosilicate shells are transformed to zeolite nanoparticles. Crystallization requires formation of flat faces; hence cylindrical silicate shells need to break up to form zeolite Beta particles. The alkylammonium-rich part of the N6-diphe, which triggers
the formation of the zeolite, gets embedded within the zeolite channels during the crystallization process. The long linear alkyl chains are not incorporated in the zeolite though and extend to the exterior of the zeolite nanoparticles. They cover the zeolite as a hydrophobic organic layer. The naturally occurring phenomenon of Ostwald ripening, which usually minimizes the free surface energy of particles via dissolution of smaller and further growth of larger ones23 is hindered by the presence of the N
6-diphe.
Thus, N6-diphe notably affects the normal equilibrium between growing particles and dissolved silica
species during the zeolite synthesis. As the result, the zeolite Beta particles which are formed maintain the average dimensions of the initially formed core-shell particles.
23 a) Valtchev, V.; Tosheva, L. Chem. Rev. 2013, 113, 6734–60. b) Do, M. H.; Wang, T.; Cheng, D. G.;
Chen, F.; Zhan, X.; Rioux, R. M.; Gong, J. Small 2014, 10, 4249–4256. c) Epping, J. D.; Chmelka, B. F. Curr. Opin. Colloid Interface Sci. 2006, 11, 81–117.
Figure 8. Schematic illustration of the formation of zeolite Beta particles from nanoscopic core-shell cylinders with
organic core and aluminosilicate shell in aqueous phase (center). Top: Multilamellar vesicles and/or lamellar paracrystals accommodate a large fraction (>70%) of the N6-diphe molecules. Bottom: During hydrothermal reaction at 140°C, the amorphous aluminosilicate crystallizes to form zeolite Beta nanoparticles which are decorated with hydrophobic alkyl chains. Aggregation of the organo-coated particles results in discrete hydrophobic zeolite-containing and polar aqueous phases.
Once the zeolite Beta crystallites form, they have to organize in a way that avoids contact of their hydrophobic coatings with water. The organo-coated zeolite crystallites aggregate to avoid contact with water. This causes a phase separation, similar to the phase separation via spinodal decomposition as observed for oil-water mixtures at elevated temperature. The surface active N6-diphe molecules are
present in large excess; they likely stabilize the boundary between the polar aqueous phase and the hydrophobic phase containing the zeolite crystallites. Similar as in the case of spinodal decomposition of oil-water phases, two bi-continuous phases composed of an aqueous solution and the organic phase form. The latter contains the organo-coated zeolite crystallites. Upon drying, the aqueous phase is removed from the system leaving the sponge-like network of larger mesopores observed in HRSEM. Calcination finally decomposes the N6-diphe molecules and smaller textural mesopores with sizes of only a few nanometers
are formed via aggregation of the zeolite nanoparticles (see also Figure S20).
Conclusion
Combining the results from complementary analytical methods allowed to unravel the formation of mesoporous zeolite Beta using a gemini-type piperidine-based multi-ammonium surfactant. The formation
of a hierarchical micro- and mesoporous zeolite Beta material in a one-step synthesis was confirmed and the individual steps, which proceed successively during the formation of sponge-like zeolite Beta materials have been uncovered. The amphiphilic N6-diphe forms micelles in aqueous solution with the
polar head-groups decorating the micelles surfaces. Addition of silica and alumina precursors results in aggregation of a thin aluminosilicate shell around the polar head-groups of the N6-diphe, resulting in
cylindrical N6-diphe-aluminosilicate core-shell particles. Upon hydrothermal reaction, the aluminosilicate
is transformed into zeolite Beta. The formation of the zeolite is directed by the polar head-groups of the N6-diphe, which get incorporated within the micropores of the zeolite. The hydrophobic chains of the N6
-diphe do not get incorporated within the zeolite and extend into the aqueous solution, decorating the external surfaces of the zeolite Beta nanoparticles. Aggregation of the hydrophobic N6-diphe/zeolite
nanosized inverse micelles in the polar aqueous solution results in bi-continuous solid-liquid phases. Combustion of the N6-diphe then results in the formation of a sponge-like mesoporous solid zeolite Beta
phase, consisting of individual zeolite particles with sizes of only about 5 nm in diameter and 10 nm in length.
Experimental
Zeolite syntheses
The reactants used in all these syntheses were TEOS (Sigma Aldrich, 98%), TEAOH (Sigma Aldrich, 35 wt%), and Al(s-OBu)3 (Sigma Aldrich). N6-diphe(OH)6 and N6-diphe (Cl)4(Br)2 were synthesized according to published procedure.9
Typical zeolite synthesis conditions were as follows:
The molar composition of the zeolite BetaRef. was as follows 1 SiO2 : 0.02 Al2O3 : 0.5 TEAOH : 16 H2O : 4 EtOH The mixture was prepared in two steps. In the first step, the Al source (aluminum tri-sec-butoxide), water, and tetraethylammonium hydroxide (TEAOH) were mixed and stirred for 1 h. Then, the Si source (tetraethylorthosilicate or TEOS) was added drop wise under mild stirring, and the resulting sol was kept stirring to allow slow hydrolysis of TEOS. 24 h hydrolysis time was allowed for a synthesis using 21 g TEOS. The final clear sol was divided into equal parts, which were transferred into a series of Teflon-lined autoclaves and heated at 140°C for up to 5 days. After the desired heating time, the autoclaves with the synthesis sols were removed from the oven and quenched to room temperature. Separation of solids from the mother liquor was achieved by centrifugation in a Sartorius Sigma 3K30 centrifuge. The term “aging” will be used here to define the period of maturation of the initial solution/sol at room temperature under mild stirring once the TEOS is hydrolyzed.
The sample Nano-Betasol. was prepared with the following molar ratios x SiO2 : 0.033 Al2O3 : 0.06 N6-diphe(OH)6 : 300 H2O : 4/x EtOH : 0.2 i-PrOH (x = 0.12, 0.24, 0.36, 0.72, 1). All reactants were premixed while TEOS was introduced dropwise as last component. The resulting synthesis mixture was left stirring for 24 h to allow complete hydrolysis of TEOS. The aged clear synthesis solution was transferred into a Teflon lined stainless steel autoclave and hydrothermally treated at 140°C for times up to five days under static conditions. The exact composition of the clear solution studied in more detail by DLS, SAXS and NMR, was: 1 SiO2 : 0.033 Al2O3 : 0.06 N6-diphe(OH)6 : 300 H2O : 4 EtOH : 0.2 i-PrOH.
The sample Nano-Betagel. was prepared with the following molar ratios 1 SiO2 : 0.033 Al2O3 : 0.033 N6-diphe (Cl)4(Br)2 : 0.22 Na2O : 53 H2O : 4 EtOH : 0.2 i-PrOH. All reactants were premixed and TEOS added at once. Its hydrolysis was guaranteed by homogenizing the mixture for 1 h with a vortex stirrer. Then, the resulting gel was aged for 6 h at 60°C. The aged dense gel was transferred into a Teflon lined stainless steel autoclave and a hydrothermal synthesis was performed at 140°C for varying times up to 7 days under tumbling conditions.
Characterization
Textural properties were studied with argon sorption experiments on a 3Flex form Micromeritics for the Nano-Betagel andNano-Betasol. sample. They have been outgassed and dehydrated at 623 K for 8 h under vacuum. Then argon adsorption was measured at 87 K (liquid Ar). Sorption measurements for other samples have been carried out conventionally with nitrogen at 77 K. Apparent specific surface areas were calculated with the B.E.T. model using data in the relative pressure range of 0.05 to 0.3. Calculation of pore size distributions and pore volumes was performed using the NLDFT method with models assuming sorption of argon in cylindrical pores in oxidic materials at 87 K using the Micromeritics 3Flex software package. Total pore volumes were calculated from the volume adsorbed at relative pressures of p/p0 = 0.99.
DLS measurements were performed with an ALV/CGS-3 instrument (ALV, Langen, Germany). Prior to analyses, the samples were filtered with 200 nm CHROMAFIL PTFE syringe filters. DLS measurements were performed at scattering angles of 30°, 90° and 150° using a laser with a wavelength of 632.8 nm.
SAXS experiments were performed with an Anton Paar SAXSess mc2 instrument (Kratky camera) with line-collimated CuKα radiation. The liquids containing the reaction mixtures were measured in sealed 1 mm quartz glass capillaries (wall thickness 0.01 mm) on a temperature-controlled TCS 120 stage (Anton Paar). The scattered intensities were recorded with a 2D CCD camera (Princeton Instruments). Prior to data analysis, conventional data processing included subtraction of electronic background (CCD camera), scattering background from solvent and capillary and desmearing of the scattering curve (accounting for axial divergence due to measurement in capillaries). The data analysis was then performed with the SANS and USANS Analysis Tools for Igor Pro provided by the NIST
Center for Neutron Research.19 Scattering lengths densities for the individual phases have been calculated using the SasView 3.1.0 software package.24
XRD data were measured with a Stoe STADI P transmission diffractometer in Debye–Scherrer geometry. The instrument was equipped with a bent secondary germanium monochromator allowing measurements with monochromatic CuKα1 radiation. Diffracted intensities were recorded with a position-sensitive detector (PSD) fabricated by Stoe. The PSD enables simultaneous recording of about 6° 2θ. Samples were measured in 0.7 mm glass capillaries (wall thickness 0.01 mm) either in aqueous suspensions or as dry powders after separation of the nanoparticles by ultracentrifugation.
27Al, 29Si, 14N, and 1H liquid state NMR measurements were performed in 10 mm quartz tubes using a Bruker AVANCE-500 spectrometer for 27Al and 29Si, and Bruker AVANCE 400 spectrometer for 14N and 1H. The 27Al NMR spectra were recorded at a 27Al frequency of 130.33 MHz with a π/12 rad pulse length of 2.1 µs, a recycle delay of 0.1 s, and acquisition 1024 pulse transients. The 29Si NMR spectra were obtained at a 29Si frequency of 99.35 MHz with a π/4 rad pulse length of 3.7 µs, a recycle delay of 7 s, and acquisition of 1024 pulse transients. The 1H NMR spectra were recorded at a 1
H frequency of 400.13 MHz with a π/2 rad pulse length of 30.0 µs, a recycle delay of 4 s, and acquisition of 16 pulse transients. The 14N NMR spectra were obtained with a Larmor frequency of 28.91MHz under proton decoupling using a π/10 rad pulse length of 6.2 µs, a recycle delay of 2 s, and 1024 scans. Translational diffusion measurements were performed using Bruker’s “ledbpgs2s” stimulated echo DOSY pulse sequence including bipolar and spoil gradients.
All MAS NMR spectra were recorded on a Bruker Avance 500 spectrometer at a resonance frequency of 500.1 MHz for 1H, 130.3 MHz for 27Al, 125.7 MHz for 13C, and 99.3 MHz for 29Si. The samples were packed in a 4 mm zirconia rotor, and were spun at 10 kHz. For the 1H MAS NMR spectra 8 scans were recorded with a recycle delay of 5 s and a π/2 rad pulse of 4.1 µs. The 13C{1H} cross-polarization (CP) MAS NMR spectra were recorded using a 2.5 ms contact time, 2 s recycle delay and 1H SPINAL-64 decoupling. 1024 transients were accumulated. For the 13C{1H} HETCOR MAS NMR spectrum, the contact time was set to 1.5 ms, and 128 t1 slices with 112 transients each were recorded with recycle delay of 5 s. The 29Si{1H} CPMAS NMR spectra were recorded using a 6.5 ms contact time, 1.5 s recycle delay and 2048 transients. For the quantitative single-pulse 29Si MAS NMR spectra, 136 scans were recorded with a recycle delay of 250 s and a π/2 rad pulse of 4.4 µs. The 29Si{1H} HETCOR MAS NMR spectrum was recorded with a contact time of 6 ms, 16 t1 slices with 1024 transients, and a recycle delay of 5 s. For 27Al NMR, MAS spectra were recorded with signal averaging for 1024 transients with a repeat interval of 0.1 s. The 27Al MQMAS spectra were recorded using a three-pulse sequence for triple-quantum generation/reconversion and z-filtering with signal averaging for 196 transients for each of 128 t1 increments of 25 μs. All two-dimensional NMR spectra were recorded using the States procedure to obtain phase sensitive spectra.
All NMR measurements were performed with the natural abundance of the measured element. The 27Al and 14N chemical shifts are reported relative to Al(H2O)63+and nitromethane, respectively, and the 29Si, 13C and 1H chemical shifts are referenced to tetramethylsilane (TMS). Decomposition and simulation of the NMR spectra were achieved using the NMRnotebook program.25
HR-SEM images were measured with a Hitachi S-5500 high-resolution scanning electron microscope with an acceleration voltage of 30 kV. Samples were placed on copper grids with 3 nm carbon coatings.
Modelling
Charmm General Forec Field V. 2b6 for modeling of the surfactant and the TIP3P model for explicit solvent simulations have been used in this work. The model so far includes one surfactant (N6-diphe, 285 atoms) included in a water box of 102*102*102 Å (101129 water molecules). For the simulation, the system was minimized, heated to 300 K and equilibrated for 5 ns using Langevin dynamics and a Langevin piston barostat. The simulations were performed with the NAMD program. In general to force field calculations: A force field consists of parameters for different atoms and molecules, which can be used to calculate the potential energy of systems. The total energy consists of bonded (bond, angle and dihedral modeled as harmonic oscillators or as a morse potential) and non-bonded (electrostatic and Van Der Waals modeled with a Lennard-Jones potential and Coulombs law) terms. These
24 http://danse.chem.utk.edu/sansview.html
parameters are obtained by fitting the values to experimental data and ab initio calculations. The example used is an isobaric-isothermic one (NPT), and the pressure, which is 1 atm.
Supporting Information
Table S1. Properties of materials investigated in this work.
Samples Si/Ala
Si/Alb T (°C) SDA
Nano-Betasol. 16.7 12.3 140 N6-Diphe (OH)6 Nano-Betagel 16.7 15.4 140 N6-Diphe (Cl)4(Br)2 a: Si/Al-ratio of the synthesis gel.
b: Si/Al-ratio of the final product, by ICP.
Figure S1. Various structural representations of the studied gemini-type piperidine-based multi-ammonium
surfactant denoted as N6-diphe(X)6 with X- being either OH-, Cl- or Br-. A similar SDA with the structure denoted as TMP2+ in the structure above has been used by Hould et al. for the synthesis of aluminum-free zeolite Beta.21
Results from Molecular Dynamics Calculations
For describing the dynamical behavior of SDA we have used classical molecular dynamics (MD) within the NAMD program suite26 using the Charmm General Force Field V. 2b6.27 In our computations, one SDA molecule was considered in a 100 Å long cubic box together with 34,647 water molecules and 6 chloride ions. In the experiment hydroxyl groups balancing these charges but chloride atoms were included in the simulation since they are better explored then hydroxyl ions in molecular dynamics. Periodic boundary conditions were achieved with the Particle Mesh Ewald method. A cut-off distance of 10 Å was used for non-coulombic interactions.
The system was equilibrated to reproduce experimental conditions of 1 atm and temperature of 413 K with Langevin dynamics and Nosé-Hoover Langevin piston pressure control. A time step of 2 fs together with rigid bonds for water were used. After minimizing and heating the system, the simulation was propagated for 400 ns in NVT ensemble. After 400 ns, the 413 K simulation is well converged according to our criteria.
The probability of conformations and the free energy differences between the conformations were estimated with the direct counting method.28
Figure S2. Classical molecular dynamics simulation showed motion and conformations of the template molecule in
an aqueous solution. One N6-diphe6+ cation in a Charmm Force Field with 34647 H2O and 6 Cl- anions. (A movie showing the motion of the N6-diphe molecule in water and 6 Cl- anions is available as additional supporting information.)
26 Phillips, J. C.; Braun, R.; Wang, W.; Gumbart, J.; Tajkhorshid, E.; Villa, E.; Chipot, C.; Skeel, R. D.; Kalé, L.; Schulten, K. Journal of Computational Chemistry 2005, 26, 1781.
27 Vanommeslaeghe, K.; Hatcher, E.; Acharya, C.; Kundu, S.; Zhong, S.; Shim, J.; Darian, E.; Guvench, O.; Lopes, P.; Vorobyov, I.; Mackerell, A. D. Journal of Computational Chemistry 2010, 31, 671.
Figure S3. Structure of the N6-diphe6+ molecule and important distances.
Of special interest for the experiment are the lengths of the tails (d(N1-C1)) in the SDA (Figure S3). Whereas the head group is said to be attached to the silicate, the tails are free to move and might act as a buffer between the formed zeolite particles. Therefore, the different conformations of these tails were investigated computationally. The overall distribution of different tail length can be seen in Figure S4.
Figure S4. Distribution of probability (left) and relative free energy (right) at different N1-C1 distances at 413 K.
The tails are very flexible reaching N1-C1 distances from 4 to 40 Å. Values of 10 to 16 Å have the highest probability with 43% of all possible N1-C1 conformations. The minimum of free energy is at 12 to 14 Å. Examples for structures can be seen in Figure S5. At the energetically low conformations the chain interacts with itself, with the C1-C4 chain coiled around itself or the N-N1 chain.
Figure S5. Examples for three different N1-C1 distances at 413 K. Water molecules are omitted for clarity.
The N1-C1 distance can be separated in two parts (Figure S6): The distances C1-C4 and N1-N4 reach from 3 to 25 Å and have maxima at 15-19 Å with 42% as well as 6 Å with 2% probability. d(N1-N) is shorter with 6 to 17 Å and has one maximum at 10-13 Å with 55% and a smaller one at 15 Å with 4% probability. The conformations within one tail are not correlated with each other; this shows the high flexibility within the single tails.
Results from Dynamic Light Scattering
Table S2. DLS data for the synthesis of Nano-Betasol.: The evolution of a clear light yellow solution from aging (A) to the hydrothermal synthesis (HTS). (Data extracted from Figure S7)
T (°C) t (h) pH Particle-size (nm) A 20 0.5 10 9.6 A 20 24 10 8.1 HTS 140 24 + 6 10 14.1 HTS 140 24 + 12 10 10.1 HTS 140 24 + 24 10 8.6 HTS 140 24 + 36 11 26.4 HTS 140 24 + 48 11 20.7 HTS 140 24 + 72 10 28.4
Results from Small Angle X-ray Scattering and X-ray Diffraction
Figure S8. Experimental SAXS data and calculated intensities as obtained by fitting different models (see Table S3)
to data measured for Nano-Betasol during aging at room temperature and upon heating at 140°C. The curves of the samples with higher silicate content (Si/OH = 2 and 2.77) show some deviation of the fit from the measured data which could be caused by interference effects due to scattering from particles in close proximity. The curves are fitted with two models considering cylindrical core-shell particles (consecutive maxima and minima) and mulitlamellar paracrystals (Gaussian peak and high intensity at lower q). The ranges which are mainly affected by one of the two models are indicated by the sketched vesicles and the core-shell cylinders. The results from the fitting of the sum models are reported in Table S3.
Table S3. Results from SAXS data of sols for Nano-Betasol after mixing of all components and hydrolysis of TEOS at room temperature fitted with summed polyCoShCyl and LamParaCryst models.
Si/OH rc core [nm] Lc cylinder [nm] thS silica shell [nm] thL lamellae [nm] dL inter-lam. [nm] N6-diphe in core [%] 0.33 2.0 6.4 0.35 6.4 13.1 11 0.66 2.2 4.4 0.51 6.8 14.4 14 1.00 2.2 4.7 0.64 6.5 15.6 16 2.00 2.3 6.1 0.97 5.9 18.9 18 2.77 2.4 9.5 1.07 7.2 25.3 21
r = radius of the core of the core-shell cylinders, L = lengths of core-shell cylinders, thS = thickness of the silica shell in the core-shell cylinders, thL = thickness of the lamellae in lamellar paracrystals, dL = distance between adjacent lamellae in lamellar paracrystals, N6-diphe in core = maximum percentage of N6-diphe that can be accommodated in the cores of cylindrical core-shell particles (estimated by assuming all aluminosilicate to be located in the shells with given thickness and inner radius (= rc) which results in a maximum volume for the core that could be filled with N6 -diphe. Specific densities for the components were assumed as follows: silica 2.2 cm3.g-1, alumina as 3.95 cm3.g-1, organic core 0.8 cm3.g-1)
Figure S9. Experimental SAXS data and calculated intensities as obtained by fitting different models of the
Nano-Betasol sample obtained after 24 h at 140°C. The experimental curve can be fitted either with a model for a parallelepiped with dimensions of 4.7 x 4.7 x 14 nm (left) or with one for a cylinder with diameter of 5.2 nm and length of 9.5 nm (right). For both models a Gaussian peak must be considered in addition to the curve from the nanoparticles. The blue curve in the right figure shows the scattering of only the cylindrical particles, clearly indicating that a Gaussian peak must be considered which corresponds to a distance of about 8 nm. At low q values a third component adds to the scattering intensity, likely larger particles or aggregates consisting of smaller objects. A fourth component to the scattering curve is observed as a peak at a q = 0.5-0.6 Å-1, corresponding to the first broad reflection of crystalline zeolite Beta.
Figure S10. SAXS data evidence cubic geometry of objects observed in the reaction mixture for the synthesis of
Nano-Betagel prior to addition of TEOS. The pattern fits best to the Ia-3d symmetry, for all other cubic or hexagonal symmetries, some reflections cannot be indexed (arrows). The Ia-3d symmetry corresponds to that of the bi-continuous micellar system as observed during the formation of MCM-48 or KIT-6 silica (see inset).
a) b)
Figure S11. SAXS curves of Nano-Betagel after a) aging at 60°C for 1 h and b) after hydrothermal reaction for 7 d. The curve in a) is fitted with a summed polyCoShCyl and GaussPeak model and the curve in b) with a summed
CylPolyRadius and GaussPeak model.
Table S4. Results from SAXS data of Nano-Betagel after mixing of all components and hydrolysis of TEOS at 60°C for 1h fitted with summed polyCoShCyl and GaussPeak models (first two rows) and after hydrothermal synthesis at 140°C fitted with summed CylPolyRadius and GaussPeak models (third and fourth row).
Si/OH rc core [nm] Lc core [nm] thS silica shell [nm] dG Gauss peak [nm] N6-diphe in core [%] 0.27 2.2 16.2 1.55 5.07 25.9 Si/OH rc cylinder [nm] Lc cylinder [nm] - dG Gauss peak [nm] - 0.27 3.8 5.0 - 6.73 - a) b)
Figure S12. a) SAXS of the synthesis-gel of Nano-Betagel containing aluminum: gel before hydrothermal synthesis (red), and a sample after 1 h under hydrothermal synthesis conditions. b) At prolonged synthesis conditions (5 h red, 14 h blue and 7 days in green), crystalline zeolite Nano-Beta is observed in the low angle X-ray diffraction.
Figure S13. Evolution of diffusion coefficient of N6-diphe in synthesis medium of Nano-Betasol. (red) and colloidal zeolite Beta 17 (black) as measured by DOSY NMRat different hydrothermal treatment time.
Figure S14. Evolution of 27Al NMR spectra of synthesis medium of Nano-Betasol. at different hydrothermal treatment time.
0
5
10
15
20
25
0
50
100
150
200
t (h)
D (
µ
m
2/s)
SDA(OH)
6TEAOH
Figure S15. Evolution of 29Si NMR spectra of synthesis medium of Nano-Beta
sol. at different hydrothermal treatment time.
Narrowing
-75
-50
-25
0
25
50
75
100
125
150
175
ppm
6 h
1 h
7 d / 140°C
3 d
1 d
Figure S16. Evolution of solid-state 27Al MAS NMR spectra of recovered solids from the synthesis of Nano-Beta gel. at different hydrothermal treatment time.
Figure S17. Evolution of solid-state 13C{1H} MAS NMR spectra of recovered solids from the synthesis of Nano-Betagel. at different hydrothermal treatment time: a) direct polarization; b) cross-polarization.
-40 0 40 80 120 160 ppm
6 h
1 h
7 d / 140°C
3 d
1 d
-40 0 40 80 120 160 ppmOrdered aromatics
a)
b)
Figure S18. Comparison between direct polarization and cross-polarization 29Si{1H} MAS NMR spectra of as-synthesized Nano-Betagel. at 140°C for 3 days.
CPMAS
hpDec
-130
-120
-110
-100
-90
-80
-70
ppm
Figure S19. Experimental and simulated 27Al 3QMAS spectra of as-synthesized Nano-Betasol. at 140°C for 22 days.
δ!=!54.1!ppm!
C
Q!=!2.79!MHz!
η =!0.36!
calculated!
Experimental!
two!components!
30
40
50
60
70
ppm
30
40
50
60
70
ppm
δ!=!56.9!ppm!
C
Q!=!2.53!MHz!
η =!0.40!
Figure S20. Synthesis of zeolite Beta crystallites from core-shell cylinders with inorganic shells. After formation of
the zeolite, the crystallites are terminated by a hydrophobic coating. Spinodal decomposition-like mechanism results in two bi-continuous phases, i.e., an aqueous phase and an organic phase containing the zeolite. The boundary between the two phases can be stabilized by the amphiphilic SDA molecules. Evaporation of water causes the larger mesopores and decomposition of the organic phase via calcination causes aggregation of the zeolite nanoparticles by which smaller mesopores are formed as voids between particles.