Landslides (2007) 4:149–162 DOI 10.1007/s10346-006-0072-x Received: 9 May 2006 Accepted: 6 December 2006 Published online: 26 January 2007 © Springer-Verlag 2007
Herfried Madritsch . Bernard M. J. Millen
Hydrogeologic evidence for a continuous basal shear zone
within a deep-seated gravitational slope deformation
(Eastern Alps, Tyrol, Austria)
Abstract The currently inactive deep-seated gravitational slope deformation (DGSD) Sagspitz in Tyrol, Austria, covers an area of 3 km2 and originated along a glacially over-steepened slope composed mainly of phyllites belonging to the Innsbruck Quartzphyllite Complex. Past mass movement processes caused the formation of fracture systems and slump bodies which consequently form the aquifers of relatively large springs in a rock type with generally very low permeability and poor porosity. Analysis of water chemistry, oxygen isotope, and field parameters of the springs emerging from the DGSD imply that multilevel aquifers exist and enabled the detection of continuous deep flow paths through the entire length of the mass movement from the main scarp to the toe of the slope. It is shown that the aquifer boundaries and spring emergences throughout the loosened rock mass can be correlated to the internal and basal shear zones of the DGSD so that this hydrogeological approach proved to be useful for evaluating the mass movement structure.
Keywords Deep-seated gravitational slope deformation . Oxygen isotope . Hydrogeology . Basal shear zones . Tyrol . Austria Introduction
Deep-seated gravitational slope deformations (DGSDs) have been described and investigated in regional and case studies throughout the Eastern Alps (Ampferer1939; Stini1941; Clar and Weiss1965; Zischinsky1969b; Moser1994; Crosta1996; Hermann and Becker 2000; Reitner2000; Weidner2000; Agliardi et al.2001), and they most commonly occur along deep glacial valleys in foliated rocks. Their initiation is thought to have taken place after the Late to the Postglacial retreat of the alpine valley glaciers that left behind instable over-steepened slopes (Reitner et al.1993) and are usually accompanied with the gravitational reactivation of preexisting tectonic discontinuities. DGSDs commonly affect whole mountain slopes and have a typical morphology resulting from the gravitational sagging and spreading of the rock masses.
The deformation mechanism of DGSDs is commonly referred to as creep (Radbruch-Hall 1978; Hutchinson 1988) and is characterized by slow to extremely slow deformation rates (Cruden and Varnes 1996). This deformation process is often combined with partial sliding and stick–slip processes (Moser and Glumac 1983; Weidner 2000) resulting in a typical dis-continuous deformation behaviour with deformation rates rang-ing between 0.3 and 700 cm/year (Moser1996). The existence of continuous penetrating basal shear zones in DGSDs is still a matter of ongoing scientific debate (Noverraz 1996). Recent
studies mainly focus on their detection by using geophysical methods (Ferrucci et al.2000; Brückl and Brückl2006); however, these investigations commonly do not extend over the whole length of the DGSD.
DGSDs are a common feature in the Tuxer Alps southeast of Innsbruck (Gruber2005). Along the eastern slopes of the Watten Valley, a 20-km long, north–south striking valley branching off the Inn Valley, several DGSDs were detected (Madritsch2004) that not only negatively affect human infrastructure but also contain aquifers for a number of springs that constitute the local water supplies (Fig.1). The latter circumstance and the fact that DGSDs in the wider region are rarely well documented or have been investigated mainly from a geologic–geomorphologic point of view (Poscher 1990; Grasbon 2001; Gruber 2005) encouraged a hydrogeologic approach. The DGSD Sagspitz was chosen as a case site for the present study and revealed the usefulness of hydrogeological methods in the examination of the subsurface structures in DGSDs.
Geologic setting
The study area lies within the Lower Austroalpine Innsbruck Quartzphyllite Complex (Fig.1). It is a monotonous succession of low-grade metamorphic Paleozoic sediments that was long treated as an undifferentiated rock mass until a rough division was established by Haditsch and Mostler (1982) and later enhanced by Rockenschaub et al. (2003).
The Innsbruck Quarzpyllite Complex comprises the lowermost Ordovician quartzphyllite–greenschist series, the calcareous and dolomitic marble bearing a carbonate–sericite–phyllite series and the youngest blackschist–carbonate series of the Upper Silurian to Devonian age, including graphitic schists and calcareous marbles (Fig.2). Parts of the Innsbruck Quartzphyllite Complex in the study area consist of mylonitic quartzites and garnet-bearing mica schists. These rocks are supposed to be part of a diaphtoritic higher metamorphic zone of the Innsbruck Quarzphyllite Complex (Rockenschaub et al.2003).
The Innsbruck Quartzphyllite Complex has witnessed the Variscian and Alpine orogenies. It, therefore, shows an intense and polyphase ductile deformation resulting in a penetrating foliation and several fold generations (Kolenprat et al.1999). In contrast to the southern part of the Innsbruck Quartzphyllite Complex, an overprinting axial plane foliation in the study area can only be observed in thin sections.
The brittle deformation of the Innsbruck Quartzphyllite Com-plex probably did not onset before Miocene times as indicated by
Original Article
its thermo-tectonic history (Fügenschuh et al. 1997) and was mainly controlled by the bordering major Alpine faults, namely the Inn Valley Shear Zone (Ortner2003) to the north, the Northern Tauern Margin Fault System (Decker et al.2003) to the south, and the Brenner Normal Fault (Selverstone1988) to the west (Fig.1).
The studied slope consists mainly of quartz– and sericite– phyllites (Fig. 3). Within this rock mass, intercalations of greenschist, gneiss, calcareous, and dolomitic marble are present (Fig.4a). The intercalations are 1–10 m thick and cannot be traced for distances of more than 50–100 m due to ductile boudinage. White, coarse crystalline, calcareous marbles can be mapped to a larger extent at the scarp of the mass movement where they form the Sagspitz summit (2,410 m a.s.l.).
The phyllites are characterized by a penetrative foliation containing intrafolial isoclinal folds. Thin sections show that the foliation is formed by layers of phyllosilicates (muscovite, chlorite) and quartz (Fig.4b). These phyllites are rheologically incompetent rocks (Fürlinger1972) with wide joint spacing. The intercalations of greenschists, marbles, and gneisses react more competently and
show more closely spaced brittle structures; in these rocks, the foliation is poorly developed.
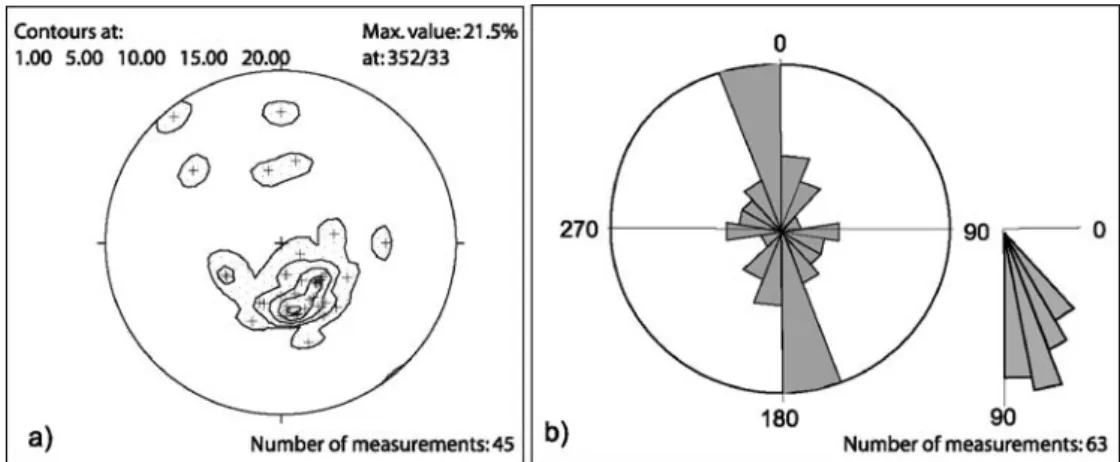
The penetrative foliation of the phyllites dips gently towards NW, nearly parallel to the slope (Fig.5a), and is assumed to form the main sliding surfaces within the rock mass.
The most commonly observed brittle structures in the study area are E–W to NE–SW, striking sinistral strike–slip faults that are related to the Inn Valley Shear Zone (Ortner 2003) and the Northern Tauern Margin Fault System (Decker et al.2003). N–S striking normal faults are related to the Sill Valley Fault, which is a brittle continuation of the ductile Brenner Normal Fault (Fügenschuh et al. 1997). These faults that strike parallel to the Watten Valley and the slope ridge were gravitationally reactivated during mass movement activity and represent the present day major joint and fracture orientation (Fig.5b).
Materials and methods
The eastern slope of the Watten Valley was geologically and geomorphologically mapped at a scale of 1:10,000 with special Fig. 1 Geologic setting of the study area (framed by yellow square): Tectonic units
(modified after Brandner 1980): 1; Central Gneiss, Penninic, 2; Bündner Schist, Penninic, 3; Innsbruck Quarztphyllite Complex, Lower Austroalpine, 4; Patscherkofel crystalline, Lower Austroalpine, 5; Tarntal Mesozoic, Lower Austroalpine, 6; Ötztal crystalline, Middle Austroalpine (after Tollmann1977), 7; Brenner Mesozoic, Middle
Austroalpine (after Tollmann 1977), 8; Kellerjoch Gneiss, Upper Austroalpine, 9; Northern Calcareous Alps, Upper Austroalpine, 10; Quaternary. Also shown are DGSD affected areas along the eastern slope of the Watten Valley as mapped by Madritsch (2004), as well as the locations of the rain gauges Kleinvolderberg and Wattener Lizum and of the springs s6 and s15 that were used to calculate the local altitude effect
emphasis being given to the structural geology and signs of relict and active gravitational movements. In addition, aerial photo-graphs (Forest Inventory Survey recorded in 1953; approximate scale of 1:20,000; source: Regional Government Tyrol) as well as orthophotographs (recorded in 2000 at a scale of 1:5,000; source: Regional Government Tyrol; elevation model: BEV) were exam-ined. Among several DGSDs detected along the eastern slopes of the valley (Madritsch 2004), the DGSD Sagspitz was chosen for detailed hydrogeologic investigation.
Out of over 150 mapped springs along the valley slope, 13 springs emerging from the DGSD Sagspitz were selected to be monitored (electrical conductivity, temperature, discharge) intensively for a time period of 1 year at monthly intervals. Springs s6 and s15 do not directly emerge from the mass movement but were also monitored for use as reference springs for the mean recharge altitude calculation of the spring waters. Water samples forδ18O analysis were taken monthly, and every 3 months, a chemical analysis of the spring waters was carried out. Aδ18O analysis was also carried out on samples of precipitation obtained monthly from two gauges at Wattener Lizum and Kleinvolderberg (Fig.1).
The electrical conductivity (reference, 25°C) and water temper-ature were measured in the field using a multifunctional probe (WTW LF 330). Discharge measurements were done manually using the stop watch and bucket method. Depending on the discharge rate,
1-, 3-, 10-, or 20-l buckets were used. Most major and minor chemical constituents of the water samples were measured using an ion chromatography system (Dionex DX 500 with autosampler AS40). NH4and NO2were determined by a flow injection system (Skalar SA4000 with Autosampler SA1050). Fe and Mn measurements were done with a Perkin Elmer Optima 3000 ICP. The analytical accuracies of these methods ranged from 2 to 5%. A Finnigan DeltaplusXL mass spectrometer was used for the δ18O analysis, and the values are reported inδ‰ units versus the Vienna Standard Mean Ocean Water (VSMOW) accuracies being ±0.1‰.
Mass movement characterisation
The DGSD Sagspitz, covering an area of approximately 3 km2, encompasses the entire slope from the ridge (Sagspitz summit at 2,410 m a.s.l.) to the valley floor (Fig. 3). The difference in elevation from the main scarp to the toe of the slope sums up to 1,100 m.
The DGSD Sagspitz is characterized by a geomorphologic appearance typical for mass movements of its kind (Hutchinson 1988; Moser1994; Crosta1996; Weidner2000; Agliardi et al.2001) and can be roughly divided into three major zones: (1) the double crested ridge zone (“Bergzerreissung”; Ampferer1939; Zischinsky 1969b) in the uppermost part comprising the main scarp; (2) the sagging zone (Zischinsky1969a) in the central part; (3) and the toe of slope (Bergzerreissung; Clar and Weiss1965; Zischinsky1969b) in the lowermost part.
Different types of gravitational rock deformation (Poisel1998) are predominant in these zones, respectively. At the top of the mass movement, a double-crested ridge with wide N–S striking tension joints is developed (Fig.6a). Here, toppling processes predominate over sagging. The sagging zone below is characterized by several generations of smaller scale scarps and counterscarps (Fig.6b) and shows a rather gentle dip of slope (10–20°). In this zone, the rock is locally intensively fractured. The toe of the slope is steep (inclination, >30°) and affected by secondary shallow landslides. The rock mass at the surface is strongly fractured to completely loosened (development of debris-like deposits). Moser and Glumac (1983) suggested that a sliding component in this part of a DGSD is most likely. In profile view, the DGSD Sagspitz reveals a concave morphology in its upper part and a convex morphology in its lower part which is typical for DGSDs at a progressed stage of devel-opment (Zischinsky1969a,b; Hermann and Becker2000).
The glacial erosion of the Watten Valley, the resulting high relief energy, and the pre-existing structural features in the Innsbruck Quartzphyllite Complex (penetrative foliation of the phyllites dipping parallel to slope, brittle faults striking parallel to the valley) set the framework for the formation of the DGSD Sagspitz.
No direct age constraints are available to date the initiation of the DGSD Sagspitz. However, geomorphic observation throughout the Watten Valley (Madritsch2004) and neighbouring areas within the Tuxer Alps (Gruber2005) have shown that, at higher elevations of between 2,100 and 2,400 m a.s.l., moraines of Lateglacial age (Daun to Egesen stage, Patzelt1983) overlay DGSD related scarps. Furthermore, relict rock glaciers that are supposed to have formed Fig. 2 Lithostratigraphic chart of the Innsbruck Quartzphyllite Complex (modified
after Haditsch and Mostler 1982 and Rockenschaub et al. 2003). Note the intercalations of gneisses, greenschists, marbles, and blackschists in the phyllitic rock mass. (1 sericite–quartzphyllites, 2 greenschists, partly calcareous, 3 porphyric and arenitic gneisses, 4 calcareous and dolomitic marbles, 5 calcareous black schists)
at least 11,000 years ago (Barsch1997) were obviously fed by the main scarps of preexisting DGSDs. This points towards an onset of DGSD activity in the Tuxer Alps already during Late glacial times
(before 11,000 years), most probably due to the retreat of alpine valley glaciers that left behind over steepened slopes (Reitner et al. 1993). During the Holocene, at least parts of the DGSDs (secondary Fig. 3 Geomorphic–hydrogeologic map of the DGSD Sagspitz (for location, refer
to Fig.1). The DGSD comprises the whole slope. The main scarp of the mass movement is located at the ridge of the slope where marbles and greenschists are intercalated in the phyllitic rock mass. Note that the rock is widely fractured to completely loosened at surface especially at the toe of the slope were it has a
debris like character. Also shown are the monitored springs with their according signatures (see Table1) and the spring district allocation (coordinates given in UTM32N). Springs s6 and s15 do not directly emerge from the DGSD Sagspitz but are located 500 m to the south of s4 and 4 km to the south of s13, respectively (see Fig.1)
sagging bodies) were reactivated as evidenced by open-tension cracks and the geomorphic overprint of late glacial moraines by scarps at lower elevations (below 2,100 m a.s.l.). The above-listed observations apply to the DGSD Sagspitz as well. Its recent activity is restricted to secondary sagging bodies that were mapped at the toe of slope and in the sagging zone.
Spring hydrogeology Field measurements
The monitored springs show mean discharges between 0.2 l/s (s14) and 12 l/s (s9). The mean water temperature lies between 3.5°C (s4) and 6.1°C (s15), and the mean electrical conductivity varies between 15μS/cm (s6) and 232 μS/cm (s3; Table1). These values are typical for springs emerging from the Innsbruck Quartzphyllite Complex (Burger et al.2003; Millen et al.2003).
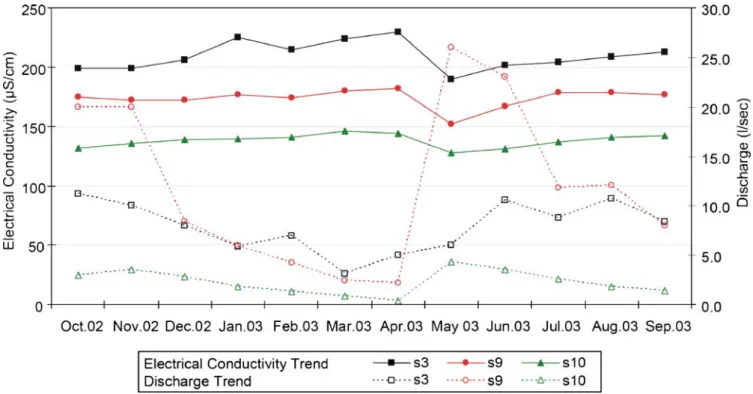
All field parameters exhibit annual variations with the temperature fluctuations of most springs generally following those of the air temperature. However, s1 hardly has temperature fluctuations indicating substantial mixing and/or retention in the aquifer and a deeper flow system. Discharge in all springs rises abruptly during spring and early summer. This increase is generally accompanied with a decrease in electrical conductivity
(Fig.7) and is interpreted as the effect of snowmelt in the aquifer systems. Springs s4, s5, and s6 discharge periodically (falling dry during the winter months), an indication that the aquifers are small and shallow, and/or freeze.
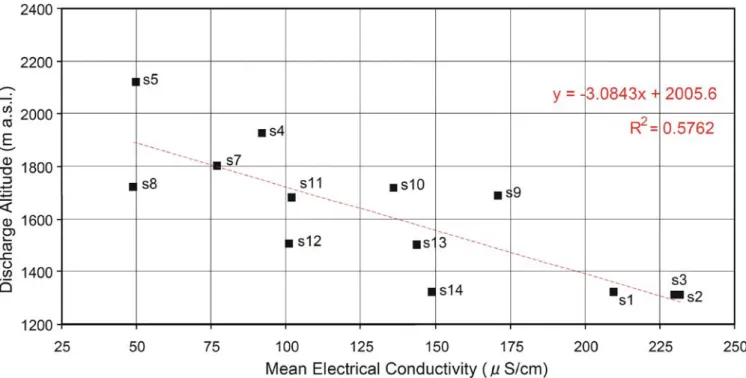
The electrical conductivity varies disproportionably with dis-charge and corresponds with the disdis-charge altitude of the springs (Fig.8). Differences in mineralization are due to retention times and/or local variations in aquifer lithology. Therefore, the electrical conductivity alone cannot be used for interpreting the size of the aquifer system.
Hydrochemistry
Springs emerging from the Innsbruck Quartzphyllite Complex generally show a low degree of mineralization (Burger et al.2003; Millen et al.2003), and the water samples analysed in this study do not deviate from this observation (Tables1and2, Fig.8).
Most of the observed springs can be classified as Ca–HCO3and/ or Ca–Mg–HCO3 water types (major cations and anions in descending order where %meq/l concentrations are >20%), the exception being springs s1, s2, and s3 which have a Ca–Mg–HCO3– SO4type. Springs s1, s2, and s3 emerge at the toe of the slope and also have the highest mineralization.
Fig. 4 Lithological properties of the Innsbruck Quartzphyllite Complex: a intercalations of competent greenschists in the incompetent phyllitic rock mass and b thin section of a typical quartzphyllite illustrating the alternation of quartz and muscovite rich layers that forms the penetrative foliation
Fig. 5 Structural data: a stereographic representation of foliation measure-ments that shows a consistent gentle dip of the foliation towards NW (equal area lower, hemisphere projection, contoured pi-pole plot with pi-poles displayed as crosses) and b rose diagram showing that the majority of joints throughout the investigated area strike NNW–SSE and are steeply dip-ping (bars show strike directions at azimuth intervals of 20°)
The probable sources of the SO4concentrations are sulphide minerals (e.g. pyrite), which are common throughout all the series of the Innsbruck Quartzphyllite Complex (Mostler et al. 1982). Sulphate minerals have not been recorded in the study area and there is no 1:1 molar correlation between dissolved Ca and SO4; this indicates that sulphide oxidation is dominant in the aquifer systems (e.g. Kilchmann et al.2004).
The Ca, Mg, and HCO3 constituents of the spring waters are indicative of the dissolution of carbonate minerals promoted by CO2uptake, which occurs commonly in the aquifers throughout the study area in the form of calcareous and dolomitic marble bodies and vein fillings. The very low contents of Na and K imply that substantial hydrolysis of the ubiquitous silicate phases (e.g. feldspars, micas) is not occurring.
δ18
O analysis
The analysis of δ18O is commonly used to investigate the mean recharge areas of springs and has often been applied in alpine environments. Three methods to determine mean recharge altitude exist: (1) based onδ18O values obtained from precipitation gauges (pluviometers) at varying altitudes; (2) based on δ18O values obtained from“reference” springs with well-defined recharge areas at varying altitudes; (3) combination of methods 1 and 2 (Vogel et al.1975; Rank et al.1982; Stichler and Zojer1986; Schotterer et al. 2000; Millen2001; Yehdegho and Reichl2002).
The method makes use of the fact that during the transformation of atmospheric water vapour to precipitation, which then infiltrates and becomes groundwater, fractionation processes between the heavier18O and the lighter16O isotope within the water molecules occur (Dansgaard1964; Ehalt and Knott1965). During condensation, the heavier18O is enriched relative to the16O in precipitation whilst becoming depleted in the remaining vapour.
It has been observed that the isotopic composition of precipi-tation changes with the altitude of the terrain and becomes more and more depleted in18O at higher altitudes. This relation is known as the altitude effect (for review, see Mook 2000). The altitude effect is temperature related and is, furthermore, influenced by the rainout effect. Rain clouds that continuously collide with mountain chains and condensate are continuously depleted in the heavier 18O. Therefore, rains falling at higher altitudes further up the mountain are derived from an already 18O-depleted source and have lowerδ18O values. Depending on the precipitation source, transport distances, and the local topography, i.e. weather divides, δ18O values vary greatly throughout the Alps (Humer et al.1995; Schotterer et al.2000; Kaiser et al.2002; Kralik et al.2003). These circumstances require the calculation of the local altitude effect within the survey area.
In this study, the calculation of the altitude effect was carried out firstly using only reference springs. In a second step, two precipitation gauges were considered as well. The precipitation gauge Kleinvolderberg (660 m a.s.l.) lies 9 km northwest of the study area within the Inn Valley; the gauge Wattener Lizum (1970 m a.s.l.) is 7 km to the south (Fig.1).δ18O values have been derived from monthly mixed samples of precipitation and have been weighted against the amount of monthly rainfall to obtain the annual mean weightedδ18O value (Table3). Note the maximum of the δ18O values during summer and, accordingly, the minimum δ18O values during winter; this is known as the seasonal effect (Epstein1956; Dansgaard1964).
For the reference spring method, the selected springs need to have a well-definable small recharge area, determined from geomorphologic and hydrogeologic mapping, hydrochemistry, and the spring characteristics (e.g. low discharge and mineralization Fig. 6 Morphologic features of the DGSD Sagspitz: a double-crested ridge at the
top of the slope (2,400 m a.s.l.) featuring large and wide open tension joints. People ringed for scale. b Scarps and counterscarps in the sagging zone at around 1,700 m a.s.l. Both morpho-structural features function as potential infiltration zones
that indicate a small local aquifer) so that their mean recharge altitude can be appropriately estimated (Millen2001; Yehdegho and Reichl2002). Springs s5, s6, and s15 (Tables1,2, and4) were selected as references, as they fitted the above criteria well.
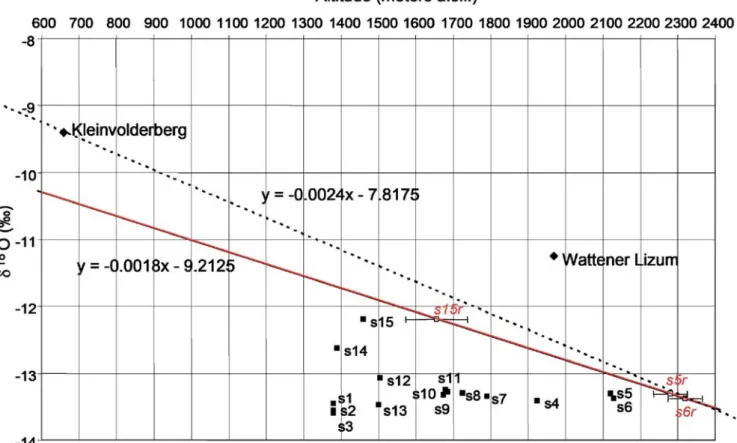
The mean δ18O values and determined recharge altitudes of the reference springs were then used to construct a regression line revealing the relationship between δ18O value and altitude (Fig. 9). The resulting gradient of 0.18‰/100 m corresponds well with typical values from the Alps determined from
precipitation or combined methods (Schotterer et al. 2000; Kralik et al. 2003).
In a second step, the weighted mean δ18O values of the precipitation were plotted against the altitude of the gauges into Fig.9. A second regression line was then constructed considering the values obtained from the Kleinvolderberg gauge (Fig.10) and the well defined reference springs s5 and s6, resulting in a slightly higher local altitude effect of 0.24‰/100 m. To be noted here is the totally erroneous position of the Wattener Lizum gauge in this plot
Fig. 7 Spring discharge versus electrical conductivity. An increase in discharge is accompanied with an immediate to delayed drop in electrical conductivity. This drop is interpreted as the effect of snow melt infiltrating into the aquifer systems
Table 1 Mean, minimum, and maximum values of the field parameters of the monitored springs
Spring Discharge altitude
(m a.s.l.) n
Water temperature (°C) Electrical conductivity (S/cm) Discharge (l/s)
Min. Mean Max. Min. Mean Max. Min. Mean Max.
s1 1,320 12 4.9 5.1 5.2 190 210 230 3.1 7.9 11.2 s2 1,310 12 4.8 5.0 5.5 221 230 244 0.9 5.5 9.0 s3 1,310 12 4.5 5.0 5.2 227 232 242 not measurable s4 1,925 4 dry/2.7 3.5 4.2 dry/90 92 94 0.0 0.5 1.2 s5 2,120 8 dry/3.1 4.0 4.8 dry/36 50 56 0.0 0.5 1.2 s6 2,130 8 dry/2.7 3.7 4.4 dry/8 15 19 0.0 0.8 2.5 s7 1,800 12 3.8 4.1 4.4 61 77 87 1.5 5.5 13.1 s8 1,720 12 3.6 4.1 4.9 44 50 58 0.5 2.2 4.2 s9 1,685 12 3.6 3.9 4.2 152 174 182 2.2 12.0 26.0 s10 1,715 12 2.4 3.9 4.8 128 138 146 0.4 2.3 4.3 s11 1,680 12 3.4 3.7 4.0 93 102 135 0.3 1.5 3.3 s12 1,505 12 4.9 5.9 7.4 90 101 114 0.2 0.7 3.0 s13 1,500 12 3.7 4.4 4.6 138 144 153 0.9 5.9 10.3 s14 1,320 12 4.4 5.5 6.9 143 149 158 0.1 0.2 1.0 s15 1,460 12 1.4 6.1 11.1 48 53 57 0.2 0.3 0.5
(Fig. 10). The highδ18O value could be due to a problem with correct snow amount measurements in winter (less snow registered than actually fallen) or due to the influence of Mediterranean precipitation in the area of this collector that is generally characterized by higher values than those derived from the Northern Atlantic and the North Sea (Kaiser et al.2002; Kralik et al.2003). These circumstances make the Wattener Lizum gauge inappropriate for recharge altitude calculation purposes.
The mean recharge altitudes of the springs (Table 4) were determined by extrapolating their discharge altitude onto the regression lines in Figs.9and10. The calculated error of ±150 m for this method is based on the uncertainty of the assumed mean
recharge altitude of the reference springs that is in agreement with the study of Yehdegho and Reichl (2002).
Furthermore, the horizontal distance to the regression line gives a good indication about the relative size of the spring aquifer and depth of flow, i.e. the further away the spring plots to the left of the regression line, the larger the aquifer and greater depth of flow. This implies that the springs s1, s2, and s3 have large aquifers and greater depth of flow in comparison to s9, s10, and s11.
The annual trend of the δ18O values obtained from spring water can also be used to reveal information on the retention potential of an aquifer (Stichler and Hermann 1983). Spring
Table 2 Mean value of major anions and cations of water samples in mg/l (n = number of samples)
Spring n Na (mg/l) K (mg/l) Ca (mg/l) Mg (mg/l) Cl (mg/l) HCO3(mg/l) SO4(mg/l) NO3(mg/l) s1 4 1.1 0.8 31.6 7.9 0.2 109.0 22.9 1.0 s2 4 1.2 0.9 32.5 9.3 0.2 114.4 27.2 0.9 s3 4 1.3 1.0 32.3 10.0 0.2 116.0 29.3 0.8 s4 1 0.5 0.6 20.9 1.0 0.2 67.4 3.5 0.8 s5 3 0.4 0.3 8.6 1.3 0.1 28.0 3.7 0.7 s6 3 0.5 0.1 2.8 0.5 0.1 11.8 1.8 0.5 s7 4 0.9 1.2 13.6 1.9 0.2 46.7 4.2 0.8 s8 4 0.7 0.4 11.1 1.4 0.3 34.1 3.5 0.8 s9 4 0.8 0.7 29.2 4.2 0.3 88.1 17.1 1.4 s10 4 0.7 0.4 26.8 4.0 0.2 86.0 12.4 1.1 s11 4 0.6 0.9 20.1 1.3 0.2 61.3 5.3 1.2 s12 4 0.8 0.8 20.4 1.3 0.5 62.9 4.8 1.5 s13 4 0.9 0.6 23.3 5.0 0.1 78.2 14.6 0.8 s14 4 0.9 0.6 26.8 3.3 0.3 83.9 11.9 2.2 s15 3 0.8 0.4 9.8 1.9 0.3 32.3 4.9 2.4
The values of F, Fe, Mn, ammonium, phosphate, and nitrite are all <0.03 mg/l or below the detection limit and are, therefore, not shown
Fig. 8 Linear relation trend of electrical conductivity and discharge altitude. Deviations are probably due to local variations in aquifer lithology and hence water chemistry and/or longer retention times
waters with longer retention times have a δ18O trend with little variation, whereas those with short retention times show larger fluctuations. In this case, the reference springs s5, s6, and s15 have a shorter retention time than the rest of the springs, also an indirect indication of their small local aquifers (Table 4; see deviation from mean).
Snowmelt water plays an important role in the recharging of the aquifers in the study area. It has a significantly lowerδ18O value than summer precipitation and can, therefore, be used as a natural tracer. Figure 11shows that a decrease inδ18O is mirrored by an increase in discharge, which can be related to snowmelt water
infiltration into the aquifer system. This further shows that some aquifers have rather poor retention properties, allowing little time for groundwater mixing to occur. Such springs also generally have a lower mineralization. Some of the springs (s1, s2, and s3), however, do not show this relation. In fact, theδ18O value increases with the rising discharge. At these springs, the increased discharge does not consist of snowmelt but of well-mixed groundwater were theδ18O signature has been diffused due to a longer retention time. These springs also have the most chemically developed water in the study area (Table2).
Table 4 Results ofδ18O measurements (mean, maximum, and minimum values) and mean recharge altitude calculation based on mean δ18O values from the reference springs only (0.18‰‰/100 m) and combined method using reference
springs and the precipitation gauge Kleinvolderberg (0.24‰/100 m; n=number of measurements)
Spring Mean
δ18O (‰) Maximumδ18O (‰) Minimumδ18O (‰) Deviationfrom mean n Dischargealtitude
(m a.s.l.) Mean recharge altitude (m a.s.l) (0.18‰/100 m) Mean recharge altitude (m a.s.l) (0.24‰/100 m) s1 −13.46 −13.24 −13.55 0.05 12 1,380 2,360 2,350 s2 −13.57 −13.45 −13.65 0.04 12 1,380 2,420 2,400 s3 −13.60 −13.50 −13.69 0.05 12 1,380 2,440 2,410 s4 −13.42 −13.34 −13.59 0.08 4 1,925 2,340 2,335 s5 −13.31 −12.99 −13.59 0.19 8 2,120 2,280 2,290 s6 −13.38 −12.82 −13.94 0.33 8 2,130 2,320 2,320 s7 −13.35 −13.26 −13.42 0.04 12 1,790 2,300 2,305 s8 −13.30 −13.11 −13.44 0.08 12 1,725 2,275 2,285 s9 −13.33 −13.07 −13.46 0.06 12 1,675 2,290 2,300 s10 −13.28 −13.03 −13.48 0.08 12 1,685 2,260 2,275 s11 −13.25 −13.20 −13.31 0.02 12 1,680 2,245 2,265 s12 −13.07 −12.90 −13.18 0.06 12 1,505 2,145 2,190 s13 −13.48 −13.38 −13.58 0.04 12 1,500 2,370 2,360 s14 −12.63 −12.48 −12.71 0.04 12 1,390 1,900 2,005 s15 −12.19 −11.98 −12.33 0.10 12 1,460 1,655 1,820
Table 3 Results ofδ18O analysis of the monthly precipitation from the Kleinvolderberg and Wattener Lizum precipitation gauges (location of the gauges is given in UTM32N coordinates)
Gauge Kleinvolderberg Watterner Lizum
X/Y coordinates 692209/5238653 700136/5227592
Altitude 660 m a.s.l. 1,970 m a.s.l.
Annual precipitation 802 mm 1,200 mm
Month Monthly precipitation
sum (mm) δ18O (‰) Monthly precipitation sum (mm) δ18O (‰) Oct. 02 59.4 −10.27 92.8 −10.57 Nov. 02 103.7 −13.41 154.7 −13.58 Dec. 02 43.8 −16.33 53.7 −17.86 Jan. 03 46.6 −19.08 67.0 −21.61 Feb. 03 21.3 −19.22 60.8 −22.10 Mar. 03 25.2 −11.98 38.6 −15.65 Apr. 03 58.5 −12.58 85.2 −15.69 May. 03 69.9 −5.90 140.5 −7.61 Jun.03 109.1 −4.57 131.3 −4.17 Jul. 03 147.4 −5.68 198.7 −7.90 Aug. 03 79.6 −5.78 100.0 −7.00 Sep. 03 37.5 −7.46 75.7 −11.05 Mean −11.02 −12.90 Weighted mean −9.40 −11.25
The annual mean weightedδ18O values have been used in the mean recharge altitude calculation. Precipitation sums were obtained from Bundesministerium fuer Land-und Forstwirtschaft, Umwelt-und Wasserwirtschaft (2005,2006).
Differentiation of spring districts
Based on geomorphologic and hydrogeologic mapping, field parameter trends, hydrochemistry, and δ18O values, four spring districts can be distinguished within the DGSD Sagspitz (Fig.3).
Springs of district 1 (s5, s6) are located at an altitude of approximately 2,100 m a.s.l. and are characterized by a periodic discharge with a maximum during spring and zero discharge during winter. δ18O values (maximum of −12.82‰ to a minimum of −13.94‰VSMOW), electrical conductivity (minimum of 8 μS/cm to a maximum 56 μS/cm), as well as water temperature show large annual variations, and their waters are of low mineralization. Such factors are indicative of short retention times and small shallow aquifers. The springs emerge from talus, completely disintegrated quartzphyllite due to sagging, or from glacial sediments.
Springs of district 2 (s4, s7, s8) emerge between 1,700–1,900 m a.s.l. They have a continuous discharge and low electrical conduc-tivity (minimum of 50μS/cm to a maximum of 94 μS/cm). The results of theδ18O analysis (maximum of−13.11‰ to a minimum of −13.59‰VSMOW) indicate that in comparison to the springs of district 1, these springs have larger aquifers and deeper flow paths, i.e. the vertical difference between the calculated mean recharge area and discharge area lies between 400 and 600 m.
Springs of similar characteristics can also be found at the toe of a slope (s14).
Spring district 3 (s9, s10, s11) encompasses springs with a more stable annual discharge trend that is less affected by precipitation events. These springs have a higher mean mineralization (102 to 174 μS/cm) in comparison to districts 1 and 2. The vertical difference between the calculated mean recharge area and discharge area lies around 600 m.
Springs of district 4 (s1, s2, s3, s13) all emerge at the toe of the mass movement. They have a relatively high and stable mean water temperature (4.4 to 5.1°C); the mean flow rates are relatively large (5.5 to 7.9 l/s), and the mean electrical conductivity is >144μS/cm. Especially springs 1 to 3 have the highest mean values of electrical conductivity (>210μS/cm) and have comparatively well-developed waters (Ca–Mg–HCO3–SO4water type) which are an indication of longer retention times. The springs of district 4 also have the most stableδ18O values (Table4; see deviation from mean) and water temperature trends, this implying a large and well mixed source. Most important, however, are the results of theδ18O calculations that indicate that these springs have the highest mean recharge altitude and greatest vertical distance between the recharge and discharge areas (800–1,000 m). Further, the recharge area Fig. 9 δ18O regression line showing the calculated local altitude effect
(0.18‰/100 m) using reference springs only: The closed squares indicate the meanδ18O value versus the discharge altitude of the springs. The open squares (s5r, s6r, and s15r) represent the determined mean recharge altitude and mean δ18O value of the reference springs. Uncertainties concerning the mean recharge
altitudes are shown by the error bars. The mean recharge altitude can be determined by projecting the squares horizontally onto the regression line and then vertically onto the altitude axis. Furthermore, the horizontal distance of the springs to the regression line gives an indication of the size of the aquifer and depth of flow
corresponds with the double crested ridge area of the DGSD that contains many outcrops of highly fractured marbles—a perfect lithology for allowing rapid and deep(?) infiltration of precipitation into the DGSD.
Conclusions
The Innsbruck Quartzphyllite Complex within the area of the DGSD Sagspitz contains a large number of small- to medium-sized springs (mean values, 0.2 to 12 l/s). The aquifer systems can be
Fig. 11 Relationship betweenδ18O value and discharge trend:δ18O of s1 increases with discharge increase;δ18O of s8 decreases with discharge increase (refer to text for explanation)
Fig. 10 δ18O regression lines showing the calculated local altitude effect using reference springs (0.18‰/100 m) and the precipitation gauge Kleinvolderberg (0.24‰/100 m) compared to Fig.9. Note the totally erroneous position that the
Wattener Lizum gauge has in this plot making it unsuitable for use in the recharge altitude calculations (see text for further discussion)
directly related to the deep-seated slope deformation that caused intense fracturing of the rock and the development of secondary permeability and porosity.
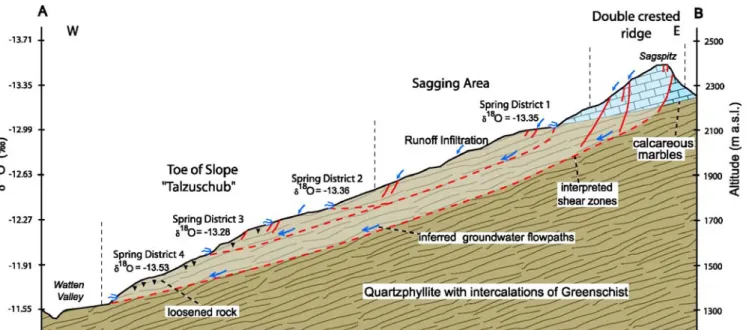
The hydrochemistry and calculated mean recharge altitudes of springs (δ18O analysis) emerging from the Sagspitz DGSD imply that the waters emerging at the toe of the slope (district 4) infiltrate at the main scarp of the mass movement. This observation supports the hypothesis of the existence of continuous flow paths from top to bottom through the DGSD. Snowmelt waters are not registered in the springs of district 4 but are mixed within the aquifer before emergence, indicating good retention properties for the aquifers of this spring district. Furthermore, the annual temperature andδ18O variations throughout the hydrological year show that these springs are not influenced by run-off infiltration from other spring districts. Interpretations concerning the internal structure of the DGSD based on the hydrogeologic data are shown in Fig.12. The aquifer boundaries are related to shear zones in the DGSD. In the Innsbruck Quartzphyllite Complex, such shear zones, to a large extent, consist of clay gouge-bounded kakirite and are underlain by more compact and less disturbed rock. Therefore, these horizons act as significant aquitards. Water infiltration and flow occurs in the overlying loosened and fractured rock mass.
In the spring district 4 aquifer systems, the aquitard is interpreted to be the basal shear zone of the DGSD with continuous groundwater flow occurring above this horizon through the mass movement from the uppermost scarp to the toe of the slope. Spring districts 2 and 3 are more local and related to secondary sagging bodies and shear zones within the DGSD. Therefore, a multilevel aquifer system is very apparent within the DGSD.
The conceptual model of the DGSD Sagspitz results in a maximum vertical mass movement thickness of 150–200 m, which is well in agreement with results from other case studies that applied drilling (Noverraz 1996) and geophysical prospecting methods (Ferrucci et al.2000; Brückl and Brückl2006).
Holocene mass movement activity might be restricted to the secondary sagging bodies in the central part of the DGSD and to superficial landslide activity at the toe of slope.
The current study shows that the use of isotope analysis on spring water, in addition to hydrogeologic (Pergher and Burger 2004) and geomorphologic standard investigations, is a useful tool when investigating the properties and structures of DGSDs.
Acknowledgement
The authors are in debt to G. Poscher, K. Krainer, and L. Pergher for their scientific advice and help during the early stages of the manuscript. We would also like to thank C. Spötl for his later input and advice. Thanks also go to the reviewers of this paper for their helpful corrections and suggestions. Furthermore, we are grateful for the financial aid of the ILF Consulting Engineers and the Austrian Geological Survey (M. Rockenschaub); the Department of Hygiene, Microbiology, and Social Medicine, University of Medicine In-nsbruck (I. Jenewein) for carrying out the hydrochemical andδ18O measurements, as well as the Institute of Geology and Palaeontology, Leopold Franzens University, Innsbruck (C. Spötl), for the δ18O measurements.
Fig. 12 Cross-section through the DGSD Sagspitz based on the geomorphologic, hydrochemical, hydrological, andδ18O analysis. The calculated local altitude effect on theδ18O values is displayed on the left axis. Derived spring districts are shown with representative mean δ18O emergence values. Arrows indicate runoff
infiltration and groundwater flow paths. The latter are related to the shear zones within the deep-seated slope deformation (shaded area). See text for further discussion
References
Agliardi F, Crosta G, Zanchi A (2001) Structural constraints on deep seated slope deformation kinematics. Eng Geol 59:83–102
Ampferer O (1939) Über einige Formen der Bergzerreißung. Sitzungsberichte der Akademie der Wissenschaften Wien. Mathematisch–Naturwissenschaftliche Klasse 148:1–14 (in German)
Barsch D (1997) Rockglaciers. Springer, Berlin Heidelberg New York
Brandner R (1980) Tektonische Uebersichtskarte von Tirol 1:600.000 (tectonic map of Tyrol, scale, 1:600.000). Universitätsverlag Wagner, Innsbruck (in German) Brückl E, Brückl J (2006) Geophysical models of the Lesachriegel and Gradenbach deep
seated mass movements (Schober range, Austria). Eng Geol 83(1–3):254–272 Bundesministerium fuer Land-und Forstwirtschaft, Umwelt-und Wasserwirtschaft (2005)
Hydrographisches Jahrbuch von Oesterreich 2002, B 110 (in German)
Bundesministerium fuer Land-und Forstwirtschaft, Umwelt-und Wasserwirtschaft (2006) Hydrographisches Jahrbuch von Oesterreich 2003, B 111, IN PRESS (in German) Burger U, Millen B, Brandner R (2003) Northern section of the Brenner Base Tunnel:
hydrogeological remarks. In: Krásný J, Hrkal K, Bruthans J (eds) IAH procceedings of the international conference on groundwater in fractured rocks, extended abstracts, Prague, Czech Republic, 15–19.09.2003. IHP-VI Series on groundwater no.7, pp 321– 322
Clar E, Weiss P (1965) Erfahrungen im Talzuschub des Magnesit Bergbaues auf der Millstätter Alpe. Berg-und Hüttenmännisches Monatsheft (Vienna) 110:447–460 (in German)
Crosta G (1996) Landslide, spreading, deep seated gravitational deformation: analysis, examples, problems and proposals. Geogr Fis Din Quat 19(2):297–313
Cruden DM, Varnes DJ (1996) Landslides: Types and processes. In: Turmer KA, Schuster RL (eds) Landslides investigation and mitigation, special report 247. transportation research board. National Research Council, pp 36–75
Dansgaard W (1964) Stable isotopes in precipitation. Tellus 16:436–468
Decker K, Reiter F, Brandner R, Ortner H, Bistacchi A, Massironi M (2003) Die Evaluierung tektonischer Risikozonen als Planungsgrundlage für den Brenner–Basistunnel. In: Rockenschaub M (ed) Geologische Bundesanstalt, Vienna. Tagungsband Arbeitsta-gung Brenner 3:249–253 (in German)
Ehalt D, Knott K (1965) Kinetische Isotopentrennung bei der Verdampfung von Wasserdampf. Tellus 17:389–397 (in German)
Epstein S (1956) Variations of the O18/O16 ratios of fresh water and ice. Nuclear Science series, report no. 19, Natl Acad Sci, pp 20–25
Ferrucci F, Amelio M, Sorriso-Vlavo M, Tansi C (2000) Seismic prospecting of a slope affected by deep-seated gravitational slope deformation: the Lago Sackung, Calabria, Italy. Eng Geol 57:53–64
Fügenschuh B, Seward D, Mancktelow N (1997) Exhumation in a convergent orogen: the western Tauern Window. Terra Nova 9:213–217
Fürlinger W (1972) Mechanismus einer Hangbewegung in Quarzphylliten und dessen Kontrolle im gefügeäquivalenten Modellversuch. Geologische Rundschau, Stuttgart, 61/3:871–882 (in German)
Grasbon B (2001) Großmassenbewegungen im Grenzbereich Innsbrucker Quarzphyllite, Kellerjochgneis, Wilderschönauer Schiefer, Finsinggrund (Vorderes Zillertal), unpub-lished masters thesis. Leopold Franzens University, Innsbruck (in German) Gruber A (2005) Bericht 2004 über geologische Aufnahmen im Quartär der nördlichen
Tuxer Alpen auf Blatt Brenner. Jahrb Geol Bundesanst 145(3/4):337–343 (in German) Haditsch JG, Mostler H (1982) Zeitliche und stoffliche Gliederung der Erzvorkommen im
Innsbrucker Quarzphyllit. Geol-Palaeontol Mitt Innsbruck 12:1–40 (in German) Hermann S, Becker LP, (2000) Tiefreichende Großhangbewegungen im Kristallin der
Niederen Tauern, Ostalpen. Verbreitung, Typen und ihr Einfluß auf die Morphogen-ese alpiner Täler. In: Proceedings of the Geoforum Umhausen conference, 1, Umhausen (in German)
Humer G, Rank D, Trimborn P, Stichler W (1995) Niederschlagsisotopenmessnetz Österreich. Monograph Bd. 52. Umweltbundesamt, Vienna (in German)
Hutchinson JN (1988) General report: morphological and geotechnical parameters of landslides in relation to geology and hydrology. In: Bonnard C (ed) Proceedings of the 5th international symposium on landslides, vol. 1, A. Balkelma, Rotterdam, Netherlands, pp 3–35
Kaiser A, Scheifinger H, Kralik M, Papesch W, Rank D, Stichler W (2002) Links between meteorological conditions and spatial/temporal variations in long-term isotopic records from the Austrian precipitation network. In: International conference“Study of environmental change using isotope techniques,” 23–27 April 2003. C&S paper series, IAEA, Vienna, 13/P, pp 67–77
Kilchmann S, Waber HN, Parriaux A, Bensimon M (2004) Natural tracers in recent groundwaters from different Alpine aquifers. Hydrogeol J 12(6):643–661
Kolenprat B, Rockenschaub M, Frank W (1999) The tectono-metamorphic evolution of Austroalpine units in the Brenner area (Tirol, Austria)—structural and tectonic implications. Tübinger geowissenschaftliche Arbeiten series A 52:116–117 Kralik M, Papesch W, Stichler W (2003) Austrian network of isotopes in precipitation
(ANIP) as a tool for assessing good status in groundwater. In: Kralik M, Häusler H, Kolesar C (eds) 1st conference on applied environmental geology (AEG’03) in central and Eastern Europe, Vienna, pp 127–129
Madritsch H (2004) Geologie und Hydrogeologie von Grosshangbewegungen im Innsbrucker Quarzphyllit und ihre wasserwirtschaftliche Bedeutung, unpublished master thesis. Leopold Franzens University, Innsbruck (in German)
Millen BMJ (2001) Aspects of the hydrogeology of a mining region with a focus on the antimony content of the spring-water, Eiblschrofen Massif, Schwaz, Tyrol, Austria. Mitteilungen der Österreichischen Geologischen Gesellschaft (Vienna) 94:139–156
Millen B, Brandner R, Burger U, Poscher G (2003) The essential geology and hydrogeology for 92 km of tunnelling, Austria/Italy. In: Krásný J, Hrkal K, Bruthans J (eds) IAH procceedings of the international conference on groundwater in fractured rocks, extended abstracts, Prague, Czech Republic, 15–19.09.2003. IHP-VI series on groundwater no. 7, pp 361–362
Mook WG (2000) Environmental isotopes in the hydrological cycle, IHP-V technical documents in hydrology, no.39, vol. I-VI. UNESCO/IAEA, Paris/Vienna
Moser M (1994) Geotechnics of large-scale slope movements (Talzuschübe) in alpine regions. In: Proceedings of the 7th international IAEG congress, Lisboa, pp 1533– 1542
Moser M (1996) The time dependent behaviour of sagging of mountain Slopes (Talzuschübe). In: Senneset (ed) Proceedings 7th international symposium on landslides. Balkema (Rotterdam) 2:809–814
Moser M, Glumac S (1983) Geotechnische Untersuchungen zum Massenkriechen in Fels am Beispiel des Talzuschubs Gradenbach (Kärnten). Verhandlungen der Geologischen Bundesanstalt (Vienna) 1982/3:209–241 (in German)
Mostler H, Heissel G, Gasser G (1982) Untersuchung von Erzlagerstätten im Innsbrucker Quarzphyllit und auf der Alpeiner Scharte. Archiv für Lagerstättenforschung Geologische Bundesanstalt (Vienna) 1:69–76 (in German)
Noverraz F (1996) Sagging or deep-seated creep: Fiction or reality? In: Senneset K (ed) Proceedings of the 7th international symposium on landslides. Balkema (Rotterdam) 2:821–828
Ortner H (2003) Local and far field stress-analysis of brittle deformation in the western part of the Northern Calcareous Alps, Austria. Geol-Palaeontol Mitt Innsbruck 26:109– 136
Patzelt G (1983) Die spätglazialen Gletscherstände im Bereich des Mieslkopfes und im Arztal, Tuxer Voralpen, Tirol.-Innsbrucker Geographische Studien (Innsbruck) 8:35–45 (in German)
Pergher L, Burger U (2004) Measurement of the physical properties of spring water—an easy an efficient tool for the process analysis of mass movements. In: Abstract volume, 10th Interpraevent congress, Riva del Garda, 24.–27.5 2005
Poscher G (1990) Geotechnische und morphologische Untersuchungen im Bereich des Talzuschubes “Lahnstrichbach”/Fügenberg (Zillertal, Tirol). Geol-Palaeontol Mitt Innsbruck 17:39–49 (in German)
Poisel R (1998) Kippen, Sacken, Gleiten: Geomechanik von Massenbewegungen und Felsböschungen. Felsbau 16(3):135–140 (in German)
Radbruch-Hall DH (1978) Gravitational creep of rock masses on slopes. In: Voight B (ed) Rockslides and avalanches, 1, natural phenomena—developments in geotechnical engineering. Elsevier (Amsterdam) 14(17):607–657
Rank D, Spendlinger W, Nußbaumer W, Papesch W, Rajner V (1982) Isotopenhy-drologische Untersuchungen am Bespiel der Erlaufquellen. Beiträge zur Geologie der Schweiz. Hydrologie 28(I):225–236 (in German)
Reitner JM (2000) Large scale toppling and sagging-type deformation in the Schober Group (Eastern Tyrol/Austria): mechanics, timing and consequences. Terra Nostra, p 91 Reitner J, Lang M, vanHusen D (1993) Deformation of high slopes in different rocks after
Würmian deglaciation in the Gailtal (Austria). Quat Int 18:43–51
Rockenschaub M, Kolenprat B, Nowotny A (2003) Innsbrucker Quarzphyllit Komplex, Tarntaler Mesozoikum, Patscherkofelkristallin. In: Rockenschaub M (ed) Geologische Bundesanstalt, Vienna. Tagungsband Arbeitstagung Brenner 3:41–58 (in German) Schotterer U, Stocker T, Bürkl H, Hunziker J, Kozel R, Grasso DA, Tripet JP (2000) Das
Schweizer Isotopen Messnetz: Trends 1992–1999. Gas Wasser Abwasser Schweiz 10:725–733 (in German)
Selverstone J (1988) Evidence for east–west crustal extension in the Eastern Alps: implications for the unroofing history of the Tauern window. Tectonics 7:87–105 Stichler W, Hermann A (1983) Application of environmental isotope techniques in water
balance studies of small basins. In: New approaches in water balance computations. –112
Stichler W, Zojer H (1986) Umweltisotopenmessungen und hydrochemische Untersuchungen als Hilfsmittel für die Erfassung von Quelleinzugsgebieten. Oesterreichische Wasserwirtschaft 38(Heft 11/12):261–266 (in German)
Stini J (1941) Unsere Täler wachsen zu. Geologie und Bauwesen 13:71–79 (in German) Tollmann A (1977) Geologie von Österreich, Band 3. Franz Deuticke Verlag, Vienna (in
German)
Vogel JC, Lerman JC, Mook WG (1975) Natural isotopes in the surface and groundwater from Argentina. Hydrol Sci Bull XX(2):203–221
Weidner S (2000) Kinematik und Mechanismus tiefgreifender alpiner Hangdeforma-tionen unter besonderer Berücksichtigung der hydrogeologischen Verhältnisse, unpublished PhD thesis. Friedrich Alexander University, Erlangen (in German) Yehdegho B, Reichl P (2002) Recharge areas and hydrochemistry of carbonate springs
issuing form Semmering Massif, Austria, based on long term oxygen-18 and hydrochemical data evidence. Hydrogeol J 10:628–642
Zischinsky U (1969a) Über Sackungen. Rock Mech (Vienna) 1:30–52 (in German)
Zischinsky U (1969b) Über Bergzerreißung und Talzuschub. Geologische Rundschau (Stuttgart) 58(3):974–983 (in German)
H. Madritsch.B. M. Millen
Institute of Geology and Paleontology, Leopold Franzens University, Innrain 52,
6020 Innsbruck, Austria
H. Madritsch ())
Institute of Geology and Palaeontology, University of Basel, Bernoullistrasse 32,
4056 Basel, Switzerland
e-mail: [email protected]