Digitized
by
the
Internet
Archive
in
2011
with
funding
from
Boston
Library
Consortium
Member
Libraries
DEWEY
B31 1415
.Odr
Massachusetts
Institute
of
Technology
Department
of
Economics
Working Paper
Series
DO
PEOPLE
MEAN
WHAT
THEY
SAY?
IMPLICATIONS
FOR
SUBJECTIVE
SURVEY
DATA
Marianne
Bertrand
and
Sendhil
Mullainathan
Working
Paper
01
-04
January
2001
Room
E52-251
50
Memorial
Drive
Cambridge,
MA
02142
This
paper
can be
downloaded
withoutcharge
from theSocial
Science Research Network
Paper
CollectionatMassachusetts
Institute
of
Technology
Department
of
Economics
Working Paper
Series
DO
PEOPLE
MEAN
WHAT
THEY
SAY?
IMPLICATIONS
FOR
SUBJECTIVE
SURVEY
DATA
Marianne
Bertrand
and
Sendhil
Mullainathan
Working
Paper
01
-04
January
2001
Room
E52-251
50
Memorial
Drive
Cambridge,
MA
02142
This
paper
can
be
downloaded
withoutcharge
from theSocial
Science Research Network
Paper
Collection athttp://papers.ssrn.com/paper.taf7abstract id=26013
MG
2 2
20o7
DO
PEOPLE
MEAN WHAT
THEY
SAY?
IMPLICATIONS
FOR
SUBJECTIVE
SURVEY
DATA
Marianne Bertrand and
Sendhil
Mullainathan*
Many
surveys contain a wealth of subjective questions that are at first glance ratherexcit-ing.
Examples
include"How
important is leisure time to you?","How
satisfied are you withyourself?", or
"How
satisfied areyou
with your work?" Yet despite easy availability, this isone data source that economists rarely use. In fact, the unwillingness to rely
on
such questionsmarks an
important dividebetween
economistsand
other social scientists.This neglect does not
come
from
disinterest.Most
economistswould
probably agree thatthe variablesthese questions attempt to uncover are interesting
and
important.But
theydoubt
whether
these questions elicitmeaningful answers.These
doubtsare, however, basedon
a prioriskepticism rather than on evidence. This ignores a large
body
of experimentaland
empiricalwork
that has investigated the meaningfulness of answers to these questions.Our
primaryobjective in this paper is to
summarize
this literature foran
audience of economists, therebyturninga
vague
implicit distrust intoan
explicit positiongrounded
in facts.Having summarized
the findings,
we
integratethem
into ameasurement
errorframework
so as to understandwhat
they
imply
for empirical research relyingon
subjective data. Finally, in order to calibrate theextent ofthe
measurement
error problem,we
performsome
simple empiricalwork
usingspecificsubjective questions.
I.
EVIDENCE
ON
SUBJECTIVE
QUESTIONS
We
begin bysummarizing
the experimental evidenceon
how
cognitive factors affect theway
people answer survey questions.1
A
set of experiments hasshown
that simple manipulationscan affect
how
people processand
interpret questions.One
first interesting manipulationcomes
from
the ordering of questions: whether questionX
is preceded by questionY
or vice versa cansubstantially affect answers.
One
reasonfor thisordering effectis thatpeople attempt toprovideanswers consistent with the ones they have already given in the survey.
A
second issue is thatpriorquestions
may
elicit certainmemories
or attitudes,which
then influence later answers. In astriking study, respondents wereasked two happiness questions:
"How
happy
areyou
with lifeingeneral?" and
"How
oftendo
you normally go outon
a date?"When
the dating questioncame
first, the answers to both were highly correlated but
when
itcame
second, they were basicallyuncorrelated. Apparently, the dating question induced people to focus on one aspect of their
life, an aspect that
had
undue
effects on their subsequent answer.Another
cognitive effect is the importance of question wording. In one classic example,researchers
compared
responses to two questions:"Do
you think the United States shouldforbid public speeches against democracy?"
and
"Do
you
think that the United States shouldallow public speeches against democracy?"
While
more
than half ofthe respondents stated thatyes, public speeches should be "forbidden," three quarters answered that no, public speeches
should not be "allowed". Evidence ofsuch wording effects are extremely
common.
Cognitive problems also arise due to the scales presented to people. In an experiment,
German
respondents were askedhow
many
hours ofTV
they were watching per day. Half ofincrements ending with
4|+
hours.The
other respondents were given thesame
scale exceptthe first five answers were compressed so that it
began
with<<
l\ hours.Only
16%
of therespondents given the first set of response alternatives reported watching
more
thantwo
hoursand
a halfofTV
per day.32%
of the respondents given the second set ofresponse alternativesreported watching
more
thantwo
hoursand
a half ofTV
per day.Respondents
thus appear tobe
inferring "normal"TV
viewingfrom
the scale.The
first scale, with a finer partition in the—
2 hours range, suggests to subjects that thisamount
ofTV
viewing iscommon.
In fact,stating that the survey's purpose is to estimate the
amount
ofTV
viewing greatly diminishesthe scale effect.
An
evenmore
fundamentalproblem
is that respondentsmay
make
little mental effort inanswering the question, such as
by
not attempting to recall all the relevant information or bynot reading through the
whole
list of alternative responses.As
a consequence, the ordering ofresponse alternatives provided matter since subjects
may
simply pick the first or last availablealternatives in alist. In the General Social Survey, forexample, respondents are askedto list the
most and
least desirable qualities that achildmay
have out ofalist of 13qualities. Researcherssurveyed people
and
gavethem
this list in either theGSS
order or in reverse order.They
foundthat subjects
would
rate the firstor last listed qualities,whatever
they were, asmost
important.Social Desirability
Beyond
purely cognitive issues, the social nature of the survey procedure also appears toplay a big role in shaping answers to subjective questioning.
Respondents
want
to avoid lookinghaving voted immediately after an election. This over-reporting is strongest
among
those thatvalue
norms
of political participation themost
and
thosewho
originally intendedon
voting.Other studies have noted that ifone adds to a voting question a qualifier that
"Many
people donot vote because something unexpectedly arose...," the discrepancy rate between self-reported
voting
and
actual voting drops.Another
example
can be found in the self-reporting of racial attitude.Much
evidencesug-gests people are unwilling to report prejudice. For example, reported prejudice increases
when
respondents believe they are being psychologically monitored for truth telling
and
decreaseswhen
the survey is administered by a black person.Non-
Attitudes,Wrong
Attitudes
and
SoftAttitudes
Perhaps the
most
devastating problem with subjective questions, however, is the possibilitythat attitudes
may
not "exist" in a coherent form.A
first indication ofsuch problems is thatmeasured
attitudes are quite unstable over time. For example, in two surveys spaced a fewmonths
apart, thesame
subjects were asked about their viewson government
spending.Amaz-ingly,
55%
ofthe subjects reported different answers.Such
low correlations at high frequenciesare quite representative.
Part ofthe
problem
comes
from respondents' reluctance toadmit lackofanattitude. Simplybecausethe surveyorisasking thequestion, respondents believethattheyshould haveanopinion
about it. Forexample, researchers have
shown
that large minoritieswould
respond to questionsabout obscure or even fictitious issues, such as providing opinions on countries that don't exist.
A
second,more
profound, problemisthat peoplemay
oftenbewrong
abouttheir "attitudes"People
may
not reallybe good
atforecasting theirbehavioror understandingwhy
theydidwhat
theydid. In a well-known experiment, subjects areplacedina
room
where
two
ropes are hangingfrom the ceiling
and
are asked to tie thetwo
ropes together.The
two
ropes are sufficiently farapart than one cannot merely grab one by the
hand and
then grab the other one.With
noother information, few of the subjects are able to solve the problem. In a treatment group, the
experimenter accidentally
bumps
into one of the ropes, setting it swinging.Many
more
peoplesolve the
problem
in this case: subjectsnow
see that they can set the ropes swingingand
grabone
on an up
arc. Yetwhen
they are debriefedand
askedhow
they solved the problem, few ofthe subjects recognize that it
was
thejostlingby
theexperimenter that ledthem
to the solution.A
finaland
relatedproblem
is cognitive dissonance. Subjectsmay
report (and even feel)attitudes that are consistent with their behavior
and
past attitudes. In one experiment,in-dividuals are asked to perform a tedious task
and
then paid either very little or a lot for it.When
asked afterwardshow
they liked the task, thosewho
are paid very little report greaterenjoyment.
They
likelyreason to themselves, "IfI didn't enjoy the task,why
would
I havedone
it for nothing?"
Rather
thanadmit
that they shouldjust have told the experimenter that theywere leaving, they prefer to think that the task
was
actually interesting. In this case, behaviorshapes attitudes
and
not the otherway
around.II.
A
MEASUREMENT
ERROR
PERSPECTIVE
What
do
these findings imply for statisticalwork
using subjective data? Let us adopt ameasurement
error perspectiveand assume
that reported attitudes equal true attitudes plusnoise.
The
above evidence however suggests two importantways
in which themeasurement
error in attitude questions will be
more
than white noise. First, themean
ofthe error term willnotnecessarily be zero within a survey. For example, the factthat asurvey uses "forbid" rather
than "allow" in a question will affect answers. Second,
many
of the findings in the literaturesuggest that the error
term
will be correlated with observableand
unobservable characteristicsof the individual. For example, the misreporting of voting is higher in certain
demographic
groups (e.g. those that place
more
social value on voting).There are two types of analysis that can be performed with subjective variables: using
attitudes to explain behavioror explainingattitudes themselves.
We
willexamine
how
mismea-surement affects both types of analyses. First, suppose
we
are interested in using self-reportedattitudes to explain behavior. Specifically, suppose
we
estimateY
it—
a+
bX
it+
cA
it, whilethe true
model
isYu
—
a
+
(3Xit+
jA*
t+
5Z
it, where i represents individuals, t representstime,
Y
represents anoutcome
ofinterest,X
represents observable characteristics,Z
representsunobservable characteristics,
and
we
assume
for simplicity thatZ
is orthogonal toX.
How
willthe estimated coefficient c
compare
to7
givenwhat
we
have learned aboutmeasurement
errorin attitude questions?
White
noise in themeasurement
ofA
will produce an attenuation bias, i.e. a bias towardszero.
The
firstmeasurement problem
listed above, a survey fixed effect, will produce no biasas long as the appropriate controls (such as year or survey specific
dummies)
are included.The
second problem, correlation with individual characteristicsX
and
Z
will create a bias:in
A
is correlated with unobservables. Hence,assuming
thatmeasurement
error problems arenot dominant, subjective variables can
be
useful as control variables but caremust
be taken ininterpreting it.
The
estimatedcoefficient does notonlycapture theeffect ofattitude but alsotheeffect of other variables that influence
how
the attitude is self-reported. This is closely relatedto the causality
problem
thatwe
often encounter even with perfectlymeasured
variables.2Let us
now
turn to thesecond type of analysis,where
we
are attemptingto explain attitudesthemselves. For example,
we
might
askwhetherhighwork
hours increaseloneliness. Specifically,suppose
we
estimateA
it=
a+
bX
it+
e, while the truemodel
isA*
t=
a
+
f3Xit+
-yZit.In this setup, thewhite noise in the
measurement
ofattitudesno
longercauses bias.But
theother biases
now
play amuch
more
importantrole. Specifically, the fact thatmeasurement
erroris correlated with individual characteristics will
now
severely biasX.
For example, supposewe
see that those
from
rich backgrounds have a greater preference for money.As
noted earlier, thismight
simply reflect the fact that a richbackground
affects the reporting of the preference formoney.
Such
a correlation could thus be purely spurious. Notice that thisproblem
is farmore
severe than in the previous analysis. First, the fact that
an
X
helps predict "attitude"means
very littleif it isonly predictingthe
measurement
error in attitude. So, one cannot argue as onedid before that simply helping to predict is a
good
thing, irrespective of causality. Second, thisis a
problem
that ismuch
harder to solve than an omitted variable bias problem. For example,it is hard to see
how
an
instrumental variable could resolve this issue.One
would
need aninstrument that affects
X
but not themeasurement
of attitude.But
the above evidence tellsusan instrument could be found in
most
contexts.To
summarize, interpreting the experimental evidence in ameasurement
errorframework
provides two important insights. First, if the
measurement
error is small enough, subjectivemeasures
may
be helpful as independent variables in predicting outcomes, with the caveat thatthecoefficients
must
be interpreted withcare. Second, subjectivevariablescannotreasonably beused as dependent variables given that the
measurement
error likely correlates in avery causalway
with the explanatory variables.III.
HOW
MUCH
NOISE
ISTHERE?
This leaves the important quantitative question:
how much
white noise error is there inthe subjective questions
we
might be interested in?Can we
in fact gain anythingby
addingresponses to subjective questions to our econometric models?
To
assess this,we
turn to theHigh
School &: Beyond's Senior sample,which
surveyed seniorsin school in 1980
and
then followedthem
everytwo
years until 1986. This sample provides uswith aset of subjective
and
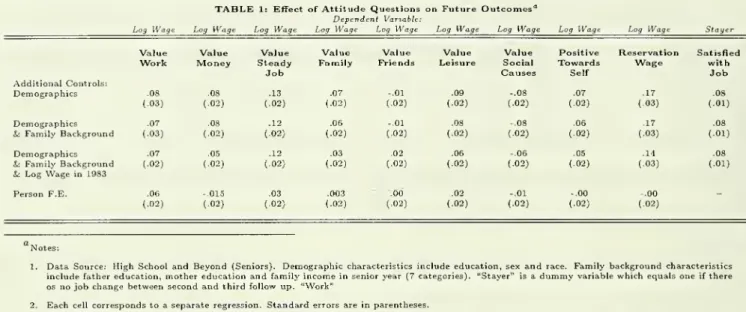
objective variables in each ofthese waves.In the first 8
columns
of Table 1,we
correlate answers to a set of attitude variables withfuture income (thereby
removing
mechanical correlationswith current income).Each
cellin theTable corresponds to a separate regression.
The
dependent variable is log(salary) in 1985. Inrow 1,
we
add
as control the sex, raceand
educational attainment ofthe respondent.Answers
to the subjective questions clearly help predict individual income.
A
set of correlations arevery intuitive. People that value
money
or a steady jobmore
earn more. People that valueattitude towards themselves earn more.
Maybe
somewhat
intriguing,we
find that people thatcare
about
their familyearn substantially more.Even
more
intriguing, people that value leisuretime also earn more.
The
secondrow shows
that respondents' attitudesdo
not simply proxyfor objective family
background
characteristics. Controlling for parents' educationand
familyincome
in the senior year does notweaken
thepredictivepower
ofthe attitude variables. Inrow
3,
we
show
that attitude questions stay predictive of futureincome
even after one controls forcurrent individual income.
As
awhole, these resultssuggest that noisedoesnotdominate
themeasurement
ofthesesub-jective questions. Attitudes actually predict
income
evenbeyond
pastincome
and background
characteristics.
Of
course,we
are not arguing for causality, merely that attitude variablesadd
explanatory power.
Finally, one
might
wonder
towhat
extent these variables are conveying any informationbeyond
fixed individual characteristics. Inrow
4,we
exploit the panel nature of theHigh
School
and
Beyond
survey.We
rerun the standard regressions with lagged attitude measuresbut also
add
person fixed effects.Most
ofthe effects previously discussed disappear, except forthe importance of
work
and
theimportance
of having a steady job (marginally significant). Ittherefore does not appear that changes in attitudes have as
much
predictivepower
as attitudesthemselves. Thus, while these attitude questions are helpful in explaining fixed differences
between
individuals, changes in reported attitudes are not helpful in explaining changes inoutcomes.
with future income.
Are
individuals that report higher reservationwage
today likely to earnmore
in the future?We
see a very strong relationship between reservationwage and
futureincome, even after controlling for the individual's education, sex
and
race. This holds true evenif
we
add
controls for familybackground
(row 2) or familybackground
and
currentincome
(row3). However, changes in reported reservation wages
do
not help predict changes inincome
(row4). In
summary,
answers to reservationwage
questionsdo
appear to capturesome
unobservedindividualcharacteristics
and might
beworthincludingwhen
tryingto predictindividualincome.Changes
in reported reservationwages
however provideno
informationabout changes in income.Finally, in
column
10,we
ask whether answers to job satisfaction questions help predictfuturejob turnover. Again,
we
find that people's self-reported satisfaction with theirjob "as awhole" is a strong predictor of their probability of changing job or not in the future.3
IV.
CONCLUSION
Four
main
messagesemerge from
this discussion. First, a large experimental literatureby
and
largesupports economists' skepticism ofsubjectivequestions. Second, putinan econometricframework, these findings cast serious doubts on attempts to use subjective data as dependent
variables because the
measurement
error appears to correlate with a large set of characteristicsand
behaviors. For example, adropin reported racism over timemay
simplyreflect an increasedreluctance to report racism. Since
much
of the interesting applicationswould
likely use thesedata as dependent variables, this is a rather pessimistic conclusion. Third,
and
on a brighternote, these data
may
be useful as explanatory variables.One
must, however, take care ininterpretingtheresultssincethefindings
may
not becausal. Finally, ourempiricalwork
suggeststhat subjective variables are in practice useful for explaining differences in behavior across
individuals.
Changes
in answers to these questions, however,do
not appear useful in explainingchanges in behavior.
REFERENCES
Bertrand,
Marianne and
Mullainathan,
Sendhil."Do
PeopleMean
What
They
Say?Implications For Subjective Survey Data."
Mimeo,
University of Chicago, 2000.Sudman,
Seymour;
Bradburn,
Norman
M.
and
Schwarz,
Norbert.
Thinking about questions:The
Application ofCognitive Processes to SurveyMethodology
.San
Francisco: Jossey-BassPublishers, 1996.
Tanur,
Judith
M.
QuestionsAbout
Questions: Inquiries into the Cognitive Bases of Surveys.New
York: Russell Sage Foundation, 1992.TABLE 1: Effect ofAttitudeQuestionson FutureOutcomes'1
Dependent Variable:
LogWage Log Wage Log Wage Log Wage Log Wage Log Wage Log Wage Log Wage Log Wage Stayer Value Value Value Value Value Value Value Positive Reservation Satisfied
Work Money Steady Job
Family Friends Leisure Social Causes Towards Self Wage with Job Additional Controls: Demographics .08 .08 .13 .07 -.01 .09 -.08 .07 .17 .08 (.03) (.02) (.02) (-02) (.02) (.02) (.02) (.02) (.03) (.01) Demographics .07 .08 .12 .06 -.01 .08 -.08 .06 .17 .08 8cFamilyBackground (.03) (.02) (.02) (.02) (.02) (.02) (.02) (.02) (.03) (.01) Demographics .07 .05 .12 .03 .02 .06 -.06 .05 .14 .08
&:FamilyBackground (.02) (.02) (.02) (.02) (.02) (.02) (.02) (.02) (.03) (.01)
ULogWagein1983
Person F.E. .06 -.015 .03 .003 .00 .02 -.01 -.00 -.00 _ (.02) (.02) (.02) (.02) (.02) (.02) (.02) (.02) (.02)
Notes;
1. DataSource: HighSchooland Beyond(Seniors). Demographiccharacteristicsincludeeducation, sexand race. Familybackground characteristics include fathereducation,mother education andfamilyincomeinsenioryear(7categories). "Stayer"is adummyvariablewhichequalsoneifthere osnojobchange between secondandthird follow up. "Work"
2. Eachcellcorrespondsto aseparate regression. Standarderrorsareinparentheses.
3. Exceptinrow 4,outcomesarefromthe third follow-upsurveyand attitudes arefromthesecondfollow-up. Row4reportspanel regressionsonall
availablesurvey periods. Theregressionsinrow4include surveyfixed effects.
Footnotes
*
Graduate
School of Business, University of Chicago,NBER
and
CEPR;
MIT
and
NBER.
1.
Due
to space constraints,we
will justmention two books
that are agood
source for areview of the experimental evidence:
Tanur
(1992)and
Sudman,
Bradburn and
Schwarz(1996).
A
fuller list ofreferences can be gotten in the full version of this paper (Bertrandand
Mullainathan 2000).2.
An
extremeexample
of this occurswhen
themeasurement
error is correlated with thevariableof interest itselfas is suggested
by
cognitive dissonance. For example, peoplemay
report a lower preference for
money
ifthey aremaking
less money. This is a case of purereverse causation.
3. In this case,
we
are not able to study a fixed effectmodel
as the job satisfaction questionwas
only asked in the secondand
third followup
of the data.k
Date
Due
MIT LIBRARIES