This project is funded by the European Union under the 7th Research Framework Programme (theme SSH) Grant agreement nr 290752. The views expressed in this press release do not necessarily reflect the views of the European Commission.
Working Paper n° 66
Multidimensional Poverty in Brazil
Valeria Pero and Gabriela Freitas da Cruz
UFRJ
Multidimensional Poverty in Brazil
1Valeria Pero2 and Gabriela Freitas da Cruz3
1. Introduction
Poverty is a condition defined by some criterion of deprivation that limits people’s well-being, and therefore, it is an important and disquieting issue for development. Overall, since it deals with ethical reasons related to survival, economic literature in Brazil has been emphasizing the approach based on absolute income poverty, which is defined based on a line of indigence and poverty.4 These are absolute poverty measures that make it possible to identify
the number of poor people in a country. Brazil is a country that is characterized by its huge size and diversity, harboring a large number of people living in conditions of absolute poverty. This type of indicator has also been used to facilitate international comparisons.
Several studies have pointed to the decrease of absolute income poverty in Brazil in the beginning of the 2000s. Economic growth, improvements in the job market, the increase in the minimum wage, and the creation of the Bolsa Família (“Family Allowance”) social welfare program, in 2004, were key factors in this process. These indicators, however, are not capable of describing the poverty phenomenon combined with that of concentration in income distribution, and in the case of Brazil, these factors are strongly associated. To do so, one must consider poverty as a multidimensional phenomenon that incorporates other types of deprivations and that is not restricted to the dimension of income. To proceed in this analysis, the first step is to measure poverty in its multiple forms.
The Human Development Report 2010 (UNDP, 2010) calculated the Multidimensional Poverty Index (MPI), which was developed by ALKIRE and SANTOS (2010) for 104 developing countries. According to their index, there are 1.75 billion multidimensionally poor people in these countries, a number that exceeds the 1.44 billion inhabitants of these countries who live on a maximum of US$1.25 per day. In Brazil, the proportion of the population that was living in multidimensional poverty (calculated with data from the 2000s) was 8.5%, while the proportion of poor people in terms of income was 5.2%, taking the line of US$1.25 per day.
1 This work is part of the Nopoor Research Project supported by the European Union (www.nopoor.eu). 2 IE-UFRJ.
3 IE-UFRJ and IBGE.
The objective of this article is to construct a poverty index that deals with poverty in its various dimensions, in a way that compares to the absolute income poverty indicator, and to analyze its evolution in the beginning of the 2000s. To do so, based on the National Household Sample Survey (PNAD) from 2004 and 2014, this index groups indicators with four dimensions: (i) health, (ii) education, (iii) housing and mobility, and (iv) employment and social protection. In addition, poverty is very unequal in Brazil, presenting differences in the condition of poverty in rural areas, non-metropolitan urban areas, and metropolitan areas. Therefore, the analysis will be done considering these regional areas.
2. Multidimensional poverty
Income poverty is certainly the form of poverty that is prioritized by economic analyses and by public policies. As of the 1990s, however, the understanding that poverty is a multidimensional phenomenon, related to income, but with many other attributes beyond this one, has gained space [ATKINSON, 2003, p. 51; BOURGUIGNON e CHAKRAVARTY, 2003, p. 26]. In Development as Freedom, from 1999, Amartya Sen challenges the predominant view, among economists, of development as mere per capita income growth of a country. For the author, development is related to people’s well-being and to the freedoms that they enjoy, aspects that cannot always be guaranteed by income. Consequently, “poverty must be seen as the deprivation of basic capabilities rather than merely as lowness of incomes, which is the standard criterion of identification of poverty.” (SEN, 1999, p. 87).
It is know that an individual lacks basic capabilities when he or she is not apt to lead the type of life that he or she values. In this sense, to consider poverty from the perspective of capabilities is fundamental, for these capabilities are ends in themselves, while income is only an instrument for attaining them. Having good health or having studied are aspects of life that people have reasons to value in themselves, not as a means to reach another end. Furthermore, income is not the only instrument that creates capabilities, and the relation between low income and low capacity is variable according to community, family, and individuals.
One of the first efforts to create a multidimensional indicator of development/poverty was the creation of the Human Development Index (HDI), which was presented in the Human Development Report 1990 (UNDP, 1990). The HDI uses aggregate data at the country level on longevity (life expectancy at birth), education (at the time, literacy rate and enrollment rate), and standard of living (GDP per capita). Such aggregate data does not allow for the
consideration of income or gender inequalities, nor dimensions such as political freedom, security, etc.
Since then, many other multidimensional indicators have been created. From the perspective of poverty, the most significant is the Multidimensional Poverty Index (MPI) developed by ANAND and SEN (1997), which is based on dimensions and indicators that are similar to those of the HDI, but which focuses on the individuals who suffer deprivations, in contrast to the average indicators used in the HDI analysis. Even so, it uses indicators grouped by country, and is not capable of identifying inequalities of various types. This problem was only overcome by more recent indicators, which were developed because of the greater availability of data from household surveys for a large number of countries. This data is still restricted in relation to which dimensions of poverty it allows us to analyze, but it already represents a great advance in the direction of better identifying who the poor are, what deprivations they experience, and which needs are more urgent.
In possession of better data, other challenges have been receiving the attention of international literature. The first is how to choose, among the available data, which dimensions and indicators are more relevant. For SEN (2010), the choice of these dimensions, or of the relevant freedoms, as well as of their weights, in a synthetic indicator, is a process of utmost importance, and in terms of public policies, it should consider the aspects that citizens value. Nevertheless, empirical literature has made little progress in this direction. In general, the dimensions and indicators are selected based on technical arguments and on data availability; and the weights of indicators tend to be the same for all or chosen based on statistical methods. More qualitative research is lacking on people’s opinion about what type of life they value, and it is difficult to obtain information of this type that is not influenced by current social norms.
Another issue is the grouping of the dimensions in order to produce indicators with desirable statistical properties. In this field, much progress has been made. ALKIRE and FOSTER (2010) have proposed a methodology that has been adopted by some countries and also by the United Nations. The Human Development Report 2010 (UNDP, 2010) adopts this methodology and calculates the Multidimensional Poverty Index (MPI), developed by ALKIRE and SANTOS (2010) for 104 developing countries. According to their index, there are 1.75 billion multidimensionally poor people in these countries, a number that exceeds the 1.44 billion inhabitants in these countries who live with a maximum of US$1.25 per day. In Brazil, the proportion of the population that was living in multidimensional poverty (calculated with data
from the 2000s) was 8.5%, while the proportion of poor people in terms of income was 5.2%, taking the line of US$1.25 per day.
OPHI (2015) includes some examples of governments that have constructed multidimensional indicators based on the methodology which was proposed by ALKIRE and FOSTER (2010) and which has been adopted by the UN. In general, adaptations were made in the choice of indicators and of the lines of deprivation for each of them, so that the final index was better adapted to the reality of the respective countries. Despite these examples of incorporation of multidimensional poverty in government agendas, public policies for fighting poverty continue to focus predominantly on guaranteeing income, or on guaranteeing education and health as a means of earning income.
SEN (1999, p. 108) himself clarifies that “policy debates have indeed been distorted by over-emphasis on income poverty and income inequality, to the neglect of deprivations that relate to other variables, such as unemployment, ill health, lack of education, and social exclusion.” This is strongly reflected in a phenomenon that has been common in developing countries in the past few years: many of them have achieved much progress with respect to the reduction of income poverty, but have left much to be desired in many other aspects that are important for social well-being.
ALKIRE and SANTOS (2010) show that, among the Millennium Objectives established by the United Nations (UN) in 2000, the eradication of extreme poverty (to reduce by half the proportion of the population with income less than one dollar per day) was the goal that had been attained by the greatest proportion of countries in 2009. In relation to the goals related to other dimensions of poverty, the performance had been much worse, especially the poor performance in the field of basic sanitation (to reduce by half the proportion of the population without sanitary sewage by 2015) and of child mortality (to reduce child mortality by two-thirds by 2015). India, for example, is a good example of a country that has achieved high rates of economic growth since the 1990s, and has reduced income poverty, but has had less significant progress in other social indicators [see ALKIRE and SETH (2015)]. In Brazil also, though significant improvements have occurred in various spheres in the 2000s, the drop in absolute income poverty has been more accentuated than the evolution of many other social indicators. The favorable performance of the job market, with a real increase in the minimum wage and creation of formal employment, made possible a strong expansion of consumption among the lower classes and the overcoming of income poverty for a significant portion of the population. As discussed in LAVINAS (2013) and according to data from the National Household Sample
Survey (PNAD/IBGE), the proportion of households with certain durable consumption goods, such as cellular phones, computers, and washing machines, grew much more than access to services such as piped water and adequate sanitary sewage.
Therefore, it is fundamental to reinforce the discussion about multidimensional poverty and to construct indicators that can accompany the evolution of countries in this direction. In Brazil, studies such as FAHEL et al. (2015) and SAGI MDS (2014) calculate an index similar to that developed in the UNDP (2010) based on the PNAD data for the most recent period (post-2000s). This article aims to contribute to this literature by proposing other possible indexes that can be constructed based on PNAD microdata. These other indexes can better adapt to the Brazilian reality, which is very distinct from that found in some countries of Sub-Saharan Africa or in India, where the deprivations are much more accentuated. This is important in order to avoid creating the false impression that multidimensional poverty in Brazil is low and does not represent a great challenge. Brazilian social indicators, in fact, are better than those of the aforementioned countries, but expectations and objectives also need to be greater.
3. Data
In this paper, microdata from the 2004 and 2014 National Household Sample Survey (PNAD/IBGE) were used. The database is composed of 398,848 individuals in 2004 and 361,940 individuals in 2014, which represent a population of 183,202,951 and 202,851,191 inhabitants, respectively. The calculations are presented for the country as a whole and for non-metropolitan urban, rural, and non-metropolitan areas, which includes the non-metropolitan regions of Belém, Fortaleza, Recife, Salvador, Belo Horizonte, Rio de Janeiro, São Paulo, Porto Alegre and the city of Brasília.
Initially, some indicators were selected that could compose the multidimensional poverty index. First, those indicators were chosen that were compatible with the methodology developed by ALKIRE and FOSTER (2010) and already applied to Brazil in some studies by FAHEL et al. (2015) and by the Secretariat of Evaluation and Information Management linked to the former Ministry of Social Development and the Fight Against Hunger (SAGI/MDS (2014)). Such is the case of child mortality, years of adult schooling, child school attendance, and some variables related to household infrastructure. Additionally, other indicators were chosen that may also be important for composing this type of index based on the Brazilian social reality, which is very distinct from countries in Africa or Asia, which are commonly used as a reference in poverty studies by the United Nations and World Bank. Based on the
descriptive analysis on these indicators and on the bibliography in the area, we have constructed three distinct multidimensional indices in order to verify which of them seems to be more adequate for the current Brazilian context.
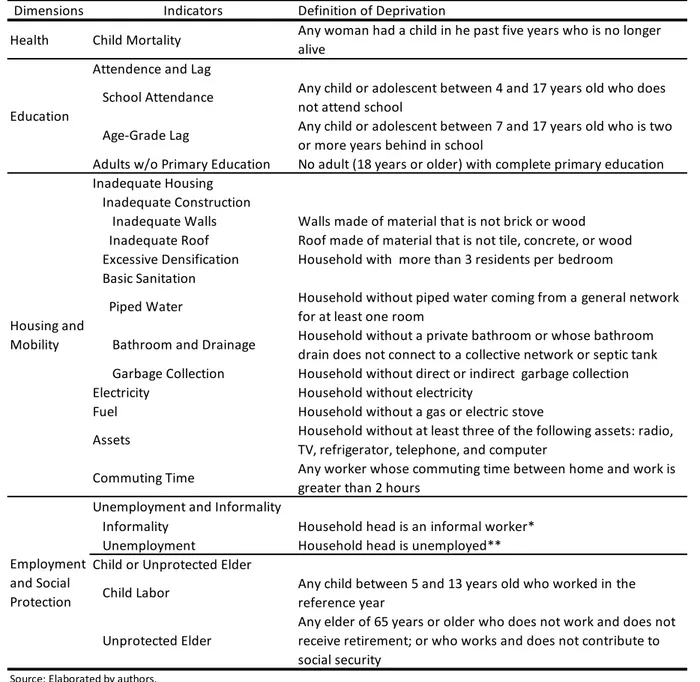
Table 1 describes the indicators constructed in our database. As one can see, there are relevant dimensions of poverty and well-being that are left out of the analysis, such as violence, adult health, and others. This is due to limitations of the database itself, which does not include information about all of these aspects of people’s lives.
Dimensions Indicators Definition of Deprivation
Health Child Mortality Any woman had a child in he past five years who is no longer alive
Attendence and Lag
School Attendance Any child or adolescent between 4 and 17 years old who does not attend school
Age-Grade Lag Any child or adolescent between 7 and 17 years old who is two or more years behind in school
Adults w/o Primary Education No adult (18 years or older) with complete primary education Inadequate Housing
Inadequate Construction
Inadequate Walls Walls made of material that is not brick or wood Inadequate Roof Roof made of material that is not tile, concrete, or wood Excessive Densification Household with more than 3 residents per bedroom Basic Sanitation
Piped Water Household without piped water coming from a general network for at least one room
Bathroom and Drainage Household without a private bathroom or whose bathroom drain does not connect to a collective network or septic tank Garbage Collection Household without direct or indirect garbage collection Electricity Household without electricity
Fuel Household without a gas or electric stove
Assets Household without at least three of the following assets: radio, TV, refrigerator, telephone, and computer
Commuting Time Any worker whose commuting time between home and work is greater than 2 hours
Unemployment and Informality
Informality Household head is an informal worker* Unemployment Household head is unemployed** Child or Unprotected Elder
Child Labor Any child between 5 and 13 years old who worked in the reference year
Unprotected Elder
Any elder of 65 years or older who does not work and does not receive retirement; or who works and does not contribute to social security
Source: Elaborated by authors.
* The following workers were considered informal (in the reference week): workers without papers; self-employed workers or employers who do not contribute to social security; unpaid workers who work 15 hours or more per week; workers who produce for their own consumption, build for their own use, or who are unpaid that looked for a job in the past year.
** Individuals who did not work in the reference week and who looked for a job in the past year were considered unemployed.
Employment and Social Protection
Table 1: Definition of the Indicators
Education
Housing and Mobility
The selected indicators can be divided into four areas: health, education, housing and mobility, and employment and social protection. For each indicator, the values 0 or 1 are attributed, which indicate the absence (0) or presence (1) of a given deprivation in the household unit, as described in Figure 1. Some indicators are grouped in order to construct a more comprehensive dimension, as is the case of “attendance and lag:” instead of considering the two dimensions separately, another possibility is to consider the family as being deprived of a right to education when there is a child who does not attend elementary school or who is more than one year behind. The same occurs in relation to the dimensions of “inadequate housing,” “unemployment and informality,” and “child or unprotected elder.”
Finally, it is important to mention that some of these indicators apply only to specific family structures. For example, the “child mortality” indicator only applies to households where a woman had a child who was born alive in the past five years. For other families, the value attributed to the indicator will always be 0, that is, it will indicate that the household does not suffer from this deprivation. These indicators should be analyzed very carefully: if one or other does not apply to a large part of households and weighs heavily on the final index, it can artificially make the latter go down.
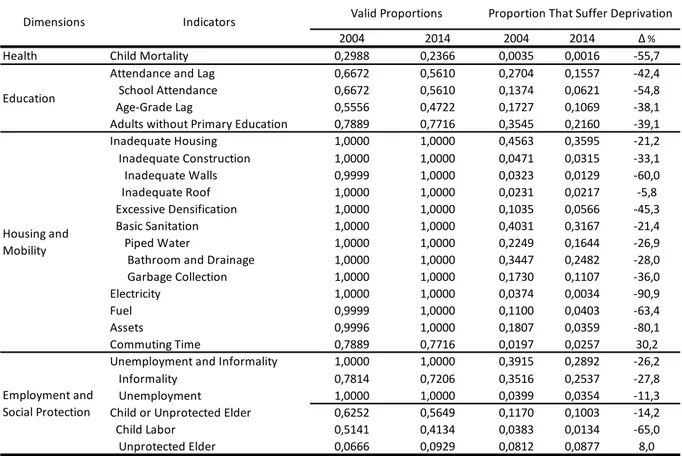
Table 2 includes the descriptive statistics of these indicators. It indicates, for the years of 2004 and 2014, the proportion of individuals who live in households to which the indicator applies, in order for us to verify the issue raised beforehand; and the proportion of individuals who live in households that suffer from a given deprivation (in relation to the total of individuals).
In relation to the proportion of individuals to which the indicator applies, we observed that the indicators of “child mortality” and “unprotected elder” are very restrictive. This means that the majority of individuals do not appear to suffer from a given deprivation not due to issues related to their well-being, but because the indicator does not apply to any members of their households. Using these indicators in the final index, therefore, can create the false impression that the level of need in multidimensional terms is lower.
Considering the proportion of individuals who live in households that face such deprivations, the results are varied. In general, there was a reduction in the level of need in almost all of the indicators, with an emphasis on the expansion of access to electricity and material goods and on the strong reduction of child labor. Access to electricity, which was already greater than 95% in 2004, became almost universal, probably due to the Luz para Todos (“Light For All”) Program, which brought electricity to more remote regions, especially rural areas. The presence of durable goods in households, such as TVs, computers, refrigerators, etc., also grew a lot in a decade. In this period, the federal government prioritized the inclusion of the lowest income brackets via consumption and in which the population’s income grew strongly as a result of improvements in the job market and the expansion of social welfare
Table 2: Proportion of Individuals for Whom the Indicator Applies (Valid Proportion) and of Individuals Who Suffer Deprivation
2004 2014 2004 2014 Δ % Health Child Mortality 0,2988 0,2366 0,0035 0,0016 -55,7
Attendance and Lag 0,6672 0,5610 0,2704 0,1557 -42,4 School Attendance 0,6672 0,5610 0,1374 0,0621 -54,8 Age-Grade Lag 0,5556 0,4722 0,1727 0,1069 -38,1 Adults without Primary Education 0,7889 0,7716 0,3545 0,2160 -39,1 Inadequate Housing 1,0000 1,0000 0,4563 0,3595 -21,2 Inadequate Construction 1,0000 1,0000 0,0471 0,0315 -33,1 Inadequate Walls 0,9999 1,0000 0,0323 0,0129 -60,0 Inadequate Roof 1,0000 1,0000 0,0231 0,0217 -5,8 Excessive Densification 1,0000 1,0000 0,1035 0,0566 -45,3 Basic Sanitation 1,0000 1,0000 0,4031 0,3167 -21,4 Piped Water 1,0000 1,0000 0,2249 0,1644 -26,9 Bathroom and Drainage 1,0000 1,0000 0,3447 0,2482 -28,0 Garbage Collection 1,0000 1,0000 0,1730 0,1107 -36,0 Electricity 1,0000 1,0000 0,0374 0,0034 -90,9 Fuel 0,9999 1,0000 0,1100 0,0403 -63,4 Assets 0,9996 1,0000 0,1807 0,0359 -80,1 Commuting Time 0,7889 0,7716 0,0197 0,0257 30,2 Unemployment and Informality 1,0000 1,0000 0,3915 0,2892 -26,2 Informality 0,7814 0,7206 0,3516 0,2537 -27,8 Unemployment 1,0000 1,0000 0,0399 0,0354 -11,3 Child or Unprotected Elder 0,6252 0,5649 0,1170 0,1003 -14,2 Child Labor 0,5141 0,4134 0,0383 0,0134 -65,0 Unprotected Elder 0,0666 0,0929 0,0812 0,0877 8,0
Proportion That Suffer Deprivation Valid Proportions
Source: Elaborated by authors based on National Household Sample Survey (PNAD) data.
Education Housing and Mobility Employment and Social Protection Dimensions Indicators
programs such as Bolsa Família. Finally, the reduction of the child labor rate observed here is due both to the effective reduction of the proportion of children aged 5 to 13 who work, and to the reduction of the proportion of households with children in this age range.
On the other hand, it is important to note that two indicators worsened. The first was the proportion of households in which a resident spends two or more hours commuting to work. The proportion is not high (2.57%), since this is a problem mostly restricted to large Brazilian metropoles and to a portion of the population that has jobs which compensate such a loss of time in traffic. This proportion, however, is 30% higher than in the year of 2004, and tends to grow in view of the increase in the number of cars and the absence of effective solutions for urban mobility in these cities.
The second indicator that worsened was the proportion of households where there is an elderly person who works and does not contribute to social security or who does not work or receive retirement. This result may seem strange in a decade in which there was an increase in social security coverage, with a progressive incorporation of former rural or informal workers in the program. Nonetheless, the evolution observed only reflects a demographic issue: the proportion of households with elderly people increased, and therefore, so did the proportion of households to which the indicator applies. Despite this, the existence of unprotected elderly people without a secure and steady source of income is always a concern.
Furthermore, it is important to note that around one-fifth of Brazilian households do not have an adult who completed primary education, which possibly represents for these people both a difficulty in dealing with simple everyday tasks and knowing and exercising their rights, and also an obstacle for helping younger people with schoolwork and encouraging them in their studies. In relation to school-aged children, school attendance grew considerably, though 6% of the population still reside in households where a child is not in school. The problem of grade repetition is still more serious: in little more than 10% of households there is a child or adolescent who studies, but is more than two years behind in relation to his peers. Finally, in terms of household infrastructure, basic sanitation continues to be the most serious problem, having presented modest progress in the period: 32% (versus 40% in 2004) of individuals reside in households without piped water, bathrooms with adequate sewage drains or garbage collection.
4. Methodology
In this article, the methodology used to construct the multidimensional poverty index was that developed by ALKIRE and FOSTER (2010). It has been used by various countries that developed their own multidimensional poverty indexes and by the United Nations since 2010. As of that year, the United Nations Development Program (PNUD) began to calculate and publish the multidimensional poverty indicator created by Sabina Alkire and Maria Emma Santos, from the Oxford Poverty & Human Development Initiative (OPHI), presented in ALKIRE and SANTOS (2010). In the next subsection, the general methodology will be presented, which is common to several indicators. In the following subsection, three indexes constructed in this article will be presented.
4.1. General Form of Calculation and MPI
ALKIRE and FOSTER (2010) developed a general methodology for constructing multidimensional poverty indexes that meets a series of desirable properties and is very flexible with regard to the indicators that compose the index. Suppose a population with 𝑛 individuals. The first step is to choose the 𝑑 dimensions/indicators that compose the index. From then on, we obtain a 𝑛 × 𝑑 matrix with the value of the 𝑑 indicators for the 𝑛 individuals that compose the population.
[
𝑦11 ⋯ 𝑦1𝑑
⋮ ⋱ ⋮
𝑦𝑛1 ⋯ 𝑦𝑛𝑑]
The second step is to choose a cut-off line 𝑧𝑑 for each of the indicators, in order to define whether an individual suffers or not from deprivation in a given dimension.
𝑧 = [𝑧1 ⋯ 𝑧𝑑]
From then on, we constructed a matrix of deprivations 𝐺0, 𝑛 × 𝑑 , in which the element 𝑔𝑖𝑗 is equal to 1 if individual 𝑖 suffers from deprivation in dimension 𝑗, and equal to 0 if the
opposite is true. To obtain the number of deprivations for each individual, it is enough to add the values from this matrix in each line. Nonetheless, it may be interesting to attribute different weights to each indicator. In this case, we defined vector 𝑤 of weight, so that the sum of the weights of all the indicators is equal to 1:
𝑤 = [ 𝑤1
⋮ 𝑤𝑑]
To calculate the level of general deprivation for each individual, it is enough to add the weights of the indicators in which he or she suffers deprivation (or multiply matrix 𝐺0 by vector 𝑤). 𝑐 = 𝐺0× 𝑤 = [ 𝑤1 𝑔11+ ⋯ + 𝑤𝑑 𝑔1𝑑 ⋮ 𝑤1 𝑔𝑛1+ ⋯ + 𝑤𝑑 𝑔𝑛𝑑 ] = [ 𝑐1 ⋮ 𝑐𝑛]
An individual is considered multidimensionally poor if his or her level of deprivation 𝑐𝑖 is greater than an established limit, 𝑘. If the level of deprivation is equal to or less than this limit, the individual will be considered non-poor.
Based on this information, we calculated some multidimensional poverty indicators: i) Proportion of poor people:
𝐻(𝑌, 𝑧, 𝑘) = 𝑞⁄ , 𝑛
where 𝑞 is the number of multidimensionally poor individuals and 𝑛 is the total population. ii) Level of average deprivation of poor people:
𝐴 = ∑ 𝑐𝑖
𝑞 1
𝑞 ⁄ ,
where ∑𝑞1𝑐𝑖 is the sum of the level of deprivation for the 𝑞 poor individuals.
iii) Multidimensional poverty index:
𝑀0 = 𝐻 × 𝐴 =𝑞⁄ ×𝑛 ∑ 𝑐𝑞1 𝑖
𝑞
⁄ = ∑ 𝑐𝑞1 𝑖
𝑛 ⁄
This article will present the results of (i) and (iii) for three distinct indicators, which were calculated for Brazil in 2004 and 2014. The first, the proportion of poor people, is very simple and easy to understand. The second, meanwhile, allows for an analysis of not only the variation of poverty in itself, but also the number of deprivations suffered by the poor. Both results can be decomposed according to population groups (household location in rural, urban, or metropolitan areas, for example) and 𝑀0 can be decomposed according to the contribution of each indicator to the index, as ALKIRE and SETH do for India in 1999 and 2006.
The first decomposition begins with the fact that the poverty index (𝑀0), as well as the
𝑀0 = ∑𝑛𝑙 𝑛 × 𝑀𝑙
0 𝑚
𝑙=1
where 𝑙 indicates the group in question; 𝑛𝑙 is the population of this group; and 𝑀𝑙0 is the
indicator of multidimensional poverty within the group.
The second, meanwhile, is done based on the following formula:
𝑀0 = ∑ 𝑤 𝑗[ 1 𝑛 ∑ 𝑔𝑖𝑗 𝑞 𝑖=1 ] 𝑑 𝑗=1
where 𝑗 indicates the dimension in question; and ∑𝑞𝑖=1𝑔𝑖𝑗 is the number of poor people who suffer deprivation in dimension 𝑗.
4.2. Three Multidimensional Poverty Indexes for Brazil
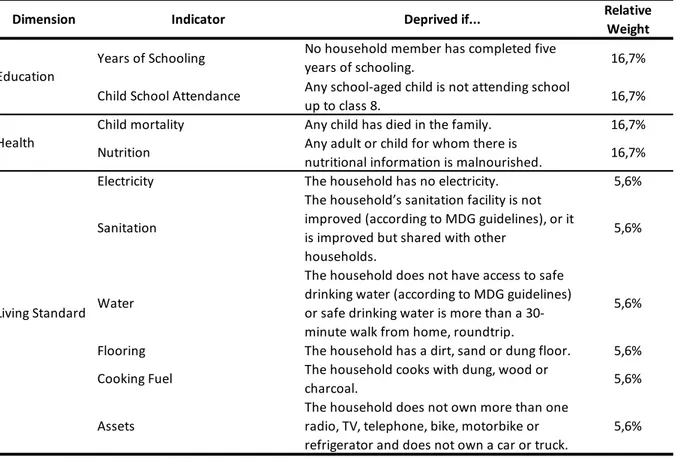
The point of departure for the selection of the indicators that compose the indexes constructed in this article was the MPI (Multidimensional Poverty Index), an index developed by ALKIRE and SANTOS (2010) from OPHI in partnership with the UNDP. This index is composed of ten indicators, of three different dimensions: education, health, and standard of living, the last of which is basically related to the household’s infrastructure. The indicators and the cut-off lines to define the deprivations are presented in Table 3.
The index was calculated for more than 100 countries in the world, including Brazil, with some adaptations to the available data for each of them. The data from the National Household Sample Survey, used in this article, does not include information about malnutrition or about the material that covers the floor of households. Therefore, the first index constructed here, based on the MPI, has suffered some adaptations, which were already developed in part in FAHEL et al. (2015).
In the indicators that refer to education, cut-off lines were adopted that were a little higher, increasing the number of years of minimum study for adults (8 years, according to Brazilian primary education) and the age range for which school attendance is required (4 to 17 years old, covering all of basic education). In the case of child mortality, it was investigated whether a woman from the household had at least one child in the past five years who was no longer alive. Finally, in reference to household infrastructure, we inserted the indicator of adequate roofing, as a substitute for flooring. The concepts of access to sewage drainage and water supply are more rigorous here, and are in accordance with the definition adopted by the Brazilian Institute of Geography and Statistics [see IBGE (2004)]. In relation to goods present in the household, cars, trucks, motorcycles, and bicycles were not considered, since there was
Dimension Indicator Deprived if... Relative Weight
Years of Schooling No household member has completed five
years of schooling. 16,7%
Child School Attendance Any school-aged child is not attending school
up to class 8. 16,7%
Child mortality Any child has died in the family. 16,7% Nutrition Any adult or child for whom there is
nutritional information is malnourished. 16,7% Electricity The household has no electricity. 5,6%
Sanitation
The household’s sanitation facility is not improved (according to MDG guidelines), or it is improved but shared with other
households.
5,6%
Water
The household does not have access to safe drinking water (according to MDG guidelines) or safe drinking water is more than a 30-minute walk from home, roundtrip.
5,6%
Flooring The household has a dirt, sand or dung floor. 5,6% Cooking Fuel The household cooks with dung, wood or
charcoal. 5,6%
Assets
The household does not own more than one radio, TV, telephone, bike, motorbike or refrigerator and does not own a car or truck.
5,6% Education
Health
Living Standard
Table 3: MPI Indicators (ALKIRE and SANTOS, 2010)
no information about them in the 2004 PNAD. Moreover, households that did not have at least three, and not one, of them were considered needy in this indicator.
The MPI, however, was meant to calculate the number of people who suffer from multiple deprivations throughout the world, such that its parameters are mainly based on the reality of the poorest countries, as highlighted in UNDP (2010): “Immediately apparent is that the MPI is most appropriate for less developed countries. It captures the widespread deprivations in South Asia and Sub-Saharan Africa and in the poorest Latin American countries” (UNDP, 2010, p. 95). For Brazil nowadays, however, this standard may be very low: even in 2004, access to electricity was already almost universal and the infrastructure of the large majority of homes, in terms of material for walls and roofs, was already adequate. Moreover, the indicator of child mortality that was calculated based on the PNAD applies to few households, such that, in total, we found a small proportion of individuals who are needy in this aspect, though child mortality is still significant in Brazil.
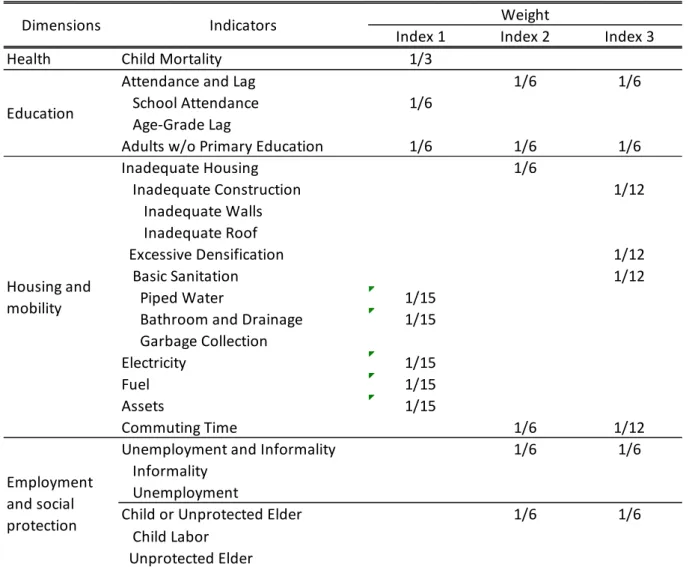
Two other indicators were tested in order to construct an index that is more adequate for the Brazilian reality, which involves goals that mean really significant progress for the poorest portion of the population. The structure of the three indexes is presented in Table 4. It is worth highlighting that the concept of inadequate housing that was adopted, which includes building material, excessive densification of residents, and basic sanitation, was elaborated based on IBGE (2004) and OSORIO et al. (2011). For the three indexes, the cut-off line in relation to the level of deprivation was k=1⁄3, according to common procedure adopted in the literature.
5. Results
5.1 Three Multidimensional Poverty Indexes
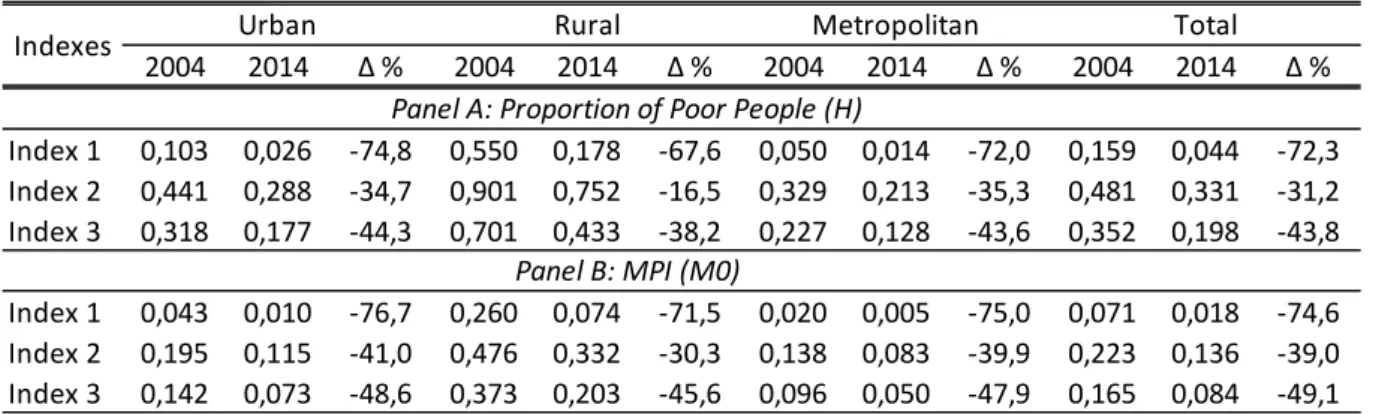
The proportion of poor people and the multidimensional poverty index (𝑀0) are presented for the three methodologies, for the years of 2004 and 2014, and according to household location in Table 5.
Index 1 Index 2 Index 3
Health Child Mortality 1/3
Attendance and Lag 1/6 1/6
School Attendance 1/6
Age-Grade Lag
Adults w/o Primary Education 1/6 1/6 1/6
Inadequate Housing 1/6 Inadequate Construction 1/12 Inadequate Walls Inadequate Roof Excessive Densification 1/12 Basic Sanitation 1/12 Piped Water 1/15
Bathroom and Drainage 1/15 Garbage Collection
Electricity 1/15
Fuel 1/15
Assets 1/15
Commuting Time 1/6 1/12
Unemployment and Informality 1/6 1/6
Informality Unemployment
Child or Unprotected Elder 1/6 1/6
Child Labor Unprotected Elder Source: Elaborated by authors.
Weight
Employment and social protection
Table 4: Calculation of the Multidimensional Poverty Indexes
Education
Housing and mobility
In all regions and for the two results (H and M0), multidimensional poverty fell more according to index 1, which decreased around 70%. This is also the index that identifies the lowest proportion of poor people: according to it, in 2014 only 4.4% of the Brazilian population was poor, an amount that seems extremely low considering the challenges that we still face in the field of multiple deprivations of individuals.
On the other hand, index 2 is the highest of all: it identifies 33.1% poor people in 2014 and was that which least fell in the period in question. For rural areas, index 2 seems extremely rigorous, resulting in a proportion of poor people of 90.1% and 75.2% in 2004 and 2014, respectively. This happens due to the large weight that this index gives to the issue of adequate housing, considering as needy any household that does not have adequate material on the walls and roof, and that has excessive densification of residents or that does not have basic sanitation, attributing a weight of 1 6⁄ to this dimension. According to PNAD data, 96% and 92% of the residents in rural areas in 2004 and 2014, respectively, were suffering deprivation in this aspect. Basic sanitation is the main problem in this regard, since it is difficult and more expensive to take piped water, adequate sewage drainage, and regular garbage collection to regions that are less densely populated. It is important to note the fact that very little progress has been made in this area, which involves serious health and environmental problems for these locations. It was opted to not ease the criterion of adequate housing for rural areas, understanding that to guarantee these conditions to all Brazilians is fundamental. Therefore, to better differentiate the neediest people in all locations (since index 2 discriminates little the groups of poor people and non-poor people in rural areas), we have subdivided the indicator of adequate housing in index 3, maintaining the criteria but attributing a lesser weight to each indicator separately. According to indicator 3, 19.8% of the population was poor, and in 2014, there was a drop of 43.8% in relation to the proportion identified in 2004.
2004 2014 Δ % 2004 2014 Δ % 2004 2014 Δ % 2004 2014 Δ % Index 1 0,103 0,026 -74,8 0,550 0,178 -67,6 0,050 0,014 -72,0 0,159 0,044 -72,3 Index 2 0,441 0,288 -34,7 0,901 0,752 -16,5 0,329 0,213 -35,3 0,481 0,331 -31,2 Index 3 0,318 0,177 -44,3 0,701 0,433 -38,2 0,227 0,128 -43,6 0,352 0,198 -43,8 Index 1 0,043 0,010 -76,7 0,260 0,074 -71,5 0,020 0,005 -75,0 0,071 0,018 -74,6 Index 2 0,195 0,115 -41,0 0,476 0,332 -30,3 0,138 0,083 -39,9 0,223 0,136 -39,0 Index 3 0,142 0,073 -48,6 0,373 0,203 -45,6 0,096 0,050 -47,9 0,165 0,084 -49,1
Source: Elaborated by authors based on National Household Sample Survey (PNAD) data.
Table 5: Multidimensional Poverty Indexes According to Location Indexes
Panel A: Proportion of Poor People (H)
Panel B: MPI (M0)
With respect to household location, multidimensional poverty (in terms of proportion of poor people and MPI) is always greater in rural areas and less in urban areas. These differences deepened over the course of the period, since multidimensional poverty fell more in the latter and less in the former. For the three indexes, the MPI fell more than the proportion of poor people, which indicates that, even among poor people, there was important progress in the direction of reducing the number of deprivations they suffer.
Based on these results, index 3 seems to be the most adequate for the current Brazilian population, discriminating well a portion of the population (around 1 5⁄ in 2014) that suffers from multiple deprivations and covering dimensions that may be directly influenced by public policies. It will be used in the analyses done from here on. It is interesting that multidimensional indicators of poverty are adapted over time to country performances, such that to offer a better standard of living for the neediest is always held in sight. The indicator developed by OPHI and used by the UN is interesting in its methodology and to reduce it means a great challenge for the poorest countries. For Brazil, however, to use it involves maintaining expectations very low, adopting unambitious goals, and therefore, aspiring for insignificant improvements for its population. Even for the poorest countries, a rapid overcoming of the Millennium Development Goals, and consequently, a reduction of the MPI based on them, is urgent. Once this is done, a review of the indicators and of the weights that compose the index is fundamental in order to make it a more ambitious objective.
5.2 Decompositions According to Household Location and Index Dimensions
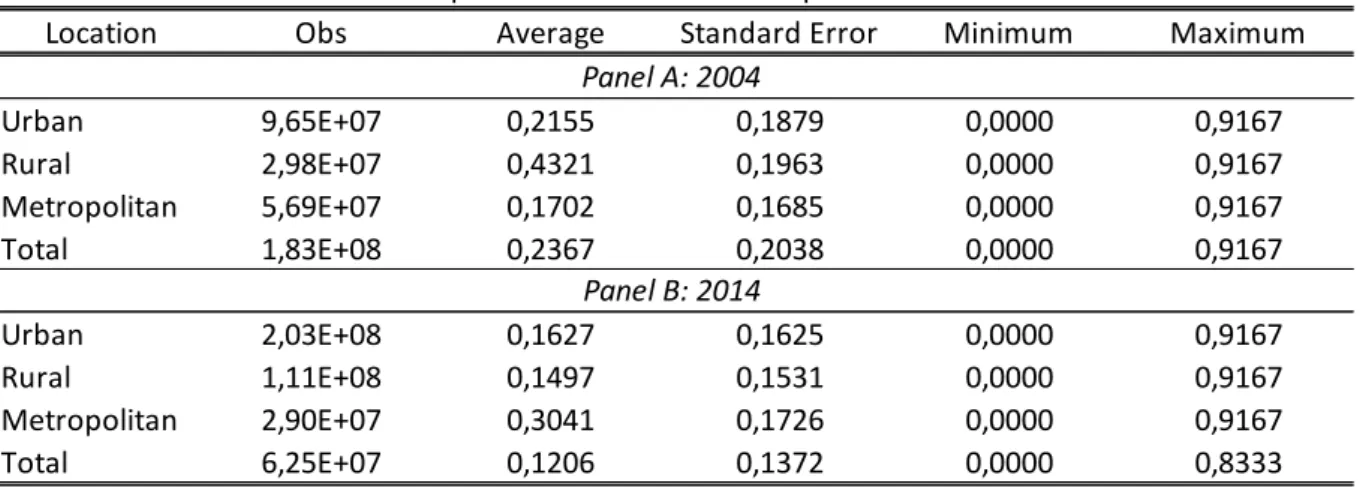
Once index 3 is chosen to analyze multidimensional poverty in Brazil, some additional analyses are done as follows. In Table 6, descriptive statistics are presented of the level of deprivation (from 0 to 1) obtained based on the indicators and on the people who compose this index (𝑐𝑖).
In 2004, the average deprivation level was 0.2367 for the Brazilian population as a whole. The greatest level of deprivation was observed in rural areas, equal to 0.4321, an amount that exceeded the cut-off line for multidimensional poverty (0.3333). The lowest level of deprivation, meanwhile, was that of metropolitan areas, 0.1702. In 2014, the ranking of the regions was maintained, the average level of deprivation having fallen by around 30% in all of them. For Brazil, it was equal to 16.25 this past year. Some individuals did not present any type of deprivation in their households: they were 24.60% in 2004 and 34.02% in 2014. Nobody presented need in all of the indicators in question.
As for the contribution of each location to the multidimensional poverty index, it is observed in Table 7 that urban areas, due to their large share in the population total, answers for almost half of the amount both of the proportion of poor people and of the MPI. Their contribution grew between 2004 and 2014, due to the increase in the proportion of people living in non-metropolitan cities. Rural areas, for their part, contribute to the proportion of poor people
Location Obs Average Standard Error Minimum Maximum
Urban 9,65E+07 0,2155 0,1879 0,0000 0,9167 Rural 2,98E+07 0,4321 0,1963 0,0000 0,9167 Metropolitan 5,69E+07 0,1702 0,1685 0,0000 0,9167 Total 1,83E+08 0,2367 0,2038 0,0000 0,9167 Urban 2,03E+08 0,1627 0,1625 0,0000 0,9167 Rural 1,11E+08 0,1497 0,1531 0,0000 0,9167 Metropolitan 2,90E+07 0,3041 0,1726 0,0000 0,9167 Total 6,25E+07 0,1206 0,1372 0,0000 0,8333 Panel A: 2004 Panel B: 2014
Source: Elaborated by authors based on National Household Sample Survey (PNAD) data.
Table 6: Descriptive Statistics: Level of Deprivation - Indicator 3
Year Urban Rural Metropolitan Total
2004 52,7 16,3 31,0 100,0 2014 54,9 14,3 30,8 100,0 2004 0,476 0,324 0,200 1 2014 0,490 0,311 0,199 1 2004 0,452 0,367 0,181 1 2014 0,473 0,343 0,184 1
Table 7: Decomposition of Index 3 According to Household Location
Panel A: Distribution of the Population (%)
Panel B: Proportion of Poor People (H)
Panel C: MPI (M0)
and the MPI with a portion that is much greater than their share in the population, since they are the locations where poverty in multidimensional terms is more serious. Finally, metropolitan regions have the smallest share in the index, an amount that decreased in the period.
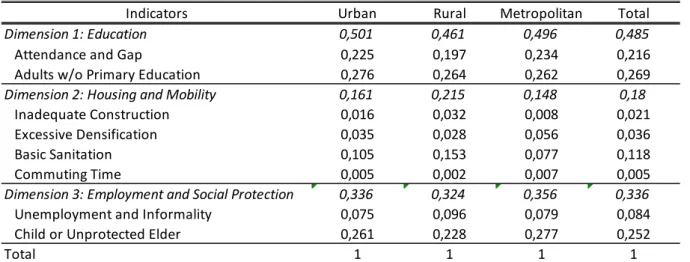
Tables 8 and 9 present the decomposition of the MPI according to the contributions of each indicator/dimension, for each of the years in question.
The contribution of each indicator to the multidimensional poverty index (MPI) also presented changes between 2004 and 2014. In both years, the “education” dimension was what contributes most, however its share fell a little from 48.5% to 46.8%. In urban areas it is even more relevant, explaining half of the index in 2004 and 48.3% in 2014.
Indicators Urban Rural Metropolitan Total
Dimension 1: Education 0,501 0,461 0,496 0,485
Attendance and Gap 0,225 0,197 0,234 0,216
Adults w/o Primary Education 0,276 0,264 0,262 0,269
Dimension 2: Housing and Mobility 0,161 0,215 0,148 0,18
Inadequate Construction 0,016 0,032 0,008 0,021
Excessive Densification 0,035 0,028 0,056 0,036
Basic Sanitation 0,105 0,153 0,077 0,118
Commuting Time 0,005 0,002 0,007 0,005
Dimension 3: Employment and Social Protection 0,336 0,324 0,356 0,336
Unemployment and Informality 0,075 0,096 0,079 0,084
Child or Unprotected Elder 0,261 0,228 0,277 0,252
Total 1 1 1 1
Source: Elaborated by authors based on National Household Sample Survey (PNAD) data.
Table 8: Decomposition of Index 3 by Indicators - 2004 (M0)
Indicadores Urban Rural Metropolitan Total
Dimension 1: Education 0,483 0,446 0,468 0,468
Attendance and Gap 0,211 0,175 0,232 0,203
Adults w/o Primary Education 0,272 0,271 0,236 0,265
Dimension 2: Housing and Mobility 0,138 0,227 0,126 0,166
Inadequate Construction 0,015 0,031 0,008 0,019
Excessive Densification 0,028 0,025 0,039 0,029
Basic Sanitation 0,09 0,169 0,066 0,112
Commuting Time 0,005 0,002 0,013 0,006
Dimension 3: Employment and Social Protection 0,379 0,328 0,405 0,366
Unemployment and Informality 0,11 0,102 0,12 0,109
Child or Unprotected Elder 0,269 0,226 0,285 0,257
Total 1 1 1 1
Source: Elaborated by authors based on National Household Sample Survey (PNAD) data.
The dimension related to housing and mobility had its share reduced, except in rural areas, where it increased slightly. This happened mainly due to the increase of basic sanitation deprivation in the index, which suggests that, in this aspect, the evolution was worse than in the others. Commuting time between home and work is not very relevant for any of the locations, but its share in the index is much greater in metropolitan regions, where it almost doubled in the period. Urban mobility is an urgent and growing issue in Brazilian big cities. It is worth affirming that it was considered that an individual suffers from deprivation in this aspect if a person from his or her household takes more than two hours to commute to work, which is a significant amount of time, keeping in mind that the total daily trajectory (round trip) represents more than half of the normal work day (8 hours). Moreover, only people who have a job that compensates such an effort and expense commute, such that this indicator does not identify another type of deprivation: that of people who are not even able to have a job due to issues related to urban mobility.
Finally, the employment and social protection dimension was the one that increased its share, due to the increase in the contribution of “unemployment and informality” by the household head. Initially, this result contrasts with the fact that the period was marked by the reduction in unemployment rates and the increase in formalization. This happens for two reasons. In the first place, here we are considering only the occupational status of the household head. Moreover, as Table 1 shows, both indicators improved in the period for household heads, especially the issue of formalization. Such an improvement, nonetheless, was less significant than that of other indicators.
5.3 Comparison with Income Poverty
The concepts of income poverty and multidimensional poverty are more complementary than substitutes. Income is a means through which individual freedoms are guaranteed and not an end in itself (SEN, 2000). However, other aspects (or capabilities, using the author’s definition), related to education, health, civil rights, security, mobility, etc. are also important. In general, the two types of poverty present a substantial degree of correlation, but there are important differences. Particularly, there are public policies that affect each type of deprivation differently.
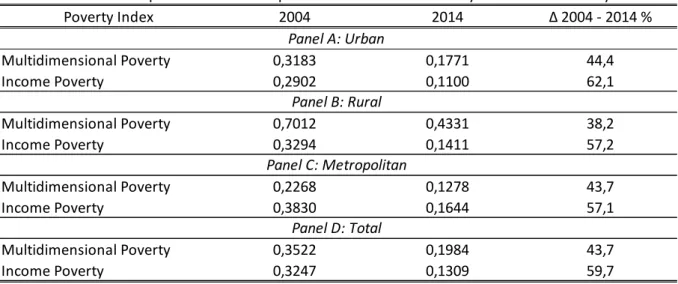
Table 10 presents the proportion of poor people according to the two concepts. The definition of income poverty is presented by ROCHA (1997), who defines lines differentiated by state and household location (urban, rural, or metropolitan areas), according to a basic basket
of goods consumed by the poorest portion of the population in the region and to the local level of prices. The multidimensional poverty index, meanwhile, is also index 3, which was presented beforehand.
In Brazil, multidimensional poverty was greater than income poverty in both years. This means that, according to the indicators considered, the population suffered more from other types of need, such as access to education, household infrastructure, and lack of social protection and productive inclusion, than from insufficient income. Only in metropolitan regions is the situation inverse. In these areas, the supply of urban services is much greater, such that multidimensional poverty is less. On the other hand, the high cost of living, and consequently the higher poverty line, makes income poverty a more frequent phenomenon. Besides being more difficult to overcome via the job market, an important issue is that the amount of the benefits from Bolsa Família, the greatest welfare benefit in terms of numbers of beneficiaries, is not enough to guarantee a level of basic consumption in these areas.
In all locations, the drop in income poverty was much more significant than the drop in multidimensional poverty. The former fell a little less than 60%, especially in non-metropolitan urban areas. The latter, meanwhile, fell almost 44%, the rural areas having presented the worst performance.
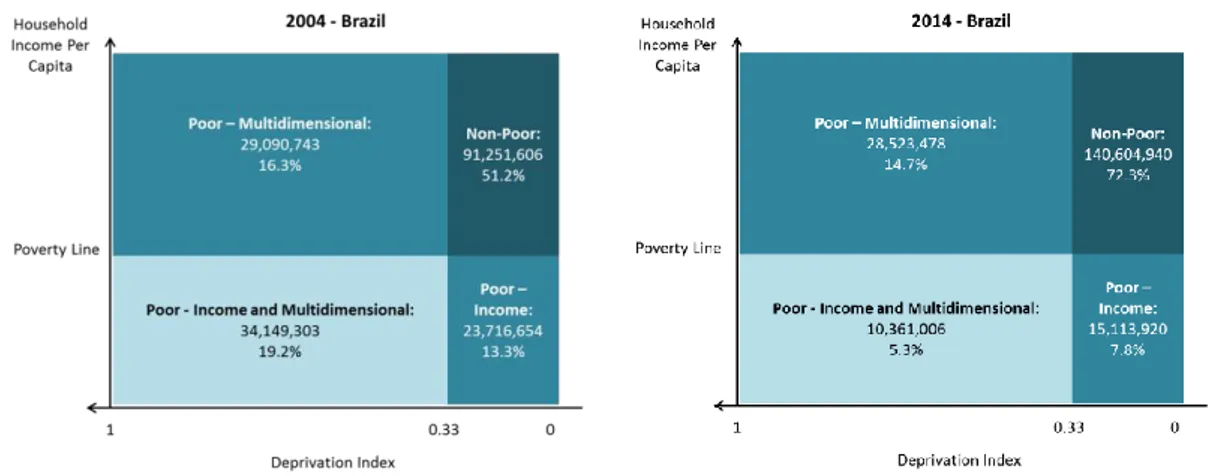
Finally, it is interesting to verify the points of intersection between the two types of poverty. That is what is shown in Figure 1, with the data from Brazil for the years of 2004 and 2014. Poverty Index 2004 2014 Δ 2004 - 2014 % Multidimensional Poverty 0,3183 0,1771 44,4 Income Poverty 0,2902 0,1100 62,1 Multidimensional Poverty 0,7012 0,4331 38,2 Income Poverty 0,3294 0,1411 57,2 Multidimensional Poverty 0,2268 0,1278 43,7 Income Poverty 0,3830 0,1644 57,1 Multidimensional Poverty 0,3522 0,1984 43,7 Income Poverty 0,3247 0,1309 59,7
Source: Elaborated by authors based on National Household Sample Survey (PNAD) data.
Table 10: Proportion of Poor People: Multidimensional Poverty and Income Poverty
Panel A: Urban Panel B: Rural Panel C: Metropolitan
Figure 1 – Multidimensional Poverty versus Income Poverty – Brazil, 2004 and 2014
Source: Elaborated by authors based on data from the National Household Sample Survey (PNAD/IBGE) of 2004 and 2014.
In 2004, only a little more than half of the Brazilian population did not suffer from any of the two types of poverty. Meanwhile, 19.2% of the population, a little more than 34 million people, suffered from both. 16.3% were poor only in terms of multiple deprivations, while a smaller proportion, 13.3%, was poor in terms of insufficient income, but not of other deprivations. In 2014, the proportion of people who did not conform to any of the poverty profiles was much greater: 72.3%. There was a strong drop in the proportion of poor individuals in both senses (5.3%) and poor people only according to the concept of income (7.8%), but not of those who were poor only in multidimensional terms (14.7%), which reinforces the hypothesis that this type of poverty is more resistant to circumstantial transformations and requires more specific public policies.
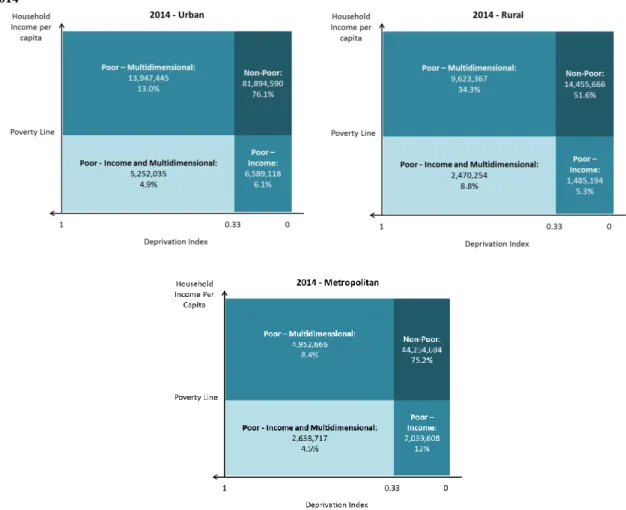
Figure 2 presents the same results for the year of 2014, now separating non-metropolitan urban, rural, and metropolitan areas.
Figure 2 - Multidimensional Poverty versus Income Poverty – Brazil, Urban, Rural, and Metropolitan Areas, 2004 and 2014
Source: Elaborated by authors based on data from the National Household Sample Survey (PNAD/IBGE) of 2014.
The data reveals similar proportions of non-poor people in both senses or poor people in both senses for urban and metropolitan areas. However, income poverty in the strict sense is more common in the latter, while multidimensional poverty in the strict sense is greater in the former. In rural areas, poverty restricted to lack of income is less than that in the other areas (5.3%), while the lack in the other dimensions, besides income, is much more frequent (34.3%). This result reflects the low income poverty lines attributed to rural areas as a result of their lower cost of living. These lines are easily exceeded by means of the benefits received in the scope of social welfare, especially Bolsa Família, and social security. On the other hand, promoting access to educational and public services (water and treated sewage, garbage collection, etc.) is more difficult and expensive in these regions, which end up being overlooked by governments with regard to some types of investments. Non-poor people represent a little more than half of the population in these areas in 2014.
6. Final Considerations
The analysis of poverty in its various forms in Brazil in the beginning of the 2000s shows different evolutions depending on the dimension considered, distinguishing aspects that were more or less successful in fighting poverty during this period. Indicators related to electricity, assets, school attendance and child labor were the ones that had the best performances. On the other hand, lack of basic sanitation and unemployment of household heads fell less than other dimensions.
The multidimensional poverty index based on UN definitions reveals very low multidimensional poverty in Brazil. Therefore, we proposed three indexes and we analyze index 3. School attendance has the greatest contribution to the proposed multidimensional poverty index. The contribution of “housing and mobility” fell, while the contribution of “employment and social protection” increased.
Multidimensional poverty is greater than income poverty in Brazil in both years, 2004 and 2014, especially in rural areas. In metropolitan regions, income poverty is higher, due to the high costs of living and better access to public services and urban infrastructure. Income poverty fell more than multidimensional poverty (index 3) during these years.
This picture of the characteristics and evolution of multidimensional poverty compared to monetary poverty reveals that public policies to combat poverty must consider it in its multidimensionality in order to be more effective. In this sense, the information from the National Register for Social Programs (like Bolsa Familia) allows for the consideration of other dimensions than income deprivation.
Finally, considering the different performances of the various dimensions points to different types of resources and public policies. For instance, the lower performance in dimensions such as basic sanitation and commuting time, which tends to be increasing, especially in metropolitan regions, suggests that more investments and an appropriate allocation of resources are necessary.
BIBLIOGRAPHICAL REFERENCES:
ALKIRE, S. FOSTER, J. Counting and Multidimensional Poverty Measures. Journal of Public Economics, nº 95, p. 476-487. 2010.
ALKIRE, S. SANTOS, M. E. Acute Multidimensional Poverty: A New Index for Developing Countries. OPHI Working Paper, nº 38. Jul. 2010.
ALKIRE, S.; SETH, S. Multidimensional Poverty Reduction in India between 1999 and 2006: Where and How? World Development, v. 72, p. 93–108. 2015.
ATKINSON, A. B. Multidimensional deprivation: contrasting social welfare and counting approaches. Journal of Economic Inequality, 1, p. 51–65. 2003.
BOURGUIGNON, F.; CHAKRAVARTY, S. R. The measurement of multidimensional poverty. Journal of Economic Inequality, 1, p. 25–49. 2003.
FAHEL, M.; TELES, L.; CAMINHAS, D. Pobreza Multidimensional no Brasil: uma análise de sua incidência, intensidade e índice. Fundação João Pinheiro, 2015. Acesso em 28 de outubro de 2016. Disponível em: http://www.fjp.mg.gov.br/index.php/publicacoes-pesquisa-saude-politicas-publicas .
Instituto Brasileiro de Geografia e Estatística (IBGE). Indicadores de desenvolvimento sustentável - Brasil 2004: Dimensão social – Habitação. 2004.
OSORIO, R. G.; SOUZA, P. H. G. F.; SOARES, S. D.; OLIEIRA, L. F. B. Perfil da pobreza no Brasil e sua evolução no período 2004-2009. IPEA, Texto para discussão, 1647. Brasília, ago. 2011.
United Nations Development Program (UNDP). The Real Wealth of Nations: Pathways to Human Development. Human Development Report 2010. 2010
Secretaria de Avaliação E Gestão da Informação (SAGI) - Ministério do Desenvolvimento Social e Combate à Fome (MDS). Pobreza Multidimensional: subsídios para discussão à luz do MPI/OPHI. Estudo técnico, nº 9. 2014.
Scientific Coordinator : Xavier Oudin ([email protected]) Project Manager : Delia Visan ([email protected])
Find more on www.nopoor.eu Visit us on Facebook, Twitter and LinkedIn