DIAL • 4, rue d’Enghien • 75010 Paris • Téléphone (33) 01 53 24 14 50 • Fax (33) 01 53 24 14 51 E-mail : [email protected] • Site : www.dial.prd.fr
D
OCUMENT DE
T
RAVAIL
DT/2004/05
Perspectives on growth
and poverty reduction in Mali
Mohamed Ali MAROUANI
Marc RAFFINOT
PERSPECTIVES ON GROWTH AND POVERTY REDUCTION IN MALI1 Mohamed Ali Marouani
DIAL – UR CIPRE de l’IRD Université de Paris-Dauphine – EURIsCO
[email protected] Marc Raffinot DIAL – UR CIPRE de l’IRD
University Paris Dauphine, EURIsCO
Document de travail DIAL / Unité de Recherche CIPRÉ
Septembre 2004
RÉSUMÉ
Depuis la dévaluation de 1994, le Mali a renoué avec la croissance, sans que cela n’entame significativement l’incidence de la pauvreté – ce qui s’explique notamment par la forte inégalité des revenus qui s’est accrue sur la période récente. Le Cadre Stratégique de Lutte contre la Pauvreté mise surtout sur l’accroissement de l’offre d’éducation primaire et de santé de base. Ces stratégies risquent de n’avoir pas tous les effets escomptés. Il n’est pas sûr que l’accroissement des sommes allouées à ces secteurs se traduise par une amélioration des services publics et que la demande d’éducation (notamment des pauvres) suive l’évolution de l’offre. Il n’est pas évident non plus que les plus pauvres soient en mesure de mettre à profit ces accroissements pour améliorer leurs conditions de vie. La quasi-totalité des très pauvres sont ruraux, incapables d’améliorer durablement leurs revenus agricoles en les diversifiant, du fait de leurs faibles moyens et de leurs difficultés d’accès au crédit. Dans une perspective dynamique, une politique de redistribution en faveur des plus pauvres leur permettrait d’investir en capital humain pour préparer leur migration vers des secteurs où les rendements sont plus élevés – ce qui suppose en même temps des politiques volontaristes de créations d’emplois et de facilitation d’accès au crédit dans les villes.
Mots-clé : Politiques de croissance pro-pauvres, lutte contre la pauvreté, DSRP, Mali. ABSTRACT
Since the 1994 devaluation, growth resumed in Mali without any significant decrease of poverty. This may be explained by the high level of inequality, which has increased in the recent period. The poverty reduction strategy described in the PRSP relies mainly on increasing the supply of primary education and basic health. This strategy is not likely to attain its objectives. Increasing the budgetary allocation of these sectors is not enough to improve the quality of public services and the demand of education (especially of the poorest) will not necessarily increase with its supply. Moreover, the poorest are not likely to grasp the benefits in order to improve their living conditions. The poorest are rural, unable to diversify their agricultural income due to their weak assets and their difficulty to access credit. In a dynamic approach, a redistributive policy could give them the opportunity to invest in human capital before migrating to other sectors where returns to education are higher. However, this would work only if active policies in terms of job creations and access to credit are implemented in the urban areas.
Keywords: Pro-poor growth policies, poverty reduction, PRSP, Mali.
1
The authors gratefully acknowledge the support of the Deutsche Gesellschaft für Technische Zusammenarbeit (GTZ). The views expressed here are those of the authors and do not necessarily represent those of the GTZ. We thank Ulrike Männer; Helmut Asche, Achim Blume, Joseph Brunet-Jailly and Philippe de Vreyer for their helpful comments on previous drafts of this paper. We are responsible for the remaining errors.
Contents
INTRODUCTION ... 8
1. PRO-POOR GROWTH ... 9
1.1. Is growth enough for poverty reduction? ... 9
1.2. What do we mean by pro-poor growth? ... 9
1.3. Regional and multidimensional aspects of poverty ... 10
1.4. Channels of transmission between growth and poverty ... 10
2. GROWTH AND POVERTY REDUCTION IN MALI: WHAT WENT WRONG?... 11
2.1. An impressive growth record ... 11
2.2. Has the increasing poverty trend been reversed? ... 14
2.2.1. Trends according to official figures and poverty profile ... 14
2.2.2. Who are the poor? ... 15
2.2.3. Critics and other studies ... 16
2.2.4. Spatial repartition of poverty ... 17
2.2.5. Evolution of inequality ... 18
2.2.6. The quality of information... 18
2.3. Sound macro-policies have not been effective in poverty alleviation ... 18
2.3.1. A long standing commitment to reform... 19
2.3.2. The impact of reforms ... 23
2.3.3. Democracy and governance: empowering the poor?... 25
2.4. Why growth has not been pro-poor? ... 26
2.4.1. Do the poor benefit from social sectors? ... 26
2.4.2. Has aid been ineffective?... 28
2.4.3. An ambiguous impact of migrants’ remittances? ... 28
2.4.4. Links between agricultural production, productivity, prices and farmers’ income... 29
2.4.5. Increasing inequality in the rural sector... 33
2.4.6. Employment ... 34
2.4.7. Environment and internal migration: is the current pattern of growth sustainable? ... 35
3. IS IT POSSIBLE TO MAKE POLICIES MORE EFFECTIVE FOR POVERTY ALLEVIATION? ... 37
3.1. Is more growth realistic? Potential Growth... 37
3.2. Actual growth is not enough to induce poverty alleviation. What is the way ahead: more poor-targeted growth policies? ... 40
3.3. Tax policies and Redistribution... 41
3.4. Making Openness Work in Mali ... 42
3.5. Rural development and poverty alleviation... 42
3.5.1. Diversification ... 43
3.5.2. A case for public intervention... 43
3.5.3. Property rights ... 44
3.5.4. Credit ... 44
3.5.5. Prices, liberalization, risks of increasing inequality ... 45
3.6. Industrial policies ... 45
3.8. Improving Health care: any benefits for the poor?... 48
3.9. Gender Inequality... 48
4. IS THE INSTITUTIONAL FRAMEWORK POOR FRIENDLY? ... 48
4.1. Political economy of poverty reduction ... 49
4.2. Weak capacity of policy design and implementation ... 49
4.3. Decentralization ... 50
4.4. Did IFIs really break with Structural Adjustment? ... 50
4.5. Did Donors improve their co-ordination? ... 50
4.6. The PRSP: business as usual? ... 51
4.7. The need for data on a sustainable basis ... 52
4.8. Is institution building enough for poverty reduction? ... 52
CONCLUSION ... 52
BIBLIOGRAPHY... 55
APPENDICES... 61
List of tables
Table 1: Sectoral breakdown of real growth (1992-2000, billion of 1987 constant CFA F) ... 12Table 2: Contributions to growth (1994-2000) ... 13
Table 3: Poverty trends (1989-1999) ... 14
Table 4: Distribution of Major Income Sources in the Opération Haute Vallée (OHV) Area by Sub region* . 15 Table 5: Income sources across income per capital quartiles 1994-95-95/96 ... 16
Table 6: Spatial repartition of poverty and HDI ... 17
Table 7: Mali, decomposition of changes in “poverty” between 1987 and 1995... 17
Table 8: Structural Adjustment Reforms in Mali... 20
Table 9: Public Finance and Balance of Payments... 25
Table 10: consumption price index (1990-2001)... 25
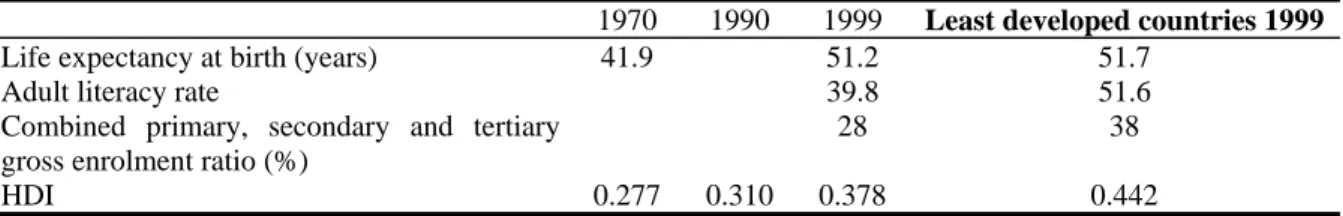
Table 11: Mali social indicators and HDI ... 27
Table 12: Aid as a % of GDP ... 28
Table 13: Agricultural production (in thousand of metric tons) ... 29
Table 14: Cereal production: volume and value ... 31
Table 15: Increase of income by type of farms in Southern Mali, (F CFA, current values)... 33
Table 16: Employment in Mali (1997)... 34
Table 17: Urbanization in Mali (1960-2020) ... 36
Table 18: PRSP growth prospects... 39
Table 19: Scenarios 1997-2006, breakdown of sectoral growth and contributions to growth... 39
Table 20: Government revenue and its components’ evolution 1995-2000, billions CFA F... 41
Table 21: Impact of a increase of expenditure in education in Mali (2% of GDP)... 47
List of graphs
Graph 1: GDP and Agriculture growth rates in Mali (1986-2000)... 11
Graph 2: Rainfall in the Sahel 1950-2000... 13
Graph 3: Yields of the main cultivated cereals in Mali (1961-2001) ... 30
Graph 4: Productivity of cereals in Mali (1980-2001) ... 30
Graph 5: Terms of trade of agriculture (1987=100) ... 32
Graph 6: Prices of cereals deflated by the import prices index (1985=100) ... 32
Graph 7: Yields of Seed Cotton ... 35
List of boxes
Box 1: The 3 axes of the PRSP ... 38List of appendices
Appendix 1: Determinants of agricultural production... 61List of acronyms
ACP : Africa Caribbean Pacific (Countries associated with EU)
ADS : Agence du Développement Social (Safety Net Agency)
AGETIPE : Agence d’Exécution des Travaux d’Intérêt public (Authority for public works)
BDM : Banque de développement du Mali
BNDA : Banque Nationale de Développement Agricole (Agricultural Development
Bank)
BoP : Balance of Payments
CAPE : Cellule d’analyse de la politique économique (ACBF supported).
CCA/ONG : Organisation for the co-ordination of NGOs’ activities (Comité de coordination des actions des ONG).
CFA F : CFA Franc = Franc for the African Financial Community (1FF is CFA F100, 1$
is CFA F 750)
CIRAD : Centre International pour la Recherche Agricole pour le Développement
CMDT : Compagnie Malienne de développement des textiles (Malian Company for
Cotton and Textiles development)
CPI : Consumption Price Index
CPS : Statistical Unit (Cellule de Planification et de Statistique)
CSLP : Cadre stratégique de lutte contre la pauvreté (French acronym for PRSP)
CSCOM : Community health-care centre (Centre de santé communautaire)
CSO : Civil society organisation
DAC/OECD : OECD Development Assistance Committee
DFS : Decentralized Financial Systems
DHS : Demographic and Health Survey
DIAL : Développement et Insertion International, European Scientific Institute.
DNSI : National Office of Statistics (Direction Nationale de la Statistique et de
l’Informatique)
EDM : Energie du Mali
EMEP : Enquête Malienne d’évaluation de la pauvreté (Poverty Evaluation Malian
Survey)
ESAF : Enhanced Structural Adjustment Facility
EU : European Union
FAO : Food and Agricultural Organization (UN)
GoM : Government of Mali
GDP : Gross Domestic Product
HDI : Human Development Index
HIMO : Programme d’investissement àHaute Intensité de Main d’Oeuvre (Employment
Intensive Investment Programme)
HIPC : Highly Indebted Poor Countries (debt-relief initiatives)
ICOR : Incremental Capital Output Ratio
IDA : International Development Association (WB)
IFI : International Financial Institution
ILO : International Labor Organisation
IMF : International Monetary Fund
IPRSP : Interim Poverty Reduction Strategy Paper
LDCs : Least Developed Countries
MoEF : Ministry of Economy and Finance
MEPI : Ministry of Economy, Planning and Integration
MDSSPA : Ministry of Social Development, Solidarity and the Senior Citizens
MTEF : Medium-Term Expenditure Framework
NFA : Net Foreign Assets
NGO : Non-governmental organisation
ODHD : Sustainable Human Development Unit (Observatoire du Développement
ODR : Office de développement rural
OHADA : Organisation d’Harmonisation du Droit des Affaires (Business Law
Harmonisation Bureau)
PAIB : Projet d’appui aux initiatives de base (Grass-Root Initiative Project - GRIP)
PFP : Policy Framework Paper
PRECAGED : Programme de renforcement des capacités nationales pour une gestion
stratégique du développement (UNDP-supported Programme for strengthening the national management of strategic development)
PRGF : Poverty Reduction and Growth Facility (ex ESAF)
PRMC : Projet de Réforme du Marché céréalier (Cereal Market Reform Project)
PRODEC : Ten-year education programme
PRODEJ : Programme de développement de la justice (Justice development programme)
PRODESS : Programme de développement socio-sanitaire (Programme for social and health
Development, 1998-2002).
PRSC : Poverty Reduction Support Credit (WB)
PRSP : Poverty Reduction Strategy Paper
RMSM : Revised Minimum Standart Model (WB)
SA : Structural Adjustment
SAM : Social Accounting Matrix
SAPRIN : Structural Adjustment Review Participative Initiative
SIDA : Swedish International Development Agency
SNLP : Stratégie Nationale de Lutte contre la Pauvreté (National Strategy to Fight
Poverty)
SYCOV : Cotton producers Trade-Union (Syndicat des producteurs du coton et du vivrier)
SWAP : Sector Wide Approach
TFP : Total Factor Productivity
UNCTAD : United National Conference on Tariffs and Trade
UNDP : United Nations Development Programme
VAT : Value Added Tax
WAMU : West African Monetary Union
WAEMU : West African Economic and Monetary Union
WB : World Bank
WFP : World Food Programme (UN)
INTRODUCTION
In Mali, about 76% of the population is rural and poverty is more prevalent in the rural areas. This means that 81% of the poor and 98% of the poorest live in rural areas. Keeping this in mind, pro-poor growth seems bound to be labor-intensive growth in the agricultural sector.
The development of agriculture could have a dual pay-off since the increase of the agricultural income, benefiting the poor will probably be spent on rural goods and services which also benefit other poor. However, this will be true if a significant part of the agricultural output increase accrues to the poor and not to the richest farmers. In other words, agricultural output growth benefits the poor if it is not followed by an increase in inequality. The weak endowments of poor agricultural households impede them from reaping substantive profits from growth. Moreover, the problem may not be simply a rural one.
Firstly, the potential for growth in some rural regions is very weak due to low population density, resulting in very little spillovers and economies of scale. Transport infrastructures are very limited, and some of them are in very bad condition (railway). The cost of establishing a complete network would be very high, as distances are important. For these reasons, migrations could play a role in poverty alleviation by transferring workers from low-productivity to high productivity sectors. However, this is a hypothesis which does not necessarily hold. Ravallion and Datt (1996) showed in the case of India, that poverty reduction resulted from within sectors growth, and not from intersectoral transfers. The intuition behind it is that poor rural migrants encounter difficulties to integrate urban labor markets, which are already tiny. Migrants would have better chances of taking advantage of globalization if their human and social capital is high.
Secondly, non-agricultural income is likely to be a significant part of the income of the rural population. This means that increasing the urban income could also benefit the rural poor. This is very difficult to assess in the Malian case, because studies about poverty are based on consumption analysis, not income. In Burkina Faso, there is some evidence that in some poor rural regions, non-agricultural income could be more important than non-agricultural (Konaté & Raffinot, 1998). Poor people (men and women) are looking for employment inside or outside agriculture during the dry season. Activities like petty trade, handicrafts, and gold washings are typical. One should add to this income generated by transfers from the urban, which proved to be very significant in Côte d’Ivoire (Mahieu, 1990), and transfers from migrants, which are likely to be very important in Mali given the large number of Malian outside the country (800,000 in Senegal, 380,000 in Côte d’Ivoire2 and 40,000 in France) according to Gubert (2000).
As argued by Cogneau (2002), most poverty reduction strategies are based on aggregate and static views, where efficiency is the main objective. But the dynamic aspects of poverty are very important indeed. The analysis should take into account the complex relationships between growth, inequality and poverty. But we lack information on these dynamics. The comparison between two surveys is not accurate for that purpose. We would need panel data and biographical surveys to be able to say something about social mobility. A recent paper about Burkina Faso (Fofack, Monga & Tuly, 2001), shows that the dynamics might be more complex than expected. The authors establish a lack of concordance in the distribution of welfare across geographical regions over time, but a concordance in rank ordering of socioeconomic groups.
The paper proceeds as follows: section 1 discusses briefly the pro-poor growth concept. Section 2 investigates why growth in Mali has been neither pro-poor nor sustainable. Section 3 investigates if it is possible to make policies more pro-poor and more sustainable, and section 4 if the institutions (including IFIs and donors interventions) allow for such a change.
1. PRO-POOR GROWTH
1.1.
Is growth enough for poverty reduction?The commitment of the international aid community to halving world income poverty by the year 2015 is at the origin of the abundant literature on poverty reduction strategies that has recently emerged. The decision of the international financial institutions (IFIs) to link a debt relief for heavily indebted poor countries to a poverty reduction strategy paper elaboration has enhanced the focus on poverty reduction. Thus, an intense debate started among the different stakeholders involved in development issues (developing countries’ governments, donors’ co-operation agencies, Northern and Southern civil society organizations, academics etc.).
If there seems to be a consensus on the objectives and also on some elements such as education and health being on par with income in assessing poverty, strong disagreements still remain in the policy choices to reduce poverty. As argued by Ravi Kanbur (2001), there are “major disagreements on the pace and sequencing of fiscal adjustment, monetary and interest rate policy, exchange rate policies, trade and openness, external and internal financial liberalization including deregulation of capital flows, privatization of large scale state-owned enterprises etc.”
Two answers have traditionally been given to the key question “how to reduce poverty”. The first, representing mainly IFIs’ views is that growth is the main engine of poverty reduction (Dollar and Kraay, 2000). Indeed, as argued by Danielson (2001), if there is growth, incomes will rise, and thereby income poverty is reduced and non-income indicators of poverty may well be improved as well. However, the second view is that income distribution is a key factor in poverty reduction, and that “growth” alone is not enough to reduce poverty since it is not obvious that macro-economic growth benefits to the poorest part of the population.
In this context, the concept of pro-poor growth seems a good way to reconcile the two views, which are more complementary than it seems at a first glance. Indeed, nobody can argue that economic growth is not needed for poor countries, but without a dynamic redistributive policy, poverty could hardly be addressed.
1.2.
What do we mean by pro-poor growth?The first question to ask is what we exactly mean when talking about pro-poor growth. Is it growth that simply reduces poverty, or growth that benefits relatively more to the poor? Given the heterogeneity of the poor themselves, do we attribute the same weight to those who are close to the poverty line and those who are the poorest among the poor?
This issue has been widely discussed in Ravallion and Chen (2001), Bourguignon (2001) and Klasen (2001). In Klasen’s definition, pro-poor growth means that the “poor benefit disproportionately from economic growth”. In other words, “the proportional income growth of the poor must exceed the average income growth rate”. If we care about the severity of poverty, we can compare average income growth of the poorest quintile with the one of the second quintile. If the former is higher, this means that growth is good for the poorest among the poor.
The impact of growth on poverty depends, in a great extent, on initial inequality. Higher income inequality reduces the impact of growth as the poor are further away from the poverty line and their income increases start from a lower base (Ravallion, 2000). Thus, as argued by Bourguignon (2001), income redistribution has a dual pay-off in poverty reduction. It reduces poverty instantaneously by giving the poor a higher income. In addition, it also contributes to a permanent increase in the elasticity of poverty reduction with respect to growth and therefore to an acceleration of poverty reduction for a given rate of economic growth.
1.3.
Regional and multidimensional aspects of povertyAggregate poverty measures are not sufficient to assess the impact of growth on the poor. Indeed, as shown by Demery (1999), in some countries urban and rural poverty have moved in opposite directions under growth. Even within the rural areas, agricultural growth could benefit to cash-crops’ producers and not to food-crops’ producers, and thus the aggregate effect on rural poverty could be ambiguous, or even negative. By definition, growth refers to constant prices aggregates. But for food crops, an increase in quantities might well be offset by a decrease in prices (King’s law).
Beyond the rural-urban divide, the geographical distribution of poverty can help understanding the link between economic performance and poverty. It seems that poverty is higher in areas far from centers of economic activities, such as big cities or coasts. However, sometimes surveys show some unexpected results, such as the case of the region of Sikasso in Mali (discussed later).
Moreover, as pointed out by Danielson (2001) there is a possibility that, while income poverty decreases, non income poverty worsens. In some countries under structural adjustment, IFIs’ imposed fiscal discipline has induced a deterioration of health and education services in the last decade. So even if the reforms had improved the income of the poorest fraction of the population, the decrease of public goods provision may have worsened their actual living conditions.
Aware of this problem, the new poverty reduction strategies are centered on increasing health and education expenses. However, this IFIs’ switch is not without posing new problems. First the effects of education and health will be seen on the long run, and thus, measures to improve income and provide employment to the poor are still needed. Second, increasing the education and health expenses does not mean necessarily improving their quality and the access of the poor to these services. And finally other basic needs such as water or energy provision must not be put aside while spending all the debt relief resources in health and education services. An effort of public spending prioritization in a multidimensional framework is clearly needed.
1.4.
Channels of transmission between growth and povertyGrowth impacts poverty through direct and indirect effects (Danielson, 2001). Concerning the direct effects, they come from increasing poor people’s output (mainly urban informal and rural), increasing the demand for unskilled labor and increasing the resources of Government which can allow it to expand its poor targeted expenditures.
However, this static vision must not lead us to forget that growth benefiting to skilled labor is also an important issue in the long run, since the increase of the returns to education is the only way to ensure human capital accumulation and thus high and sustainable growth. Thus, it is capital intensive growth that is not pro-poor. Growth biased toward skilled intensive labor does not benefit the poor in the short run, but can have a long run positive pay-off in poverty reduction by playing as an incentive to human capital accumulation. This is of course possible only if the poor have access to education and if the children of poor households are not obliged to quit schools very early for work (to ensure their parents subsistence). In other words, higher returns to education can contribute to poverty reduction if a potential of social mobility exists in the country, and if there is some job creation.
Moreover, a proactive policy of social transfers could allow a redistribution transforming a neutral growth in a pro-poor growth. Mali experienced a significant increase in its tax resources. If these additional resources benefit mainly to the poor, the impact of growth on poverty reduction could be much more important. The value added tax recently implemented is an efficient way for the government to collect taxes at a low cost, but this tax is highly unequal. Improving the capacities of the tax administration could help relying more on income taxes, which are more progressive than the VAT.
The indirect effects of growth on poverty operate through multiplier effects, since the increased incomes generated by growth are spent by those who benefit from it. The incremental income benefiting to the poor will be generally spent on local goods and services (while the rich consume
more imported products). This means that the increase of the income of the poor has a bigger probability to be spent on non tradable goods, and thus benefit to other poor. This is particularly true in the agricultural sector where the increase of food demand could create a virtuous circle in the rural areas, and favor the emergence of non agricultural production in these areas (Danielson, 2001).
2. GROWTH AND POVERTY REDUCTION IN MALI: WHAT WENT WRONG?
We start by analyzing the recent growth and poverty trends. We move then to assessing previous policies to investigate the reasons of the failure of growth in ensuring a significant poverty reduction.
2.1.
An impressive growth recordIn the long run (1960-1996), Malian growth was about 3.1% (Touré, 2001); resulting in a low increase of the income per head (resident population growth was 2.3% for the same period, and natural growth 3.4%). The agricultural growth has been lower, about 2.5%. The share of the agricultural sector in GDP (in a very broad sense, including livestock rearing, fisheries, forestry, etc.) was 67% in 1967 and 48% in 1996.
Graph 1: GDP and Agriculture growth rates in Mali (1986-2000)
Source: DNSI
In the nineties, Mali enjoyed a period of sustained economic growth. Growth was boosted by the devaluation, attaining an average of 5.7% during 1995-20003. While factor accumulation continued to play a large role in the post-devaluation period, total factor productivity growth played an enhanced role, explaining about one-fifth of output growth (Touré, 2001).
3 The National Accounts in Mali are the result of crude estimations of sectoral added values. There is no check by uses (consumption, etc.),
and the deflation is a simple one (not a double deflation of production and inputs). -15,0% -10,0% -5,0% 0,0% 5,0% 10,0% 15,0% 20,0% 25,0% 30,0% 1986 1987 1988 1989 1990 1991 1992 1993 1994 1995 1996 1997 1998 1999 2000
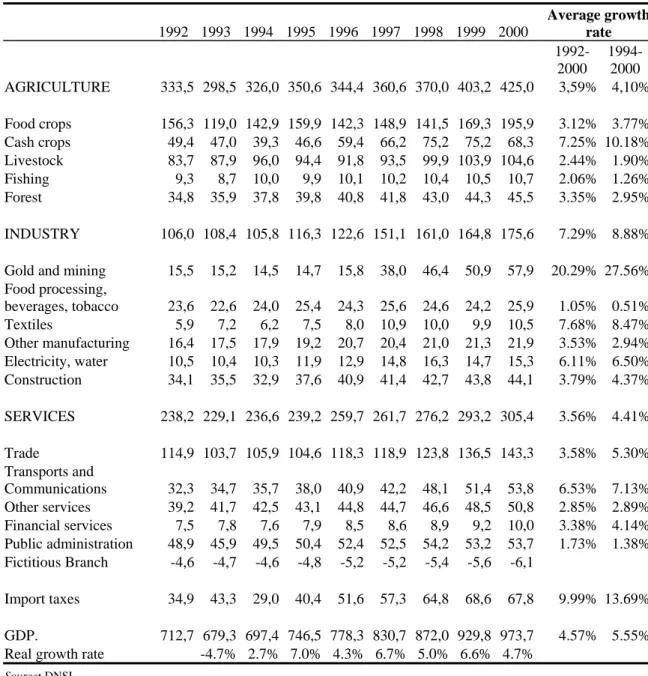
Table 1: Sectoral breakdown of real growth (1992-2000, billion of 1987 constant CFA F) 1992 1993 1994 1995 1996 1997 1998 1999 2000 Average growth rate 1992-2000 1994-2000 AGRICULTURE 333,5 298,5 326,0 350,6 344,4 360,6 370,0 403,2 425,0 3,59% 4,10% Food crops 156,3 119,0 142,9 159,9 142,3 148,9 141,5 169,3 195,9 3.12% 3.77% Cash crops 49,4 47,0 39,3 46,6 59,4 66,2 75,2 75,2 68,3 7.25% 10.18% Livestock 83,7 87,9 96,0 94,4 91,8 93,5 99,9 103,9 104,6 2.44% 1.90% Fishing 9,3 8,7 10,0 9,9 10,1 10,2 10,4 10,5 10,7 2.06% 1.26% Forest 34,8 35,9 37,8 39,8 40,8 41,8 43,0 44,3 45,5 3.35% 2.95% INDUSTRY 106,0 108,4 105,8 116,3 122,6 151,1 161,0 164,8 175,6 7.29% 8.88%
Gold and mining 15,5 15,2 14,5 14,7 15,8 38,0 46,4 50,9 57,9 20.29% 27.56% Food processing, beverages, tobacco 23,6 22,6 24,0 25,4 24,3 25,6 24,6 24,2 25,9 1.05% 0.51% Textiles 5,9 7,2 6,2 7,5 8,0 10,9 10,0 9,9 10,5 7.68% 8.47% Other manufacturing 16,4 17,5 17,9 19,2 20,7 20,4 21,0 21,3 21,9 3.53% 2.94% Electricity, water 10,5 10,4 10,3 11,9 12,9 14,8 16,3 14,7 15,3 6.11% 6.50% Construction 34,1 35,5 32,9 37,6 40,9 41,4 42,7 43,8 44,1 3.79% 4.37% SERVICES 238,2 229,1 236,6 239,2 259,7 261,7 276,2 293,2 305,4 3.56% 4.41% Trade 114,9 103,7 105,9 104,6 118,3 118,9 123,8 136,5 143,3 3.58% 5.30% Transports and Communications 32,3 34,7 35,7 38,0 40,9 42,2 48,1 51,4 53,8 6.53% 7.13% Other services 39,2 41,7 42,5 43,1 44,8 44,7 46,6 48,5 50,8 2.85% 2.89% Financial services 7,5 7,8 7,6 7,9 8,5 8,6 8,9 9,2 10,0 3.38% 4.14% Public administration 48,9 45,9 49,5 50,4 52,4 52,5 54,2 53,2 53,7 1.73% 1.38% Fictitious Branch -4,6 -4,7 -4,6 -4,8 -5,2 -5,2 -5,4 -5,6 -6,1 Import taxes 34,9 43,3 29,0 40,4 51,6 57,3 64,8 68,6 67,8 9.99% 13.69% GDP. 712,7 679,3 697,4 746,5 778,3 830,7 872,0 929,8 973,7 4.57% 5.55% Real growth rate -4.7% 2.7% 7.0% 4.3% 6.7% 5.0% 6.6% 4.7%
Source: DNSI
It was to a large extent export led, with export volume growth increasing from about 6 percent on average during 1986-93 to about 13 percent during 1995-2000 (IMF, 2002). Output growth has also been more regular since the devaluation, but remains linked to rainfall. Mali benefited from good rainfall since 1994, making it difficult to link policies and the growth performance.
The growth rate for 2001 is low (1.5%), as a consequence of the cotton crisis (in Malian national accounts, agricultural crop of year n/n+1 is in accounted for in year n+1). Nevertheless, this figure is surprising, given the sharp decrease of cotton and cereal productions (previous estimation was -0.1%). Contributions to growth correspond to the sectoral average growth rates multiplied by the share of the sector in the GDP of the first year. Since 1994, the most significant contributions to the 39.6% compounded growth rate have been made by food crops sector, trade and (curiously) custom duties (See Table 1). All other sectors account for less than 1.5%. One should note that growth is accounted for in constant prices. The picture is very different if we take values at current prices into account (see last column of Table 2). In current value, the rates of growth of cash crops and gold and mining are higher than the growth rate of the food crops sector. This is because of the distortion of relative prices during the period (in the second case, the period begins in 1992 to capture the impact of the
devaluation on prices). Notice also that the basis year of National Accounts is 1985, which is fairly remote and may not take fully into account the important growth rate in sectors like cotton, gold and mining, etc.
The cotton production growth has been impressive (increasing by 118% between 1993/94 and 1997/98), as well as gold mining production growth. But their contribution to growth is not as important as frequently believed, because their share in total added value is limited. Nevertheless, their share in GDP increased.
Table 2: Contributions to growth (1994-2000)
Contributions to growth (94-200)
Annual rate of growth in current value (92-2000)
Food crops 7.60% 11.1%
Trade 5.36% 12.5%
Custom duties 5.56% 17.9%
Cash crops 4.16% 15.4%
Gold and mining 6.22% 28.8%
Transportation and telecommunications 2.59% 12.1%
Construction 1.60% 12.7%
Others 6.52%
GDP 39.6% 12.1%
Source: DNSI
A special feature in Mali compared to the rest of West Africa is the relative success of cereal production. Reform of the cereal market under the “Projet de réforme du marché céréalier” (Cereal Market Reform Project, PRMC by its French acronym) is widely considered as a success. Management problems in the production of irrigated rice in the Office du Niger seem under control since the 1994 devaluation. As a result, Mali exports of cereals to neighboring countries increased (these exports are not detailled in the official exports figures).
Graph 1 shows that growth in Mali is still tightly linked with the growth rate of agriculture. Agriculture is highly rainfall-dependant. As shown on Graph 2, the good growth record in the nineties is partly the result of good rainfall.
Graph 2 : Rainfall in the Sahel 1950-2000
2.2.
Has the increasing poverty trend been reversed?About two thirds of the Malians live below the poverty line, with about one fifth of the population living in extreme poverty. Mali social indicators are significantly weaker than the averages for Sub-Saharan Africa (IMF, 2002). Analyses rely on only three surveys: Income and expenditure survey (1988-89), Malian Survey of Economic and Social Trends (1994) and WAEMU expenditure survey (1996) (Bamako only).
2.2.1. Trends according to official figures and poverty profile
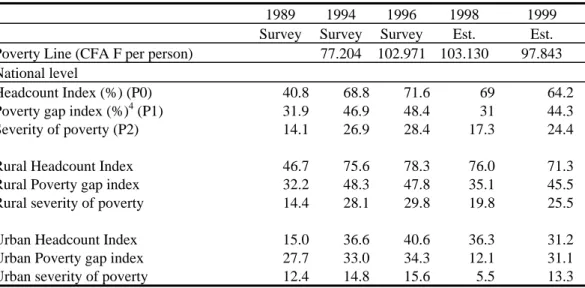
The Poverty and Human Development Monitoring Unit ODHD (ODHD, 1999) asserted that poverty (as measured by the headcount ratio) increased significantly between 1989 and 1996 (due to the 1994 devaluation of the CFAF, and then decreased between 1996 and 1999 (see Table 3).
The assertion that poverty decreased between 1996 and 1999 does not come from survey observations, but relies on mere extrapolations of incomes for the 1995-1999 period, expenditures of households have been estimated on the basis of the 1994 survey under the assumption that all incomes have grown like the GDP per person (ODHD 2000, p. 77).
The most astonishing result concerns the period 1994-96 which was characterized by sustained growth. The evolution of poverty between 1996 and 1999 is more logical, following the usual assumption that growth reduces poverty, given the good growth record.
Table 3: Poverty trends (1989-1999)
1989 1994 1996 1998 1999
Survey Survey Survey Est. Est.
Poverty Line (CFA F per person) 77.204 102.971 103.130 97.843 National level
Headcount Index (%) (P0) 40.8 68.8 71.6 69 64.2 Poverty gap index (%)4 (P1) 31.9 46.9 48.4 31 44.3 Severity of poverty (P2) 14.1 26.9 28.4 17.3 24.4 Rural Headcount Index 46.7 75.6 78.3 76.0 71.3 Rural Poverty gap index 32.2 48.3 47.8 35.1 45.5 Rural severity of poverty 14.4 28.1 29.8 19.8 25.5 Urban Headcount Index 15.0 36.6 40.6 36.3 31.2 Urban Poverty gap index 27.7 33.0 34.3 12.1 31.1 Urban severity of poverty 12.4 14.8 15.6 5.5 13.3
Source: ODHD, 1999 and 2000
As usual, these figures are based on consumption, not income. More specifically, they are based on a “rice equivalent” method (Lok Dessallien et al., 2001: 32). This method raises some questions; one of them being that consumption of the poorest (all rural) is mostly millet and sorghum, whose prices move in a quite different way. Based on producer prices, the poverty line was equivalent to 1,643 kg of millet in 1989, 1,050 in 1996, 982 in 1998 and 1,378 in 1999 – meaning that a producer of millet producing 1 ton of millet would have been poor in 1989, 1996 and 1999, but “non-poor” in 1998. According to Table 3, the incidence of poverty decreased between 1994 and 1999, and the average income of the poor is closer to the poverty line. However, the poverty gap figures in 1998 are surprising, which may be due to the method of extrapolation.
4 This indicator measures the magnitude of poverty, considering both the number of poor people, and how poor they are. The Poverty Gap
2.2.2. Who are the poor?
The extent of poverty varies according to the area of residence (urban, rural). 88% of the poor live in rural areas. 90% of the poor work in the primary sector. Furthermore, the situation of the urban poor is better, as their income is closer to the poverty line (République du Mali, 2002). The PRSP states that most of the poor are women. As the figures show that 51% of the poor are women, (which seems to be in line with their proportion in the population) this assertion is controversial. Young people are less poor than elders (only 46.5% of persons under 15). Poor households have typically more children than non-poor and households with aged heads of are likely to be poorer. Educated persons are less poor than ones without education.
A striking fact is that poor persons in Mali are mainly peasants and stock breeders. About 8 million people live in the rural areas. 3 million out of them grow cotton and some 270,000 flooded rice. This means that the majority of rural Malian grows rainfall food crops. The full picture is difficult to draw, because there is no recent agricultural survey.
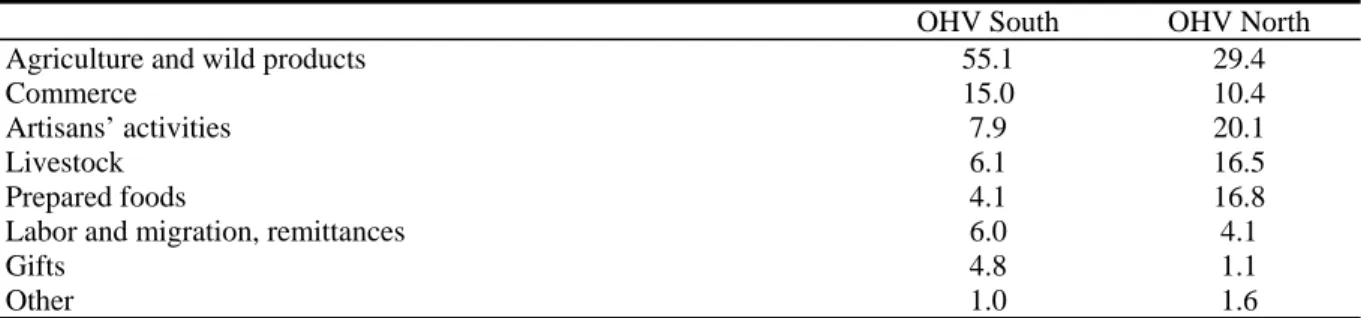
Some evidence from Southern Mali suggests that poor farmers’ households cannot rely only on agriculture (Staatz et al., 1990). They have to find additional revenues outside agriculture, and have to buy cereals in the period preceding the new harvest (when prices are higher). Wealthier farmers are quite self-reliant on food and have diversified agricultural sources of income. They are less prone to get money from extra-farm activities. This is shown in Table 4, because farmers are, on average, richer in the South than in the North.
The fact that poor farmers cannot rely only on agricultural income may be misleading. Staatz et al. (1990) underscore that an improvement in the productivity of food crop agriculture is of paramount importance for them. This is because “long-term nutritional status in the north is positively correlated with a single variable, grain production per capita” (Staatz et al., 1990, p.1316); the same authors add that “even within the North, household consumption security and long-term child nutritional status are correlated with labor productivity in grain production, demonstrating that own production continues to play an important role in these households’ food strategies”.
Table 4:
Distribution of Major Income Sources in the Opération Haute Vallée (OHV)
Area by Sub region*
OHV South OHV North
Agriculture and wild products 55.1 29.4
Commerce 15.0 10.4
Artisans’ activities 7.9 20.1
Livestock 6.1 16.5
Prepared foods 4.1 16.8
Labor and migration, remittances 6.0 4.1
Gifts 4.8 1.1
Other 1.0 1.6
Source: Stats et al. (1990)
*The OHV is an area in Southern Mali (Upper Niger River Valley Development Authority), outside the main cotton production zone (CMDT).
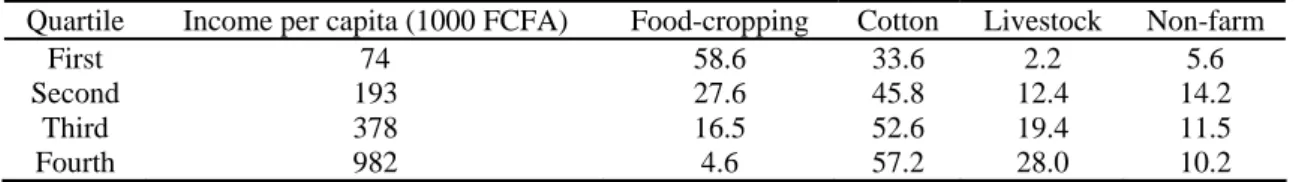
Abdulai & CroleRees (2001) find evidence in Southern Mali (in the CMDT5 region of cotton producers, which is different form the OHV area) that poorer households have fewer opportunities in non-cropping activities such as livestock rearing and non-farm work, and hence less diversified incomes. Poorer producers rely more on food crops (See Table 5).This appears to reflect their relative lack of capital, which makes it difficult for them to diversify away from subsistence agriculture. Households in remote areas are less likely to participate in the non-cropping sector than their counterparts closer to local markets, while households with educated heads are more likely to participate in the non-farm sector than those with illiterate heads. Rural households generally consider
5
holding livestock as an important way out of poverty. Abdulai & CroleRess also report that “42% of the households complained that lack of access to credit was hindering their investments in the non-cropping sector”.
Table 5: Income sources across income per capital quartiles 1994-95-95/96
Quartile Income per capita (1000 FCFA) Food-cropping Cotton Livestock Non-farm
First 74 58.6 33.6 2.2 5.6
Second 193 27.6 45.8 12.4 14.2
Third 378 16.5 52.6 19.4 11.5
Fourth 982 4.6 57.2 28.0 10.2
Source: Abdulai & CroleRees (2001, p. 442). Note that poverty line in 1994 was 77 thousand CFAF
An important problem for the poor rural household is risk. The variability of rainfall is important, and they have very few opportunities to mitigate the variability of agricultural production – just reducing inventories of short term migration. Dioné (2000, p. 127) notes that “about two-third of the OHV farmers who had historically invested in animal traction had also disinvested from it to generate cash to face both household food shortages and head tax payments in years of poor harvests”.
2.2.3. Critics and other studies
The evolution of poverty as described by the ODHD figures (Table 3) has been under hard criticism. The results of the various surveys can barely be compared: methodologies and purposes differ.
DIAL (2000) conducted a new analysis of the same surveys but limited to Bamako in order to investigate urban poverty. The analysis started by a clean-up of the original data bases, which still contained large quantity of flawed information. The analysis concerned Bamako alone, because the 1994 survey covering the whole country is unreliable (it uses a particular methodology to assess household consumption), whereas the 1996 WAEMU survey covers only Bamako.
The study conducted by DIAL shows a significant increase in poverty in Bamako. With a poverty line of $2, headcount poverty index rose from 33% in 1989 to 57.2% in 1996 (4.7% to 16.2% with a $1 poverty line).Furthermore, the poverty gap increased from 38,000 CFAF in 1989 to 75,000 CFAF in 1996, showing that the living condition of poor people worsened.
In 1996, 60% of the consumption of poor people consisted in food (51% for non-poor), and 17% in housing (15.9% for non-poor). In 1996, poverty is more likely to occur in households led by a man, in large households (but this result is not robust when one takes into account some kind of weighting of the members of the household, like the Oxford scale). Wage earners are less poor than self-employed. Education of the head of the household impacts significantly on poverty. There are no differences in terms of poverty between non educated and holders of primary education degrees. Differences become significant with secondary education (expenditures increase by 35%) and superior education (50%) (DIAL 2000: 165).
Nutrition indicators for children also worsened in Bamako between the two demographic and health surveys (DHS) of 1987 and 1995/96. For instance, low weight children were 21.9% of children between 3 and 36 months, and 30.6% in 1995/96.
Sahn & Stifel (2000) used a new methodology to assess the evolution of poverty in Africa. They use DHS information about assets (not expenditures). For Mali, the result of this approach is a sharp decrease in poverty (and the poverty gap) between 1987 and 1995. Headcount falls from 23% to 16% for instance, using the 25th percentile in 1987 as the poverty line – and from 43.3% to 30.8% using the 45th percentile in 1987. Reduction of poverty is effective in the urban and rural sectors. This shows that the evolution of poverty and the analysis of its causes and links with the evolution of GDP are far from clear in Mali.
2.2.4. Spatial repartition of poverty
According to the ODHD (1989), the spatial repartition of poverty is as presented in Table 6. The best performing region, in terms of poverty, is the Bamako district, which concentrates 40% of the urban population. Bamako is endowed with the best infrastructures in the fields of education, health, water and so on. The least performing region is Mopti, a Sahelian region devoted to rainfall food cropping. The region is characterized by very low enrolment ratios, lack of agricultural equipment and land conflicts (mainly between farmers and transhumant pastors).
The figures presented have been very surprising for most Malian observers. They could hardly understand how could the region of Sikasso (southern, rainy, with cotton producers) be poorer than the region of Kayes (Sahelian and locked). In response, the ODHD explained (1989, p. 47) that cash costs of producing cotton are high, especially after the devaluation, that Sikasso, unlike Kayes, is not a region of migrants (so the remittances are low), and that the number of people per household is greater in Sikasso. According to Gubert (2000), Kayes has received about 60% of total Malian remittances in 1994 (about 47,000 CFA F by family in Kayes, whereas it is about 10,000 CFA F in the other regions).
Table 6: Spatial repartition of poverty and HDI
Head Count index HDI
1994 1996 1998 1998 Kayes 45.1 52.6 50.1 0.340 Koulikoro 74.0 76.5 74.9 0.317 Sikasso 84.6 84.4 82.7 0.308 Ségou 85.0 73.9 70.4 0.288 Mopti 71.5 90.4 88.6 0.251 Timbuktu 58.0 68.2 60.8 0.259 Gao (town) 20.0 26.1 22.9 0.315 Bamako district 24.2 27.7 23.9 0.588 Source: ODHD 1999
If true, these explanations mean that the development of cash crops is not a major way to get out of poverty. But they are in direct opposition with the assertions of Bakary Sanogo (1994, quoted in Sahel and West Africa Club 1998, p.94) who states that: “In the CMDT regions, but also in the regions of the Office du Niger6,...the high level of income of the peasants modify their habits of consumption and
investment; the use of bicycles, motorbikes, radios, of improved guns is now very common”.
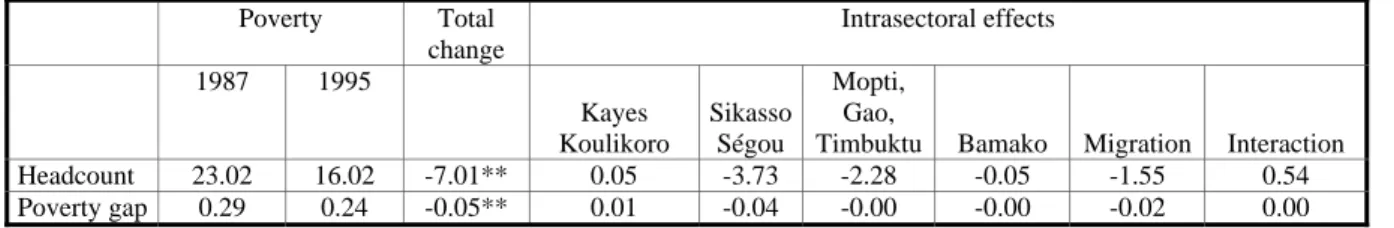
Sahn & Stifel (2000) present a different picture (see Table 7). According to their calculations, the decrease of poverty is mainly significant in Sikasso and Ségou, while poverty increased slightly in Kayes and Koulikoro.
Table 7: Mali, decomposition of changes in “poverty” between 1987 and 1995
Poverty Total change Intrasectoral effects 1987 1995 Kayes Koulikoro Sikasso Ségou Mopti, Gao,
Timbuktu Bamako Migration Interaction
Headcount 23.02 16.02 -7.01** 0.05 -3.73 -2.28 -0.05 -1.55 0.54
Poverty gap 0.29 0.24 -0.05** 0.01 -0.04 -0.00 -0.00 -0.02 0.00
Source: Sahn & Stifel (2000) **Significance at the 99% levels of confidence
6
According to the first results of a recent survey (EMEP, 2001), the severity of poverty7 is the highest in Kidal, Gao and Timbuktu, while the regions where the severity is the lower are Kayes, Koulikoro and Bamako. This survey confirms that the depth of poverty is greater in Sikasso than in Kayes. 2.2.5. Evolution of inequality
In Mali, the Gini index (in terms of expenditures) was 44.3% in 1994 according to the ODHD, and 50.5% according to the WDI. It has increased in Bamako from 41.8% in 1994 to 44.7% in 1996 (ODHD, 1999) which could contribute to explaining why growth has been inefficient in poverty reduction.
DIAL (2000) shows also an increasing inequality in Bamako: the Gini index (in terms of expenditures) increased from 27% in 1989 to 38% in 1996. But it shows also that the 1989 distribution of expenditures does not dominate (in the statistical sense) the distribution of 1996. The real expenditure level in 1996 is worse than the 1989’s for 89% of the poorest persons but it is better for the richest (earning more than 450,000 constant CFA F per year and person).
DIAL (2000) presents a decomposition of the change in poverty between growth and distribution effects, showing that the change in poverty incidence, depth and severity is more linked to the worsening of the distribution than to growth performance.
2.2.6. The quality of information
Information provided by different surveys might be misleading if not properly checked. DIAL (2000, p.134) criticizes the careless way the information on poverty has been processed and used : “The low level, if not absence of thinking about the accuracy of analyses shows a priori the limited interest of the government and experts for the availability of a reliable quantitative diagnosis. The definition and assessment process of anti-poverty strategies seem completely disconnected from previous analysis. The poverty analysis seems widely perceived as an unavoidable exercise to present the situation, without any effort to draw on the results to work out policies. It is difficult to understand the high demand for analyses without any real effort being made in terms of statistical production. If there is a true will to design policies on the ground of a sound knowledge, surveys are needed, with a skilled staff and monitoring for an effective control of the process, its targets, tools of analysis, and the development of a critical mind about the results.”
Information seems far from reliable today in Mali. Information about incomes is non-existent, and there is no broad picture (as shown in a social accounting matrix for instance), of resources and uses of the different socio-economic groups. Such information is not a luxury. It’s the only way to assess the link between the endowments, incomes, expenditures and activities of the different social groups.
2.3.
Sound macro-policies have not been effective in poverty alleviationMali experienced growth during 1994-2000, with a rather modest poverty reduction. If we rely on official data, GDP increased by 33.3% between 1994 and 1999 (about 5.5% per year). During the same period, the incidence of poverty fell by 4.6 points, or 6.7%.
Even more troubling is the fact that Mali is widely seen as following sound policies, at least by IFIs standards. Furthermore, Mali enjoys since 1992 a democratic government committed to poverty reduction, exemplified by the declaration of President Konaré that his second mandate would be dedicated to fight poverty. Does the experience of Mali show that there is no relationship between “good” policies, democracy and poverty reduction? Or could we at least say that those factors are not enough for effective poverty reduction?
7
Mali is frequently seen as committed to reforms. Rodrik (1999: 128) presents Mali and The Gambia as countries substantially open to external trade: “However, they have yet to reap significant growth gains, partly because of extremely poor human and physical resources, and their growth potential remains low”. In the same way, UNCTAD’s 2001 Report (Economist, 12/05/01) presents Mali as an example of a strong adjuster from the financial point of view that did not get any results in respect of poverty alleviation. Even the IMF stated recently that “in completing the first review (PRGF), Directors welcomed the measures taken by the new Government and its commitment to push ahead with structural reforms” (IMF, 2001). In short, the commitment to reform seems high, but this does not have a positive impact on the welfare of the population. The fact that capital flight in Mali has been very low and even negative (-2% of 96 GDP, compared to 2.5% of GDP for Burkina Faso), (Boyce & Ndikumana 2001) might be seen as a further witness of the good policies run by the GoM.
2.3.1. A long standing commitment to reform
After the independence (1960) Mali took a socialist orientation under the Presidency of Modibo Keïta. It resulted in a widespread intervention of the State in the economy (including trade), and a leave from the Franc Zone (1962). From 1960 to 1968, 24 state enterprises were operational, and 77 from 1960 to 1980. The management of these enterprises proved difficult (Cissé 1981). High subsidies and fiscal exonerations from the State could not avoid difficulties like arrears in the repayment to the banks. Export crops (mainly peanuts) decreased and Mali had to import food. As a result of these problems, the economic policy has been modified. Mali reintegrated the Franc Zone in 1967, after a 50% devaluation of the Malian Franc.
After the 1968 military coup of Moussa Traoré, the economic policy changed slowly. The Malian Government turned to IFIs and reintegrated the WAMU (1984).
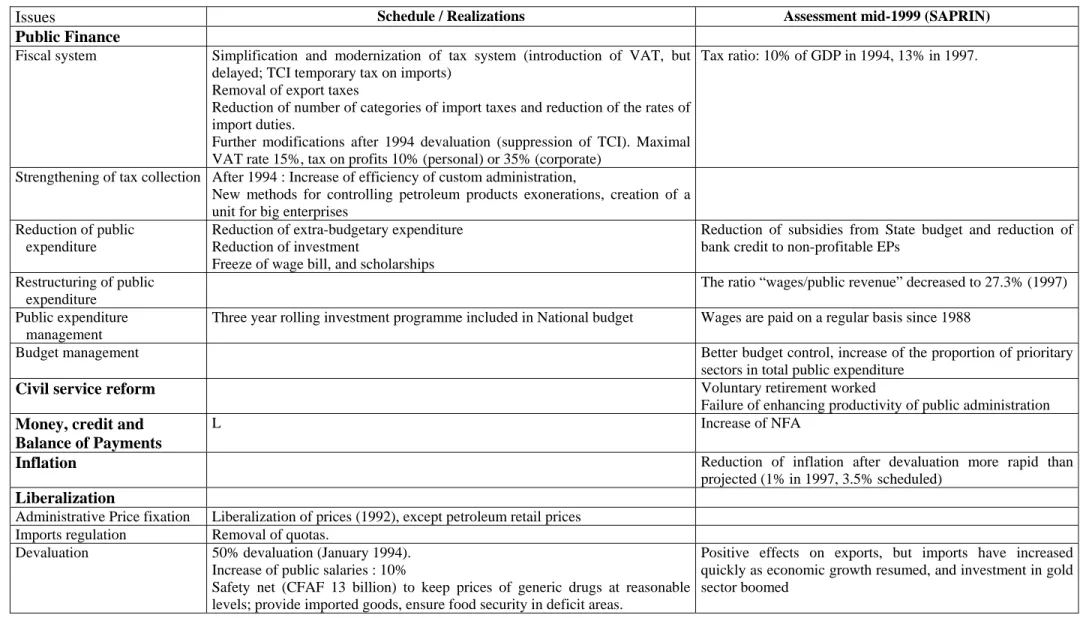
Mali undertook structural adjustment since 1982, under IFIs' guidance. Structural Adjustment carried on since then, with some periods of interruption (from 1986 to 1988, and from 1991 to 1993 due to the establishment of a democratic regime). These Structural Adjustment reforms have been fairly standard and focused at the beginning mostly on the fiscal deficit. Table 8 presents the fields of reforms and the steps that have been taken.
Some other reforms occurred outside this framework. The reintegration in the Franc Zone implied a major change in the monetary policy, and in some other fields, like business law (in the framework of OHADA since 1995). Furthermore, integration into the WAEMU led to a change of the system of protection. A Common External Tariff (TEC by its French acronym) has been launched in 1996, implying a reduction of tariffs for Mali.
Table 8: Structural Adjustment Reforms in Mali
Issues Schedule / Realizations Assessment mid-1999 (SAPRIN)
Public Finance
Fiscal system Simplification and modernization of tax system (introduction of VAT, but delayed; TCI temporary tax on imports)
Removal of export taxes
Reduction of number of categories of import taxes and reduction of the rates of import duties.
Further modifications after 1994 devaluation (suppression of TCI). Maximal VAT rate 15%, tax on profits 10% (personal) or 35% (corporate)
Tax ratio: 10% of GDP in 1994, 13% in 1997.
Strengthening of tax collection After 1994 : Increase of efficiency of custom administration,
New methods for controlling petroleum products exonerations, creation of a unit for big enterprises
Reduction of public expenditure
Reduction of extra-budgetary expenditure Reduction of investment
Freeze of wage bill, and scholarships
Reduction of subsidies from State budget and reduction of bank credit to non-profitable EPs
Restructuring of public expenditure
The ratio “wages/public revenue” decreased to 27.3% (1997) Public expenditure
management
Three year rolling investment programme included in National budget Wages are paid on a regular basis since 1988
Budget management Better budget control, increase of the proportion of prioritary
sectors in total public expenditure
Civil service reform Voluntary retirement worked
Failure of enhancing productivity of public administration
Money, credit and Balance of Payments
L Increase of NFA
Inflation Reduction of inflation after devaluation more rapid than projected (1% in 1997, 3.5% scheduled)
Liberalization
Administrative Price fixation Liberalization of prices (1992), except petroleum retail prices Imports regulation Removal of quotas.
Devaluation 50% devaluation (January 1994). Increase of public salaries : 10%
Safety net (CFAF 13 billion) to keep prices of generic drugs at reasonable levels; provide imported goods, ensure food security in deficit areas.
Positive effects on exports, but imports have increased quickly as economic growth resumed, and investment in gold sector boomed
Restructuring of public sector
Study of the situation of the 35 Public firms (Eps)
Assessment / Realization : Rehabilitation: 6 / 6
Privatization: 14 / 8 (SOCIMA)
Liquidation: 15 / 19 (Air Mali, SOMIEX)
After 1994: privatization of ULB, OTER, OERHN, ORT, Strengthening of management of SOTELMA, ONP, PPM and EDM.
No transparency in some cases of liquidation
No bank credit available for people who took the EP in charge after privatization.
No real privatization law.
Rehabilitation is not really effective: some EP like EDM were still unable to function in a profitable way.
Preparation to improve the competitiveness of the EPs in a framework of competition with the private sector
Restructuring of BDM (managed by Morocco’s BMCE) And banking sector (CCP, Savings Bank)
Low efficiency of bodies in charge of recovering debts and liabilities
Change in relations between State and Public Enterprises
New laws (1987 and 1991) : no more Government representative in the EPs from 91
No real autonomy of management
Decrease of salaries of some categories of manpower
Assessment of public sector debt and settlement (included cross-indebtedness) Public sector debt underestimated : CFAF 21 billion still to be eliminated mid-1999
Compensation for employees laid-off
Creation of a Compensation Fund.
1,488 units managed by former EPs’ employees have been funded (1985-1988)
Underestimation of the compensation Fund (3.5 billion instead of 8, but 4.8 have been disbursed)
Failure of projects undertaken by laid-off employees, by lack of competence, but impossible to assess by lack of information
No possibility for the former employees to take over the management.
Promotion of private sector New legal framework
New Labor Code (1992). Removal of ONMOE monopoly, easier dismissal procedure.
Revision of the Business Law (Code de commerce) (1986)
After 1994: further simplification of procedures for business creation.
Application of new Labor Code delayed.
Development of the rural sector
PASA (1990-98)
Distinction of different roles of CMDT (trade, rural development). Contract between State and CMDT (1994).
Link between producer prices and world prices of cotton. Creation of a cotton Fund to protect producers from fluctuations of prices.
Pilot zone : Bougouni (South) After 1994:
New contract between State and CMDT, increasing the participation of farmers’ organizations.
Effective in increasing production and incomes, but mostly in flooded rice and cotton sectors
Threat of “cotton strike” by SYCOV (1998) to free credit for agricultural inputs.
Increase of cotton production at the expense of fallow land and food crops.
Rich farmer benefit more.
Gains on world prices but no increase in producer prices. No distribution of shares capital for producers (scheduled oct. 1991).
Increase of cotton prices to the producer.
Break-up of the Office du Niger (one unit for water management, one another for industrial and commercial activities)
Cereals PRMC (1981)
Liberalization of prices and exports of cereals OPAM only for security stock management
Reform of ODRs to focus on extension services (six ODRs have been restructured).
Diversification in Bougouni region (maize)
Education PCSE (projet de consolidation du secteur éducation) Reduction of scholarships
Basic education to get 45% of budgetary expenditure in education.
It has not been possible to reduce scholarships in primary, secondary and university sectors, due to agreements between school children and government after the 1991 revolt
Global assessment Adjustment worked, but no structural change (dependence on rainfall, no development of the manufacture sector, no foreign investment, export mainly cotton depending on fluctuations in the world market)
Growth resumed, mainly due to good rainfall, and to structural reforms namely after devaluation.
Adoption of many reforms, but not effective.
No implication of Civil society in discussions with IBW (except workers’ trade union, Employers union and Commerce Chamber): main reason for rejection of structural adjustment by populations.
These adjustment and liberalization policies have been accompanied by structural reforms together with increased public investment in agriculture, infrastructure and social sectors. Among the structural reforms, the most significant are the cereal market liberalization (launched in 1981, effective in 1988) and restructuring of the Office du Niger (a former public firm in charge of the flooded basin of Niger River management) in 1982 (improved in 1984), the increased participation of local communities in the social infrastructure management, notably schools and local health centers (Centres de Santé Communautaires or CSCOM).
Decentralization is a major reform aiming to break with the top down approach of policy making (Serra 2002). The Law institutionalizing decentralized elected bodies was passed in 1993. Elections for the 701 communes were held in 1999.
2.3.2. The impact of reforms
It is difficult to assess the impact of reforms, as other circumstances played a major role in the final outcome (rainfall, terms of trade, external finance, etc.) An attempt has been made by SAPRIN-Mali IREPAS (1999), which main findings are summarized in Table 8.
Nevertheless, some points may be emphasized:
Three success stories: health system, cereal market reform, flooded rice production in the Niger delta The CSCOMs are managed by local association of users. They must rely on their own resources, but the State gives a first endowment. They are widely seen as a success, because they provide access to health services to people who are not wealthy (but not to the poorest, as their functioning are based on cost recovery.)
The reform project of the cereal sector (PRMC by its French acronym) is another success story. Until the end of the seventies, the cereal sector has been completely under State intervention (although private trade never stopped). Priority was given to satisfy urban consumers. The reform has been very gradual and well prepared. Mali became an exporter of cereals (mainly rice) to neighboring West African countries (which also caused some problems, as the prices in the internal Malian market rose sharply in 2002).
The rice flooded sector in the Niger delta was managed as a public firm (Office du Niger). The liberalization of rice production and trade has been very progressive and implied a long period of preparation and strengthening of the private actors (Bonneval & Kuper & Tonneau 2002). Rice production also benefited from the 1994 devaluation which increased the price of the imported rice. Repercussions on the production of rice and productivity are impressive (See Table 13). Nevertheless, this increase in rice production did reduce very much poverty. One major reason is that the increase of rice production implies heavy investments (dams, canals). Thus, the areas cultivated are still limited (French colonial administration had planned 1 million h. flooded). From 1978 to 1999, the number of families that received plots of land for rice cultivation increased form 5,000 to 20,000, and the areas from 37,000 to 51,000 h. Total population living from rice production in the region increased form 112,000 persons (72,000 workers) in 1998 to 264,000 persons in 2001 (180,000 workers) (Diarra & Sanogo 2002).
The impact on the economy Impact on growth
The impact of reforms on the economy is very difficult to assess, because a series of factors affects growth, like drought or change in the terms of trade, devaluation.
The growth rate of the Malian economy experienced no trend since 1960, and presents no structural break (Touré, 2001). The impact of reforms on growth is not significant before 1994, and the rate of
growth remains very unsteady. Since 1994, the growth rate improved, but it seems to be more the result of good rainfall than everything else (namely the devaluation).
Impact on investment and capital
The investment rate has been steadily growing since 1975, with an important decrease in the 1981-1984 period. The reforms did not seem to have altered the former pace of the investment rate.
According to Touré (2001), the rate of growth of the capital stock during the period 1960-1996 has been 4.65%. As GDP growth on the same period was only 3.1%, the ratio “capital stock / GDP” increased significantly (from about 1.8 in 1960 to 2.8 in 1996. This ratio experienced a decrease during 1974-1979, and resume growing afterwards. This means that growth has been more capital intensive in the recent period.
Impact on economic structure
Neither the structure of output or exports evolved significantly during the 1980-1996 period (ODHD 1999). The share of agriculture in GDP increased, from about 20% at the beginning of the eighties, to 28% in the mid-nineties, due to an increase in the shares of cotton (from 4% to 6%) and rice (from 2% to 4%). The share of services increased from 38% in1960 to 51% in 1990 but decreased afterwards to 36% in 1996 (Touré 2001).
Impact on public finances
After the 1994 devaluation, public finances and balance of payments improved significantly. The “basis” deficit of government fiscal operations (deficit excluding all external flows, in revenues and expenditures) turned into a surplus after 1994, but turned back to deficit in 2000 (See Table 9). The wage bill in terms of GDP decreased, as well as its share in public revenue, reflecting the very low level of Malian wage levels compared with other countries in WAEMU. This allowed for an increase in public investment. Nevertheless, this improvement of public finance had also adverse results. Recruitment has been limited to 250 persons per year (2% of total civil servants). The reform of public enterprises laid down 11,000 workers, mainly in the Office du Niger (1,100) and in the Post Administration (280). A program of “voluntary departure” from the civil service resulted in 644 persons alleviating the public wage bill (1987-1989) and 5,800 more between 1991 and 1994 (leaving with a premium).
Impact on the balance of payments
The trade balance also turned into a surplus in 1997, but the resume of growth generated a deficit later on. The current balance followed a similar path, with a huge deficit at the end of the period. One has to take into account that a country like Mali is importing capital, and for this reason should be expected to run a current deficit. Furthermore, Mali being a Zone Franc country, the external deficit is not a serious problem, in the sense that this deficit is automatically financed by the French Treasury. The peg of the CFAF to the French Franc (now the euro) is more problematic. It could result in a misalignment of the CFAF. Before 1994 Mali experienced an overvaluation of its currency. The competitiveness of the economy improved dramatically after the 1994 devaluation. During the period 1995 to 2001, according to the IMF, real effective exchange rate (REER) did not vary much. The REER index fluctuates between 52 and 65, 100 being the basis in 1990. Nevertheless, the recent increase of the euro against the dollar could have adverse effects on the competitiveness of the Malian economy.
Table 9: Public Finance and Balance of Payments 1992 1993 1994 1995 1996 1997 1998 1999 2000 Fiscal operations (% of GDP) Public revenue 10.8% 11.7% 10.5% 11.1% 13.1% 13.8% 13.9% 14.1% 13.0% Wage bill 5.7% 5.7% 4.5% 4.0% 3.8% 4.0% 3.8% 3.9% 4.1% Capital expenditure 9.0% 9.4% 13.1% 12.8% 12.3% 11.0% 12.2% 12.0% 12.1% Basis balance -3.1% -1.9% -2.7% 0.4% 2.2% 0.7% 1.3% 0.2% -0.7%
Deficit (commitment basis) -4.0% -4.2% -4.4% -3.1% -0.9% -2.1% -2.4% -3.7% -3.8% Wage bill (as % of public revenue) 53.1% 48.9% 43.1% 36.5% 29.3% 28.9% 27.4% 27.8% 31.3%
Balance of payments (% of GDP)
Trade Balance -5.9% -4.8% -6.5% -4.8% -4.6% 0.6% 0.1% -1.3% -3.0%
Current Balance -7.7% -7.0% -6.9% -10.5% -8.4% -5.2% -5.6% -9.3% -9.4% Current Balance (without public transfers) -17.1% -12.9% -18.0% -17.1% -14.1% -9.5% -9.3% -10.8% -12.0%
Source: DNSI
The impact on inflation
As elsewhere in the Franc Zone, inflation is under control in Mali, since the credit to the government by the regional central bank BCEAO is tightly limited. After the 1994 devaluation, there was a short burst of inflation, but it did not last. Inflation is now low or even negative (see Table 10). It is then difficult to understand why the IMF insisted on tight monetary policy after the devaluation. This policy probably hindered potential investor to grasp opportunities created by the new context.
Table 10: consumption price index (1990-2001)
1990 1991 1992 1993 1994 1995 1996 1997 1998 1999 2000 CPI 0.6% 1.4% -5.8% -0.6% 24.2% 11.5% 8.1% -0.7% 4.0% -1.2%
Source: DNSI
Inflation in 94-95 severely hit the urban poor and was responsible for the entry into poverty of many former non-poor. Inflation was especially high as far as food is concerned. The sharp increase in the price of medicines is a factor of concern for poor people. The allegation that devaluation benefited the rural poor is not confirmed by survey results. As most of the poor are rural cereal producers, the main problem for them remains the infra-annual fluctuation of cereals prices (Staatz et al., 1990).
2.3.3. Democracy and governance: empowering the poor?
Mali embarked in a democratic process since the 1991 revolt against Moussa Traoré. Mali is widely seen as one of the few really democratic countries in Africa. This does not mean that there have been no problems with the Malian young democracy.
Elections
Really free elections are difficult to settle. The 1997 presidential elections have been rejected by the opposition. Nevertheless, the situation improved. At the opposite of many African rulers, President Alpha Konaré did not compete for a third term. The 2002 elections were far better organized and open (24 candidates, no one supported by the former President). These elections resulted in a change in power with an opposition candidate elected (Amadou Toumani Touré, “ATT”, the general that arrested Moussa Traoré and organized the transition to the civil regime after 1991).
Stability?
It has been emphasized by many authors that stability is important for growth. But what is exactly meant by “stability” has to be investigated. Azam (1998) considers that stability can not be understood as the absence of change of government. From 1968 to 1991, Mali has been ruled buy the same