Any correspondence concerning this service should be sent to the repository administrator: staff-oatao@inp-toulouse.fr
This is an author-deposited version published in: http://oatao.univ-toulouse.fr/ Eprints ID: 6649
To cite this version:
Stempflé, Philippe and Bourrat, Xavier and Kouitat Njiwa, Richard and Pantalé,
Olivier and Lopez, Evelyne and Takadoum, Jamal A multiscale tribological
study of nacre : Evidence of wear nanomechanisms controlled by the frictional
dissipated power. (2012) In: NordTrib 2012, 12-15 June 2012, Trondheim,
Norway.
O
pen
A
rchive
T
oulouse
A
rchive
O
uverte (
OATAO
)
OATAO is an open access repository that collects the work of Toulouse researchers and makes it freely available over the web where possible.
1
A multiscale tribological study of nacre: Evidence of wear nanomechanisms
controlled by the frictional dissipated power
Philippe Stempflé1*, Xavier Bourrat2, Richard Kouitat Njiwa3,
Olivier Pantalé4, Evelyne Lopez5, Jamal Takadoum1
1
Institut FEMTO-ST (UMR CNRS 6174), 26 chemin de l’Epitaphe, F-25030 Besançon Cedex, France
2
Orleans University CNRS- BRGM, ISTO, 1A Rue de la Ferollerie, 45071 Orleans cedex 2, France
3
Institut Jean Lamour (UMR CNRS 7198 – INPL – Nancy University), Parc de Saurupt, F-54042 Nancy cedex, France
4
Université de Toulouse, INP/ENIT, Laboratoire Génie de Production, 47 avenue d’Azereix, F-65016 Tarbes, France
5
Museum National d’Histoire Naturelle (UMR 5178 CNRS – MNHN), CP 51, 55 Rue Buffon, 75005 Paris, France
Abstract
Sheet nacre is a hybrid biocomposite with a multiscale structure, including nanograins of CaCO3 (97% wt.% – 40 nm in size) and two organic matrices: (i) the “interlamellar” mainly composed of ȕ-chitin and proteins, and (ii) the “intracrystalline” mainly composed by silk-fibroin-like proteins. This material is currently studied as small prostheses with its tribological behaviour. In this work, the latter is studied by varying the frictional dissipated power from few nW to several hundreds mW, in order to study the various responses of the different nacre’s components, independently. Results reveal various dissipative mechanisms vs. dissipated frictional power: organic thin film lubrication, tablet’s elastoplastic deformations, stick-slip phenomenon and/or multiscale wear processes, including various thermo-mechanical processes (i.e., mineral phase transformation, organics melting and friction-induced nanoshocks process on a large range). All these mechanisms are controlled by the multiscale structure of nacre – and especially by its both matrices and respective orientation vs. the sliding direction.
Keywords: Nacre, Organic matrix, Multiscale analysis, Frictional dissipated power.
*Corresponding author: Stempflé Philippe (philippe.stempfle@ens2m.fr)
1. INTRODUCTION
Sheet nacre (the pearly internal layer of molluscan shells) is a hybrid biocomposite with a multiscale structure including nanograins of calcium carbonate (97 wt. % – 40 nm in size) and two organic matrices (3 wt.%) [1, 2]. At the nanoscale, biocrystals (40 nm in size) are drowned in an “intracrystalline” organic matrix (4 nm thick, mainly composed by silk-fibroin-like proteins) in order to form a micro-sized flat organomineral aragonite tablet (thickness about 500 nm) [3]. At a larger scale [4], these tablets are themselves surrounded by a porous “interlamellar” organic matrix (thickness 40 nm) building up a material displaying highly interesting properties [5]: low density, good biocompatibility and osteogenic properties for human bone regeneration [6, 7]. This material is currently being studied as small prostheses or for the creation of new organic /inorganic bio-inspired hybrid materials [8].
Recent tribological results, obtained in dry friction [9-14] and in liquid medium [9], reveal that the wear mechanisms are strongly controlled: (i) by the
environment itself, especially in liquid medium [9] through various physico-chemical interactions, occurring on the water-soluble “intracrystalline” organic phase [3]; and (ii) by the amount of energy dissipated during tribological tests in dry friction [e.g., 12]. Thus, as a function of the amount of frictional power dissipated within the multi-asperity tribocontact, nacre can be submitted to peculiar thermal [13] and mechanical [9, 14] damage processes that occur at various orders of magnitude involving its double composite structure. This way, various
multiscale wear mechanisms can be observed, leading
to various wear rate levels, controlled by the multiscale structure of nacre itself [9, 13, 14, 16]. Besides, organic matrices are always directly involved in the friction-induced energy dissipation mechanisms and, in the subsequent damage mechanisms. So, the way the organic matrices control the wear mechanisms can be successively studied by varying the amount of frictional power, which is dissipated within the contact – that is, by changing the size of the real contact area (i.e, the contact pressure) and the sliding velocity within a large range.
2 The aim of this work is to study each wear mechanism independently – as a function of its own frictional dissipated power – by using multiscale tribological tests. Thus, frictional dissipated powers range from few nanowatts (which is sufficient for inducing self heating elastic deformation and/or irreversible deformation of the organomineral tablets [16]) to several hundreds milliwatts (which enable phase changes of the mineral phase [12, 13]).
2. EXPERIMENTAL PART 2.1 Samples
Samples are made of sheet nacre extracted from giant oyster Pinctada maxima [2, 9]. They are polished more or less parallel to the aragonite tablets orientation in a so-called face-on configuration (size: 5 µm, thickness: 400 nm, Ra: 14.5 ± 0.6 nm). In fact, a residual angle of 8° vs. the horizontal is generally observed by AFM. The average size of the nanograins assessed by AFM image analysis is 38 ± 21 nm [2].
2.2 High power tribological tests – Macrotribology The experimental device is a pin-on-disc tribotester CSM Instruments (Peseux, Switzerland) [12]. High power tribological tests are carried out at ambient air and room temperature in dry conditions by repeated friction of a 3.5 mm square shaped pin of nacre against the surface of a polished disc of nacre ( 44 mm). The total sliding distance is about 100 m. Frictional dissipated power varies within the range of 1 to 630 mW by changing the normal load from 1 to 15 N (with a sliding velocity fixed at v = 10 mm.s-1) or the sliding velocity from 1 to 150 mm.s-1 (with a normal load fixed at Fn = 10 N), respectively. According to the
mechanical and thermal properties of samples, the situation during the macrotribological tests closely approximates the steady state thermal conduction [12, 13].
2.3. Low power tribological tests – Multiasperity nanotribology
The experimental device is constituted by a
ball-on-disc nanotribometer CSM Instruments (Switzerland)
[16, 17]. A pin is mounted on a stiff lever, designed as a frictionless force transducer (Kx = 265.1 N.m-1 ; Kz =
152.2 N.m-1). The friction force is determined during the test by measuring the deflection of the elastic arm (low load range down to 50 µN). The ball (Si3N4 – 1.5 mm) is loaded onto a flat nacre sample with a precisely known force using closed loop. The load and friction resolutions are about 1 µN. Tribological tests are carried out in linear reciprocating mode at room
temperature (22°C) under ambient air (RH 35%). The sliding distance is about 10 m. The frictional dissipated power varies in the range of 2 nW to 0.1 mW by changing the normal load from 10 to 80 mN (at v = 1 mm.s-1) and the sliding velocity from 10-3 mm.s-1 to 28 mm.s-1 (at 40 mN), respectively. The thermal contribution is here greatly limited and clearly too low for damaging the matrices.
2.4 Wear assessment
Wear assessment technique depends on the previous tribological tests:
x For the macrotribological tests, wear rates are determined at the end of tests by measuring the weight of the material lost during the tests (precision:10-4g) [9, 13]. Wear debris are observed in SEM and AFM. Any phase transformation of the wear debris is assessed using X-Ray diffraction [13];
x For the multi-asperity nanotribological tests, wear is determined using a phase-shifting interferometric profilometer ATOS MICROMAP
570 (O = 520 nm) [17]. In addition, an in situ wear
assessment is also carried out by using a real-time depth measuring sensor on the nanotribometer [17]. The depth range varies from 20 nm to 100 µm with a resolution of about 20 nm. Results are compiled using a triboscopic approach giving simultaneously, and for each cycle: (i) the power
map (e.g., Fig. 8a) plotting the evolution of the
power dissipated by friction along the friction track (Pf = Ft.vi) ; (ii) the wear map (e.g., Fig. 8b)
which reveals any-time dependent wear process and/or potential build-up of a tribolayer within the contact. This map is computed from an in situ depth map by taking into account the tilting and the initial deformation of the samples, as reported previously [16]. Finally, an in situ wear rate assessment can be directly extracted from this
wear map as a classical profile analysis (e.g., Fig.
8c) by using a topographical software (http://gwyddion). The complete in situ wear assessment procedure has been described previously [16]
2.5 Scanning Thermal Microscopy
The local thermal properties of the samples, and especially the relationship between the frictional dissipated power and the contact temperature are assessed with a SThM (TA Instruments µTA 2990 with a TA Instruments controller TA 5300, New Castle, DE), which is an analytical system that combines the high resolution visualization and positioning methods of scanning probe microscopy with the technology of thermal analysis [12, 13]. The standard AFM probe is
3 replaced by a thermal probe made from a Wollaston wire (5 µm diameter platinum – 10% rhodium wire enclosed in a silver sheath), which allows the acquisition of the surface contact temperature, and simultaneously acts as a highly localized heater. The vertical deflection of the assembly is monitored by a light pointing technique. Spring constant is 10 N.m-1. The constant current setpoint and the z-setpoint are 1 mA and 50 V, respectively. The probe rate is 100 µm.s-1. The latter is sufficiently weak so that the heat transfer regime stays in the steady state conduction as in the high power tribological tests. The spatial resolution and the thermal sensitivity are about 100 nm and 1°C, respectively. Calibration of the SThM and procedure are detailed in [12].
2.6 Numerical simulations
Finite Element (FE) numerical simulations are carried out in order to understand wear mechanisms that occur during the multiscale tribological tests, and especially in the range which is not investigated by the experimental tribological tests. The FE model and its hypotheses were already described [14]. We just point out that this model simulates the effect of a rigid impactor on nacre sample with, and without shocks occurrence. The damage mechanism that is associated is analyzed and correlated to the results of tribological tests (as AFM assessment of wear debris, for instance).
Abaqus Explicit FEM code [15] is used to solve the
problem. The choice of an explicit code is connected to the presence of severe non-linearities induced both by the large deformations and the behaviour laws that are used [14, 15].
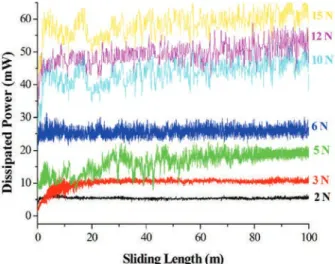
Figure 1: Variation of the dissipated power by friction vs. sliding length for various normal loads
3. RESULTS AND DISCUSSION
3.1 Evolution of the tribological behaviour for the high power tribological tests (Pf > 1 mW)
Fig. 1 shows the variations of the dissipated power by friction – Pf = µFnv – as a function of the sliding
distance for various normal loads (2 N to 15 N). After a running-in period, the deduced friction coefficient is about 0.44 ± 0.02. This value also appears quite insensitive to any variation of the sliding speed in the range 1 to 150 mm.s-1. Thus, surprisingly the friction coefficient stays constant when the frictional dissipated power varies from 1 to 630 mW.
In contrast, wear rate is very sensitive to the frictional dissipated power, as reported in Fig. 2, which displays the effect of any change of normal load (Fig. 2a) and sliding velocity (Fig. 2b), respectively. Thus, various abrupt changes are observed when the frictional dissipated power exceeds 22 mW, 53 mW and 213 mW, respectively, whereas in the same time, the friction coefficient does not change and stays constant at 0.44±0.02. This peculiar behaviour is probably due to the presence of a third body covering the friction track, which controls the frictional behaviour as a negative feedback loop [18]. However, these various rises of the wear rate can be studied independently, by considering the various thermo-mechanical effects that are likely to occur within the contact [12, 13].
Figure 2: Variation of the wear rate with a) the normal load; b) the sliding velocity
4
3.1.1 Evidence of a thermal – induced wear process at the highest frictional powers (Pf > 17 mW)
Wear debris generated under various levels of frictional dissipated powers are assessed using X-Ray diffraction, and compared to the original spectrum of aragonite in Fig. 3. The intensity of the calcite peak (expected at 34.28°, black arrow in Fig. 3) – i.e the other crystallographic form of the CaCO3 – gradually increases when the frictional dissipated power increases from 10 to 103 mW. Below 22 mW, the proportion of calcite in the wear debris is similar as the one, which is assessed in the Pinctada maxima original spectrum. It is worth of noting that the irreversible transformation of calcium carbonate from aragonite to
calcite only occurs when the temperature reaches
470°C [19]. Thus, these results show that high temperatures can be briefly reached, at the level of the microscopic asperities, when the frictional dissipated powers exceed 50 mW (Fig. 3), leading to a phase transformation of the mineral part of the wear debris. Besides, cathodoluminescence assessments carried out on the third body covering the friction track, reveal that this latter is also completely transformed to calcite [12].
Figure 3: X-ray diffraction spectra of wear debris generated under various friction dissipated powers
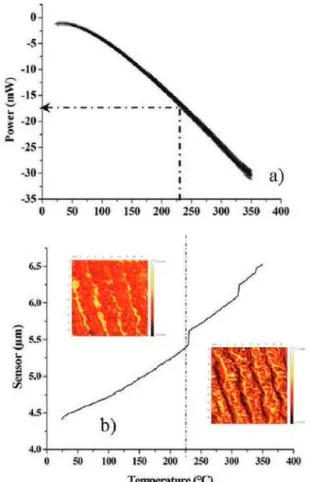
However, since thermal-induced structural changes of the mineral are observed when the frictional dissipated power is higher than 22 mW, the temperature that drives the melting of the organic phases should be reached for the lower dissipated powers – somewhere in-between 1 and 20 mW. An accurate value of this latter can be assessed using a Scanning Thermal Microscopy [13]. Practically, µDTA curve (Fig. 4a) reveals the relationship between the dissipated power and the contact temperature, and µTMA curve (Fig. 4b) simultaneously displays the change of the vertical
displacement of the cantilever, as a function of the contact temperature. Whereas the continuous rise of the sensor vs. the contact temperature corresponds to the thermal expansion of the nacre sample (Fig. 4b), sensor jumps which are observed beyond 225°C clearly reveal that the tablets can come unstuck when the organic phase is degraded in the slot of temperature 200°C to 350°C [19]. Besides, the amplitude of the sensor’s jumps of 250 to 500 nm appears very close to the value of the tablet’s thickness. AFM views (Fig. 4b, inset), carried out before and after heating, confirm the matrix degradation as soon as the contact temperature exceeds 225°C. Finally, µDTA plot (Fig. 4a) provides an accurate value of the minimum thermal power that is necessary for melting the organic phase (about 17 mW).
Figure 4: a) µDTA plot: dissipated power vs. contact
temperature (Tc) and; b) µTMA cantilever
displacement vs. contact temperature; (inset) Typical AFM views of the same area observed before and after heating at 350°C
Thus, these various X-Ray and SThM observations enable us to explain the tribological results (Fig. 1) and the variations of the wear rate vs. the frictional dissipated power (Fig. 2), by comparing the thermal response of sheet nacre (Fig 4a) with the thermal power which is really dissipated by friction during the
5 tribological tests (Fig. 1). Assuming this latter being around 98% of the frictional power, macrotribological results reveal that:
x The first abrupt change of the wear rate (around 22 mW in Fig. 2) can be attributed to the degradation of the organic matrices (Tc# 282°C at 24.5 mW in Fig. 4a), when the frictional dissipated powers are greater than 17 mW. Indeed, this friction-induced contact temperature rises up to the melting point of the organic matrices, as observed in Fig. 4b. x The aragonite-calcite phase transformation
(expected around 470°C) is clearly observed within the contact when the frictional dissipated power is higher than 49 mW. This value is extrapolated from the SThM curves at Tc# 508°C and is in good agreement with the calcite peak observed in Fig. 3. So, this phase transformation well corresponds to the second change of the slope of the wear rate, that is observed in Fig 2b around 53 mW.
x Finally, the avalanche effect observed beyond 213 mW (Fig. 2b) could be attributed to the propagation of the heat flow within the subsurface when the steady state regime is reached. So, the matrix can be degraded in depth, leading to an increased rate of the wear.
Thus, for this range of dissipated powers (Pf > 17 mW), wear of sheet nacre is clearly induced and controlled by thermal effects – combining melting of the organic matrices and friction-induced phase transformation of the mineral phase. Besides, for lower power levels (Pf < 17 mW ), the frictional-induced thermal component is not sufficient for melting the organic matrices (Tc < 210°C). Thus, another kind of wear mechanism must occur in this range of frictional dissipated powers as documented in the following.
Figure 5: Typical a) SEM and b) AFM views of the friction track revealing the morphology of the edge line; c) Typical SEM views of the morphology of the wear debris
3.1.2 Evidence of a shock-induced wear process, at medium frictional powers (P < 17mW)
Typical SEM and AFM views of the friction track (Fig. 5a and b) can be seen after tribological tests
conducted in the range of 1 to 17 mW. Nacre tablets are clearly crumbled; the edge lines are rough and let appear the nanograins constituting biocrystals (Fig. 5b). As a result, wear debris are constituted by nanoparticles and pieces of tablets (Fig. 5c), which are very heterogeneous in size. Obviously, this wear mechanism involves both organic matrices
“intracrystalline” and “interlamellar”.
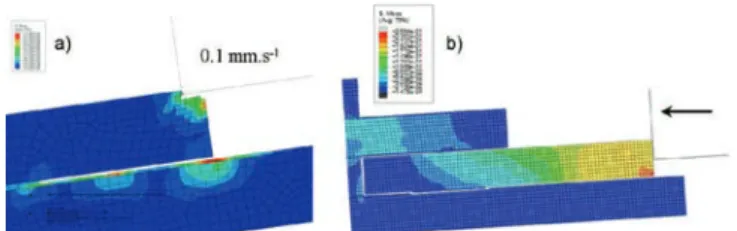
Figure 6: von Mises contourplot for two simulations
(at 4.10-2 s) involving the nanoshocks effect: a) 1 mm.s -1
and b) 10 mm.s-1on flat-on tablets of sheet nacre
In order to explain how these matrices work together in this peculiar wear mechanism, numerical simulation using FEM models is carried out by varying the sliding velocity of the slider (so-called impactor) in the range of 1 to 10 mm.s-1. These velocities enable us to extrapolate results to the lowest dissipated powers in order to make the connection with the next nanotribological tests. The model, the mesh and the mechanical properties of each component, are detailed elsewhere [14]. A ductile damage law is coupled with the erosion algorithm of the Abaqus Explicit code to simulate the fracture inside both materials [15]. Thus, when the ductile damage criterion is reached, the corresponding element is considered instantly completely damaged, and is removed from the FE model.
Fig. 6 displays results of the simulation for two impactor velocities – i.e., two dissipated powers – as observed at the same time increment (4.10-2 s). Although both matrices are clearly solicited, major part of the fracture is located inside of the aragonite tablet whatever the impactor velocity (Fig. 6b). This is the main consequence of the dynamic effects, and the presence of the repeated shocks. These results are in accordance with the AFM observations (Fig. 5b). Stress distribution shows that during the impact, the ratio between the equivalent stress and the yield stress (V/Vy), inside of the biological “interlamellar” organic matrix, is lower than that inside of the tablet. The fracture propagation inside of the “interlamellar” organic matrix is clearly limited: tablet debonding does not occur. Hence, fracture inside the tablet leads to the formation of pieces instead of complete tablet
6 debonding. In addition, different simulations have shown that the ratio between the number of fractured elements inside the tablet and inside the organic matrix, increases when the shearing depth, decreases as usually observed in tribological tests.
Thus, the complete damage mechanism involves here the fracture of both matrices, explaining the experimental high friction coefficient generally observed in this range of frictional powers (µ = 0.44±0.02) [9]. In addition, these simulations enable us to satisfactorily explain the formation of nanometric wear debris – observed by AFM – which have a size very close to that of the initial nanograins constituting the tablets [9, 14]. Indeed, simulations reveal that nanodebris can be directly generated without subsequent tablet’s crushing (Fig. 6b). This mechanism is mainly due to the high velocity-induced shocks which occur within the tablets. This fracture behaviour is also observed when the impactor’s velocity is decreased by a factor 10 (i.e., 1 mm.s-1, Fig. 6a), so this friction-induced nanoshocks mechanism is likely to be the driving force that controls the wear mechanism of nacre on a large range. Is this mechanism still licit at the lower power tribological tests as observed in multi-asperity nanotribological tests?
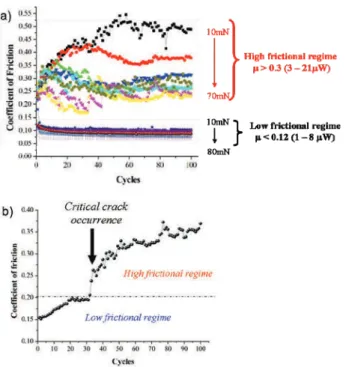
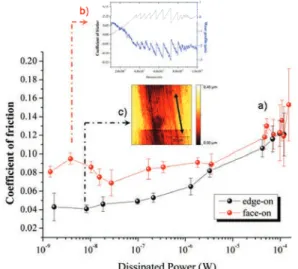
Figure 7: a) Evolution of the coefficient of friction with the normal load in high and low frictional regime, respectively; b) transition from low to high frictional regime due to the occurrence of a critical crack around 35 cycles (Normal load 30 mN)
3.2 Evolution of the tribological behaviour for the low power tribological tests (1 nW < Pf < 0.1 mW) In the range of low dissipated powers, there are two different tribological regimes (Fig. 7a); this is in contrast to what is observed in the previous high power tribological tests, where only one single high level frictional regime is observed (µ = 0.44), controlled by a tribolayer of heterogeneous wear debris. First, a high
frictional regime is very close to the one observed in
our macrotribological experiments (§3.1). Second, a
low frictional regime is only observed on a very
smooth surface [16]. The transition to the upper regime clearly occurs when the slider crosses cracks with a critical depth higher than the thickness of a tablet (more than 500 nm), as shown in Fig. 7b. So, any significant change in the roughness can involve this transition from low to high frictional regime. Which component is likely to control this transition?
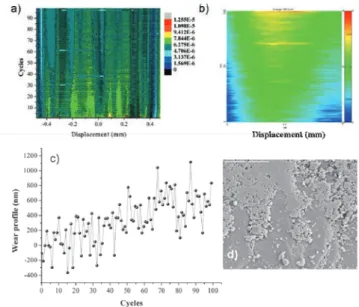
Figure 8: in situ tribological behaviour in high frictional regime at 70 mN: (a) Power map ; (b) Wear map ; (c) corresponding in situ wear profile assessment carried out in the center of the friction track; Morphology of the wear debris (d) at the beginning and, (e) at the end of the tribological test 3.2.1 Nanotribological tests involving the high frictional regime
As shown in Fig. 7a, the high frictional regime displays a high level coefficient of friction (0.35 ± 0.15), which is very unstable and close to the one observed in the high power macrotribological experiments (0.44 ± 0.02). Obviously, these high
7 friction values are connected to a high wear rate, which is assessed using a phase-shifting interferometric profilometer (20 nm/cycle/N).
Fig. 8 displays the typical in situ tribological behaviour as observed in the high frictional regime. The average frictional power dissipated during this test is around 21 µW. As shown in the Fig. 8a, the power
map is very unstable along the friction track and also
in time. This is because a heterogeneous tribolayer is continuously built-up and removed within the contact, as reported in the wear map (Fig. 8b). In order to estimate the amount of wear debris trapped within the contact, the tribolayer’s thickness is computed from a
profile analysis (Fig. 8c), carried out on the respective wear map (Fig. 8b). Its thickness evolves with the
number of cycles but, it increases and even overshoots several micrometers. Thus, this thickness is always higher than a single tablet’s thickness (about 500 nm), revealing that several layers of tablets are probably involved in the wear process. Besides, successive jumps and drops observed on the wear profile are always in the same order of magnitude as the tablet’s thickness, suggesting some tablet’s movements within the contact: hence, pieces of tablets are directly involved by the wear mechanism, as suggested by the SEM observations (Fig. 8d). However, the tablet pieces that are initially detached, are finally crushed within the contact in order to form the non-cohesive tribolayer (Fig. 8b and e); this process maintains itself continuously. Hence, the crushing of the tablets – leading to nanodebris – seems to occur after the tablets debonding. So, the “interlamellar” matrix is broken before the “intracrystalline” one, this would explain the high level of friction which is observed here.
Figure 9: von Mises contourplot for two simulations:
a) involving the fracture of both matrices at 0.1 mm.s-1
and, b)involving the fracture of the “interlamellar” matrix only, when nanoshocks mechanism is avoided
To better understand this process, the previous FEM model is used again, but the initial impactor velocity is still reduced by a factor 10 in Fig. 9a, and finally set to zero in Fig. 9b in order to remove the shocks occurrence. As shown in the Fig. 9, the damage mechanism changes and the location of fracture progressively moves from the tablet to the
“interlamellar” matrix when the impactor velocity is
reduced. As a result, this latter is completely fractured, while the tablet remains intact after deformation and becomes free. In absence of shock – i.e., in a quasi-static compression or shearing test (Fig. 9b) – high shear region and crack propagation may only be located inside of the “interlamellar” organic matrix. Besides, time-history evolution of the stress [14] reveals that this mechanism needs more energy that that of the nanoshocks (Fig. 6) because it involves the
“interlamellar” matrix, which is 4 times stiffer than
the “intracrystalline” one. Nanoshocks mechanism (Fig. 9a) involves stress peaks which are very sharp whereas “interlamellar” damage mechanism rather involves a continuous peeling of the matrix (Fig. 9b). Once in the contact, the detached tablets are completely crushed into homogeneous wear debris, as reported on various SEM views (Fig 8e). As a result, the amount of the wear debris trapped within the contact is also very important – and so the wear rate. Consequently, the main wear mechanism in the nanotribological high frictional regime involves the fracturing of both organic matrices as a continuous mechanism. The high frictional energy is mainly dissipated by fracturing the “interlamellar” matrix, explaining the high level friction coefficient recorded during the test. The continuous tribolayer – which is initially constituted by huge debris and pieces of fractured tablets – is progressively built up by crushing the fractured tablets into homogeneous nanodebris. So, this mechanism also involves the damage of the
“intracrystalline” matrix, but as a secondary process.
3.2.2 Nanotribological tests involving the low frictional regime (down to µW)
Typical in situ tribological behaviour is reported in fig 10 (the average dissipated power is around 5.5 µW). In contrast to what is observed in the previous high
frictional regime, power map (Fig. 10a) is here very
smooth along the friction track and with time. The dissipated power is reduced by a factor 4 with respect to the high frictional regime (around 21µW). This difference is very close to the ratio between the strengths of the organic matrices [16]. Thus, a change of wear mechanism – that would involve the fracturing of “intracrystalline” instead of “interlamellar” matrix – is surely expected. Wear map (Fig. 10b) is also quite homogeneous but reveals that a cohesive tribolayer is now continuously built-up during the test. It is never removed during the tests, in contrast to what is observed for the high frictional regime. The cohesion ability of tribolayers being generally linked to the size of the elemental wear debris that constitute them, AFM image analysis reveals that their size is very close to the one of the initial nanograins constituting the
8 biocrystals. Wear profile extracted from wear map (Fig. 10c) also confirms the presence of a very thin tribolayer whose thickness is seldom over the initial tablet’s thickness (above 500 nm). That means here that only one layer of tablets is involved in the wear process. This result is also suggested in typical SEM pictures (Fig. 10d). Thus, in that case, the wear mechanism would be mainly a fracturing within the tablet, involving the “intracrystalline” organic matrix only (mainly composed by silk-fibroin-like proteins). That would explain the connection between the reduction of the frictional dissipated power and the difference between the matrices’ stiffness, as mentioned above. Thus, the main wear mechanism clearly involves the detachment of nanograins of the biocrystals from the top row of tablets by breaking of the “intracrystalline” organic matrix. Wear debris – close to the nanograins – are directly generated, without any debonding the tablets as previously observed in the high frictional regime. Hence, tablets’s debonding mechanism could be likely the driving force controlling the transition from the low to the high regime (Fig. 7b). Let us check this assumption out.
Figure 10: in situ tribological behaviour in low level regime at 70 mN: (a) Power map ; (b) Wear map ; (c) corresponding in situ wear profile assessment carried out in the center of the friction track; (d) Morphology of the wear debris at the end of the tribological test.
3.2.3 Transition from low to high frictional regime as the gap between nano- and macro-scale
As reported in Fig. 7b, the transition between the low
frictional regime and the high frictional one is quite
irreversible and, is only observed in the face-on configuration – ie when the tablets are oriented more
or less parallel to the direction of sliding (see Fig. 9b). In contrast, when tablets are no longer flat but upright on the section, and parallel to the direction of sliding – so-called edge-on configuration – the low frictional
regime is always observed in a large range of
dissipated powers [16]. So, this transition seems to be controlled by the shear resistance of the
“interlamellar” matrix. Referring to recent results
carried out on face-on configuration of sheet nacre [16], friction and wear are very sensitive to the track smoothness. As long as the crack is still below a critical size (close to the tablets’ thickness), fracturing mainly occurs within the tablets involving the
“intracrystalline” matrix only (Fig. 10c). But as soon
as the crack’s thickness overshoots the critical size (Fig. 8c), the fracturing location moves from the
“intracrystalline” matrix to the “interlamellar” one.
As a result, the frictional dissipation power suddenly increases because the two matrices are now involved, but the influence of the “intracrystalline” is almost imperceptible, completely hidden by the
“interlamellar” one.
So, the high frictional regime clearly makes the connection between the low and high dissipated power process that is, between the nanotribological and the macrotribological tests: as same coefficients of friction, and wear rate which depends on the friction dissipated power. The transition is only observed as soon as the “interlamellar” matrix is broken. Thus, this frictional power-induced transition is clearly the key connecting tribological process from nano- to macroscale, which is controlled by the shear resistance of the “interlamellar” matrix (polysaccharides in between the tablets).
3.2.4 Tribological tests involving the ultralow frictional regime (down to nW)
As shown in Fig. 11a, the friction coefficient drops when the frictional dissipated power decreases until several nW – by decreasing the sliding velocity. Wear rate is too low to control the dissipated frictional power, as mentioned above. So, any variation of the sliding velocity involves a change of the friction coefficient. However, an anisotropic effect is clearly observed when the orientation of the sample is switched from face-on to edge-on configuration. In the
face-on configuration, stick-slip phenomenon – due to
the elastic recovery of the structure – is clearly observed at very low sliding speeds (Fig. 11b), locking the friction coefficient drop around 0.09 whatever the frictional dissipated power down to the nW. The blue curve (in Fig. 11b) also reveals a low dissipative wear mechanism that is clearly coupled with the stick-slip phenomenon and probably controlled by the elastic properties of the organomineral tablets – ie the
9 tribological tests, which are carried out in the edge-on configuration, reveal that the friction coefficient continuously drops when the sliding velocity decreases. In addition, no stick-slip phenomenon is observed in that configuration. Thus, for the same sliding speed, the friction coefficient is much lower in the edge-on configuration than in the face-on one because elastic dissipation and wear process are here replaced by an irreversible deformation due to the plasticity of the organomineral tablets (Fig. 11c). Hence, the dissipative frictional power is much lower, and so the wear rate. The reduction of the friction coefficient is probably due to the transfer of the organic component – as a lubricant and protective film – on the friction interface, as suggested by Jia et al [11] using EDX analysis of the friction track.
Figure 11: a) Evolution of the coefficient of friction vs. dissipated power at ultralow nanotribological tests ; b) evidence of a stick slip phenomenon controlling the wear process (face-on configuration) ; c) Typical AFM view of the friction track after sliding revealing irreversible deformation of the tablets (edge-on configuration)
4. CONCLUSION
Multiscale tribological behaviour of face-on sheet
nacre has been studied by varying the frictional power which is dissipated within the contact. Results reveal various dissipative mechanisms controlled by the organic matrices on various scales:
x When the frictional dissipated power is higher than 17 mW, wear of sheet nacre is mainly controlled by thermal effects – combining melting of the organic matrices and friction-induced phase transformation of the mineral phase. These two mechanisms start from 17 mW and 49 mW, respectively. Beyond, the wear rate dramatically
increases as a so-called avalanche effect due to the propagation of the heat flow within the subsurfaces, damaging matrices in depth.
x When the frictional dissipated power is in between 1 µW and 17 mW, wear is mainly controlled by a friction-induced nanoshock process involving the fracture of the “intracrystalline” matrix only. However, this process can be preceded (or not) by the fracture of the “interlamellar” one increasing (or not) the frictional dissipated power by a factor 4 or more. The “interlamellar” damage occurrence clearly controls the transition from low to high frictional regime and then, the wear rate on a large range. This irreversible transition is completely controlled by the shear resistance of the “interlamellar” matrix, and obviously depends on the orientation of the sheet nacre (face-on vs.
edge-on configuration).
x When the friction dissipated power is decreased down to 1 nW, the tribological behaviour is completely controlled by the orientation of the samples (face-on vs. edge-on), and so by the organic matrices. In face-on configuration, stick-slip occurrence simultaneously controls friction and wear behaviors. In contrast, in edge-on configuration, an interesting lubricant effect – probably due to an organic tribolayer generated by the organic “interlamellar” phase – is observed in association with the irreversible deformation of the organomineral tablets.
5. ACKNOWLEDGEMENTS
This work was supported by grants from the Agence Nationale de la Recherche Française under the awards NanoBioCarbonate ANR 10 INTB 90901 Organic
mediation on nanostructured biomaterials, biomimetic example of otoliths and freshwater pearls.
6. REFERENCES
1. X.Li, et al, Nanoscale structure and mechanical characterization of a natural nanocomposite material : the shell of red abalone, Nanoletters, 4, 2004, 613-617
2. M. Rousseau et al, Multiscale structure of sheet nacre, Biomaterials, 26, 2005, 6254-6262
3. L. Peireira-Mouriès et al, Soluble silk-like organic matrix in the nacreous layer of the bivalve Pinctada maxima, Euro. J. Biochem 269 (2002) 4994-5003
4. Y. Levi-Kalisman et al, Structure of the nacreous organic matrix of a bivalve mollusc shell
10
examined in the hydrated state using cryo-TEM, J. Structural Bio, 135, 2001, 8-17 5. A. Jackson et al, Comparison of nacre with other
ceramic composites, J. Mater. Sci 25, 1990, 3173-3178
6. P. Westbroek, F. Marin, A marriage of bone and nacre, Nature 392, 1998,861-862
7. E. Lopez et al, Demonstration of the capacity of nacre to induce bone formation by human osteoblasts maintained in vitro, Tissue Cell 24 (1992) 667-679
8. E. Munch et al, Tough bio-inspired hybrid materials, Science 322 (2008) 516-520
9. Ph. Stempflé, M. Brendlé, Tribological behaviour of nacre – Influence of the environment on the elementary wear processes, Tribology International 39, 2006, 1485-1496
10. X. Tian et al, Biological coupling anti-wear properties of three typical molluscan shells, Science China, 2010, Vol. 53, N°11:2905-2913 11. X. Jia, X. Ling, D. Tang, Microstructure and
friction-wear characteristics of bivalve shells, Tribology International, 39, 2006, 657-662
12. Ph. Stempflé et al, Evaluation of the real contact area in three-body dry friction by micro-thermal analysis, Tribology International, 43, 2010, 1794-1805
13. Ph. Stempflé et al, Thermal-induced wear mechanisms of sheet nacre in dry friction, Tribology Letters, 2009, 35 : 97-104 ;
14. Ph. Stempflé et al, Friction-induced sheet nacre fracture : effects of nanoshocks on cracks location, Int. J. Nanotechnol., Vol. 4, N°6, 2007, 712-729 15. ABAQUS – ABAQUS Standard User Manual, V.
6.8, in Hibbitt, Karlsson, Sorensen (HKS) Inc (editors), 1997, Rhode Island, USA
16. Ph. Stempflé et al, Nanotribology of nacre : anisotropic dissipation in a multiscale hybrid material, submitted to Tribology International, 2011
17. Ph. Stempflé, J. Takadoum, Multi-asperity nanotribological behaviour of single-crystal silicon: Crystallography-induced anisotropy in friction and wear, Tribology International 48, 2012, 35-43
18. Ph. Stempflé, J. von Stebut, Nanomechanical behaviour of the 3rd body generated in dry friction – Feedback effect of the 3rd body and influence of the surrounding environment on the tribology of graphite, Wear 260, 2006, 601-614
19. X. Bourrat et al, Nacre biocrystal thermal behavior, CrystalEngComm 9, 2007, 1205-1208