S
YSTEMIC OXIDATIVE STRESS IS IMPLICATED IN THE
PATHOGENESIS OF BRAIN EDEMA IN RATS WITH
CHRONIC LIVER FAILURE
Cristina R. Bosoi, Xiaoling Yang, Jimmy Huynh, Christian Parent-Robitaille, Wenlei
Jiang, Mélanie Tremblay, Christopher F. Rose
Neuroscience Research Unit, Hôpital Saint-Luc (CRCHUM), Université de Montréal, Montréal, QC H2X 1P1, Canada
A
BSTRACT
Chronic liver failure leads to hyperammonemia, a central component in the pathogenesis of hepatic encephalopathy (HE); however, a correlation between blood ammonia levels and HE severity remains controversial. It is believed oxidative stress plays a role in modulating the effects of hyperammonemia. This study aimed to determine the relationship between chronic hyperammonemia, oxidative stress, and brain edema (BE) in two rat models of HE: portacaval anastomosis (PCA) and bile-duct ligation (BDL). Ammonia and reactive oxygen species (ROS) levels, BE, oxidant and antioxidant enzyme activities, as well as lipid peroxidation were assessed both systemically and centrally in these two different animal models. Then, the effects of allopurinol (xanthine oxidase inhibitor,
100 mg/kg for 10 days) on ROS and BE and the temporal resolution of ammonia, ROS, and BE were evaluated only in BDL rats. Similar arterial and cerebrospinal fluid ammonia levels were found in PCA and BDL rats, both significantly higher compared to their respective sham-operated controls (p < 0.05). BE was detected in BDL rats (p < 0.05) but not in PCA rats. Evidence of oxidative stress was found systemically but not centrally in BDL rats: increased levels of ROS, increased activity of xanthine oxidase (oxidant enzyme), enhanced oxidative modifications on lipids, as well as decreased antioxidant defense. In PCA rats, a preserved oxidant/antioxidant balance was demonstrated. Treatment with allopurinol in BDL rats attenuated both ROS and BE, suggesting systemic oxidative stress is implicated in the pathogenesis of BE. Analysis of ROS and ammonia temporal resolution in the plasma of BDL rats suggests systemic oxidative stress might be an important “first hit”, which, followed by increases in ammonia, leads to BE in chronic liver failure. In conclusion, chronic hyperammonemia and oxidative stress in combination lead to the onset of BE in rats with chronic liver failure.
H
IGHLIGHTS
► Hyperammonemia does not lead independently to brain edema in chronic liver failure. ► Systemic oxidative stress plays a role in brain edema in chronic liver failure. ► Systemic oxidative stress induces brain edema
synergistically with hyperammonemia. ► Systemic oxidative stress is an important “first hit” in chronic liver failure.
Abbreviations HE, hepatic encephalopathy; mHE, minimal hepatic encephalopathy; CLF, chronic liver failure; ROS,
reactive oxygen species; PCA, portacaval anastomosis; BDL, bile-duct ligation; CSF, cerebrospinal fluid; XO, xanthine oxidase; SSAO, semicarbazide-sensitive amine oxidase; MAO-A, monoamine oxidase A; MAO-B, monoamine oxidase B; CAT, catalase; SOD, superoxide dismutase; GR, glutathione; eductase; GP, glutathione peroxidase; GSH, reduced glutathione; GSSG, oxidized glutathione; TBARS, thiobarbituric acid-reactive substances; BBB, blood–brain barrier
Keywords Hepatic encephalopathy; Hyperammonemia; Bile-duct ligation; Portacaval anastomosis; Allopurinol;
Hepatic encephalopathy (HE) is a metabolic neuropsychiatric syndrome, a major complication of liver disease. Minimal hepatic encephalopathy (mHE), the mildest form of HE, is present in up to 80% of patients with chronic liver failure (CLF) [1]. Patients with mHE have no recognizable clinical symptoms of HE but show mild cognitive and psychomotor dysfunctions diagnosed with sensitive neuropsychological and neurophysiological tests [2], [3] and [4]. mHE has a negative impact on the patient's quality of life and places these patients at a higher (fourfold) risk of developing severe HE [1], [2] and [5]. Newly advanced highly sensitive imaging techniques have demonstrated that brain edema is a major pathological feature present in patients with CLF and mHE [6], [7] and [8]. Although these studies established a link between brain edema and alterations in cognitive function, the relationship between brain edema and the pathogenic factors of HE is still poorly described.
Ammonia is considered the most important factor in the pathogenesis of HE given that hyperammonemia
consequently leads to toxic levels of ammonia in the brain [9] and [10]. Nevertheless, whether a correlation exists between hyperammonemia and HE severity in CLF still remains controversial [11], [12], [13], [14] and [15]. A recent study demonstrated that ammonia administered intravenously to healthy volunteers did not cause any significant neuropsychological impairment [16], supporting the premise that pathogenic factors other than ammonia are involved in the pathogenesis of brain edema and HE in CLF.
Oxidative stress is believed to play a role in the pathogenesis of HE because acute doses of ammonia lead to the induction of oxidative stress [17]. For example, cultured astrocytes acutely exposed to 5 mM ammonia show an increase in reactive oxygen species (ROS) and cell swelling, which are both prevented by antioxidant treatments [18] and [19]. To date, the only in vivo evidence of ammonia-induced oxidative stress in the brain has been reported in animal models of acute ammonia intoxication [20], [21] and [22]; however, the link between chronic
hyperammonemia, oxidative stress (central and systemic), and brain edema in CLF remains undefined.
The aim of this study was to determine the relationship between blood and brain ammonia and oxidative stress in the pathogenesis of brain edema associated with CLF. To clearly understand these relationships, two
well-characterized rat models of chronic hyperammonemia and mHE [23] were used: (1) portacaval anastomosis (PCA)— a type B HE model and (2) bile-duct ligation (BDL)—a type C HE model. The fact that brain edema is present in BDL rats [24] and not in PCA rats [25] sets up an excellent experimental paradigm to study the pathogenesis of brain edema in the context of chronic hyperammonemia.
M
ATERIALS AND METHODS
Animal models
Four groups of male Sprague–Dawley rats (250–275 g, n = 6/group) (Charles River, St-Constant, QC, Canada) were included in the first part of this study. Group 1, the type B model of HE, consisted of rats with end-to-side PCA [26]. Group 2 was composed of sham-operated control rats (PCA-sham). Groups 1 and 2 were sacrificed 4 weeks after surgery. Group 3, the type C model of HE, included rats with secondary biliary cirrhosis induced by BDL [24]. Group 4 consisted of sham-operated control rats (BDL-sham). Groups 3 and 4 were studied 6 weeks after the intervention. For the second part of the study, separate groups of BDL-sham and BDL rats either: (1) received allopurinol (Cayman Chemical Co., Ann Arbor, MI, USA; 100 mg/kg intraperitoneally for 10 days, starting 32 days after the intervention [27]) or (2) were studied at earlier time points (2 and 4 weeks after intervention). Locomotor activity was assessed in sham-operated controls as well as untreated and allopurinol-treated BDL rats using an infrared beam
computerized autotrack system (Columbus Instruments, Columbus, OH, USA) [24]. Rats were individually placed in Plexiglas cages (29 × 22 × 22 cm) for 6 h before activity was recorded, to accommodate to the environment. Cumulative distance traveled was recorded for 12 h during the night (active period).
Experiments were conducted following the guidelines of the Canadian Council on Animal Care and were approved by the Animal Protection Committee of the Hôpital Saint-Luc Research Center, Université de Montréal.
Cerebrospinal fluid sampling
Cerebrospinal fluid (CSF) was collected from the cisterna magna. The rats were anesthetized with isoflurane and the skull was immobilized in a stereotaxic apparatus. An incision was made on the back of the head and the occipital bone was exposed. A dental burr was used to drill a hole on the sagittal midline rostral to the interparietal–occipital bone suture. A PE-10 tubing catheter was inserted into the cisterna magna through the dura mater. CSF was
collected and immediately frozen in deeply cooled isopentane. Immediately after this procedure, arterial plasma and brain samples were collected and instantly frozen at − 80 °C.
Liver biochemistry
Plasma aspartate and alanine aminotransferase, bilirubin, alkaline phosphatase, γ-glutamyl transpeptidase, and albumin were measured using routine biochemistry techniques.
Ammonia
Ammonia levels were measured in plasma and CSF using a commercial kit (Sigma, St. Louis, MO, USA) according to the manufacturer's protocol.
Brain water content
Brain water content was measured using the sensitive densitometry technique. Frontal cortex was freshly dissected at 4 °C and cut into 2-mm3 pieces. Tissue pieces were placed in density gradient columns and the equilibrium point
was recorded after 2 min. Columns were made with various kerosene and bromobenzene mixtures and
precalibrated with K2SO4 solutions of known densities. At least eight samples were taken and averaged for each rat.
Water content was calculated based on tissue density, according to the formula described by Marmarou et al. [28].
Reactive oxygen species
ROS were quantified as previously described [24] following the oxidation of dichlorofluorescein diacetate (DCFDA; Invitrogen, Carlsbad, CA, USA) to dichlorofluorescein (DCF). DCFDA (100 μM) was incubated 30 min in the dark with hydroxylamine hydrochloride (40 mM) and hydrolyzed to nonfluorescent DCF. DCF was incubated with plasma and CSF samples and the oxidation rate was recorded by changes in fluorescence over a 10-min period with a
spectrofluorometer (BioTek, Winooski, VT, USA) at 485 nm excitation and 520 nm emission wavelengths.
For hydrogen peroxide (H2O2) detection we used Amplex red (10-acetyl-3,7-dihidroxyphenoxazine), which reacts
with H2O2 and releases resorufin, a fluorescent oxidation product. Plasma samples were incubated with a mixture of
50 μM Amplex red (Invitrogen) and 0.1 U/ml horseradish peroxidase (HRP; Sigma) in 50 mM sodium phosphate buffer, pH 7.4, for 30 min in dark. Fluorescence was read at 530 nm excitation and 590 nm emission wavelengths. H2O2 levels were calculated based on a standard curve of known H2O2 concentrations.
Tissue preparation
Frontal cortex was dissected and homogenized in lysis buffer (50 mM Tris, pH 7.5, 1 mM EDTA, 1/500 cold Protease Inhibitor Cocktail; Roche, Indianapolis, IN, USA). Homogenates were centrifuged at 30,000g for 40 min at 4 °C. The supernatant was used as the brain cytosolic fraction and the precipitate was resuspended in lysis buffer and used as the brain membrane fraction. Protein content was determined according to the method of Lowry et al. [29].
Oxidants and antioxidants
Xanthine oxidase (XO), amine oxidase (semicarbazide-sensitive amine oxidase, or SSAO; brain monoamine oxidase, or MAO), and catalase (CAT) activities were determined by measuring produced or consumed H2O2, which reacts
XO
Plasma and brain samples were incubated with a mixture of 50 μM Amplex red, 0.2 U/ml HRP and 25 μM xanthine in 100 mM Tris, pH 7.5, for 45 min in the dark. After xanthine oxidation H2O2 is produced, which reacts with Amplex
red and produces fluorescent resorufin. A control for each sample was performed without adding xanthine to the reaction mix to correct for background H2O2. XO activity was calculated based on a standard curve of known XO
concentrations.
SSAO and MAO
To determine activity of SSAO, plasma samples were incubated with a mixture of 200 μM Amplex red, 1 U/ml HRP and 2 mM benzylamine in 100 mM Tris, pH 7.5, for 30 min in the dark. To determine the activity of MAO, brain membrane fractions were incubated with a mixture of 200 μM Amplex red, 1 U/ml HRP and 2 mM benzylamine (MAO-B) or tyramine (MAO-A and MAO-B) in 100 mM Tris, pH 7.5, for 30 min in the dark. Oxidation of benzylamine and tyramine leads to production of H2O2, which further reacts with Amplex red and forms fluorescent resorufin. A
control for each sample was performed without adding benzylamine or tyramine to the respective reaction mix to correct for background H2O2. One microunit of SSAO/MAO was calculated as the quantity of enzyme that produced
1 μM resorufin based on a resorufin standard curve.
CAT
Samples were incubated with 40 μM H2O2 for 30 min in the dark. Then, a mixture of 50 μM Amplex red and 0.2 U/ml
HRP in 100 mM Tris, pH 7.5, was added and incubated for 30 min in the dark. CAT activity was determined by measuring the nonconsumed H2O2 based on the reaction with Amplex red. A control for each sample was performed
by incubating samples with buffer instead of H2O2 to correct for background H2O2. CAT activity was calculated based
on a standard curve of known CAT concentrations.
Superoxide dismutase (SOD)
SOD activity was assessed using a commercial kit (Biovision, Mountain View, CA, USA), according to the manufacturer's protocol.
Glutathione reductase (GR)
GR activity was assessed as previously described [30], based on the reduction of oxidized glutathione (GSSG) to glutathione (GSH). Samples were added to a mixture of 100 mM phosphate buffer, pH 7.5, and 1 mM GSSG. Reaction was started by the addition of 0.1 mM nicotinamide adenine dinucleotide phosphate (NADPH). The oxidation rate of NADPH was followed at 340 nm for 5 min. Controls were performed to correct for nonspecific NADPH oxidation. One milliunit of GR was calculated as the quantity of enzyme that reduced 1 mM GSSG per minute, a reaction that induced the oxidation of 1 mM NADPH.
Glutathione peroxidase (GP)
GP activity was determined based on the reduction of GSH to GSSG followed by the recycling of GSSG back to GSH [31]. Samples were added to a mixture of 100 mM phosphate buffer, pH 7.5, 0.2 U/ml GR, 2.1 mM GSH and 0.25 mM NADPH. Reaction was started by adding 0.3 mM tert-butylhydroxyperoxide and the NADPH oxidation rate was followed at 340 nm for 5 min. One milliunit of GP was calculated as the quantity of enzyme that oxidized 2 mM GSH per minute, a reaction followed by the reduction of 1 mM GSSG accompanied by the oxidation of 1 mM NADPH.
Reduced glutathione/oxidized glutathione ratio (GSH/GSSG)
GSH and GSSG were measured using a commercial kit (Oxford Biomedical Research, Rochester Hills, MI, USA), according to the manufacturer's protocol, and expressed as percentage vs sham.
Oxidative stress effects on lipids
Lipid peroxidation was assessed by measuring TBARS, such as malondialdehyde (MDA), which are end-products of cell membrane lipid peroxidation and considered reliable markers of oxidative stress. These were determined in plasma samples by the measurement of chromogen obtained from the reaction of TBARS with 2-thiobarbituric acid using a TBARS assay kit (Cayman Chemical Co.). Lipid peroxidation in brain tissue was assessed using a Bioxytech LPO-586 assay kit (Oxis International, Foster City, CA, USA) according to the manufacturer's protocol. In both kits, MDA was used as a standard and therefore calculated as μM MDA.
Blood–brain barrier extravasation
Evans blue and sodium fluorescein (NaF) were used to assess blood–brain barrier (BBB) extravasation according to Kaya et al. [32]. PCA and PCA-sham as well as BDL and BDL-sham rats were anesthetized with isoflurane and injected with 2% Evans blue (4 ml/kg) and 10% NaF (1 ml/kg) into the caudal vein [33]. Thirty minutes later, the rats were perfused with saline, the brain was removed, and the left frontal cortex was dissected on ice. Tissues were homogenized in phosphate-buffered saline (13.7 mM NaCl, 0.27 mM KCl, 1 mM Na2HPO4, 0.2 mM KH2PO4) and then
mixed 1:1 with 60% trichloroacetic acid. Samples were vortexed, cooled on ice for 30 min, and centrifuged at 10,000g for 5 min. Evans blue extravasation in frontal cortex was determined spectrophotometrically (610 nm) and expressed in ng/mg tissue. NaF extravasation was determined fluorometrically (at 485 nm excitation and 528 nm emission wavelengths). To validate the technique, a toxic dose of mannitol was used to open the BBB (positive control [34]): naïve rats were injected within 5 min with 25% mannitol (5 ml/kg) into the left carotid artery. Five minutes later, Evans blue and NaF were injected over 5 min (5 ml/kg) and measured as described above.
Statistical analysis
Data are expressed as means ± standard error of the mean (SEM). Significance of difference was tested with ANOVA followed by Newman–Keuls post-test using GraphPad Prism4 (La Jolla, CA, USA). Probability values of p < 0.05 were considered statistically significant.
R
ESULTS
Liver biochemistry
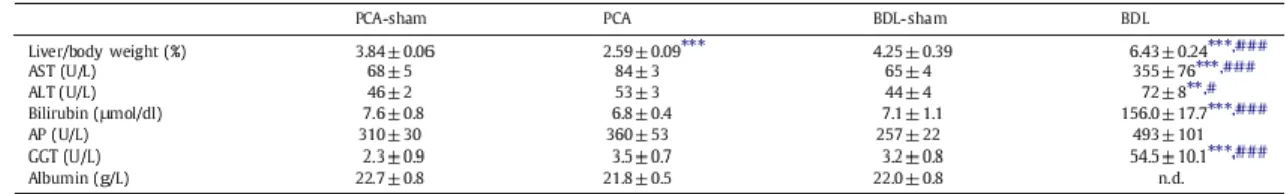
As expected, at time of sacrifice, BDL rats presented clinical signs of cirrhosis: jaundice, ascites, and enlarged, nodular, discolored liver. These signs were absent in PCA rats, which only developed liver atrophy (decreased liver/body weight). Plasma levels of aspartate aminotransferase (AST), alanine aminotransferase (ALT), bilirubin, alkaline phosphatase (AP), and γ-glutamyl transpeptidase (GGT) were significantly increased in BDL rats compared to BDL-sham. Albumin levels were significantly lower in BDL rats compared to BDL-sham. Liver markers remained unchanged in PCA vs PCA-sham (Table 1).
Table 1. Liver/body weight and biochemistry markers.
Ammonia
Arterial ammonia (Fig. 1A) significantly increased in both PCA (164.0 ± 19.0 μM vs PCA-sham 68.7 ± 16.5 μM, p < 0.001) and BDL rats (119.7 ± 15.2 μM vs BDL-sham 41.0 ± 8.3 μM, p < 0.01). Consequently, CSF ammonia levels
(Fig. 1B) also increased in PCA (106.4 ± 16.9 μM vs PCA-sham 45.1 ± 11.9 μM, p < 0.05) and BDL rats
(128.4 ± 36.7 μM vs BDL-sham 23.3 ± 6.1 μM, p < 0.05). No significant difference was found in either plasma or CSF ammonia levels between PCA and BDL rats.
Fig. 1. (A) Arterial ammonia, (B) cerebrospinal fluid (CSF) ammonia, (C) frontal cortex brain water in rats with portacaval anastomosis (PCA) and bile-duct ligation (BDL) compared to respective sham-operated controls. Data are expressed as means ± SEM. *p < 0.05, **p < 0.01, ***p < 0.001, significantly different from sham.
Brain edema
Brain water content in frontal cortex was significantly increased in BDL rats (79.46 ± 0.28% vs BDL-sham 78.35 ± 0.17%, p < 0.05) and not in PCA rats vs PCA-sham (Fig. 1C).
Reactive oxygen species
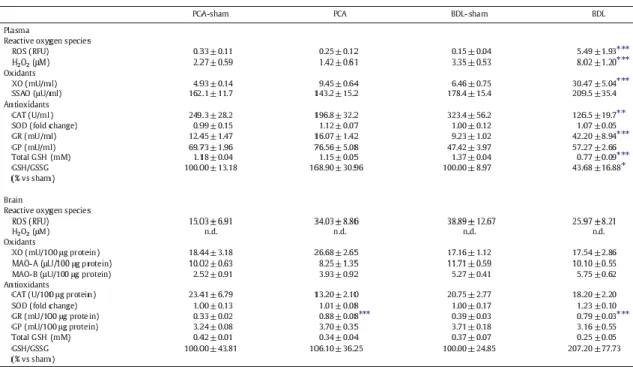
Arterial ROS levels significantly increased in BDL compared to BDL-sham rats (p < 0.001). No significant difference in plasma ROS levels was found between PCA and PCA-sham rats or in CSF ROS levels of the two experimental groups compared to their respective sham-operated controls (Table 2). Supporting these results, arterial H2O2 displayed a pattern similar to that of ROS levels, with a 2.4-fold increase in BDL rats compared to sham-operated controls (p < 0.001), with no change between PCA and PCA-sham rats (Table 2). CSF H2O2 was not detected in either BDL or
Table 2. Reactive oxygen species and oxidant and antioxidant enzyme activities in plasma and frontal cortex of rats with portacaval anastomosis (PCA) and bile-duct ligation (BDL) compared to respective sham-operated controls.
Oxidants
Plasma XO activity significantly increased in BDL rats, whereas there was no significant difference found in plasma of PCA rats nor in the frontal cortex of both BDL and PCA groups compared to their respective sham-operated controls (Table 2). Plasma SSAO as well as brain MAO-A and MAO-B did not show any significant difference in either of the two experimental models compared to their respective sham-operated controls (Table 2).
Antioxidants
Plasma CAT activity significantly decreased by 40% in BDL compared to BDL-sham rats. There was no significant difference in plasma CAT between PCA and PCA-sham rats. In the frontal cortex, no significant difference was found in both BDL and PCA groups compared to their respective sham-operated controls. SOD activity, in both plasma and frontal cortex, showed no significant difference in either of the experimental groups compared to their respective sham-operated controls. GR activity significantly increased in plasma of BDL rats (4.5-fold vs BDL-sham, p < 0.001) and in brains of both PCA (2.6-fold vs PCA-sham, p < 0.001) and BDL rats (2-fold vs BDL-sham, p < 0.001). No
significant changes were observed in plasma of PCA vs PCA-sham rats. There were no changes in GP activity between the two experimental groups and their respective sham-operated controls in both plasma and frontal cortex. Total GSH significantly decreased by 44% (p < 0.001) in plasma in BDL rats, whereas GSH/GSSG ratio decreased 2.3-fold (p < 0.05) compared to BDL-sham rats. No significant difference was demonstrated in plasma between PCA rats and their sham-operated controls. In the frontal cortex, no significant difference was found in both BDL and PCA groups compared to their respective sham-operated controls. All antioxidants activities are listed in Table 2.
Oxidative stress effects on lipids and proteins
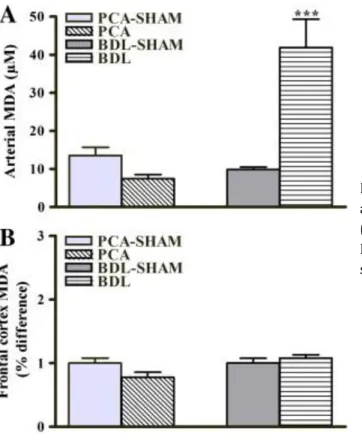
Plasma levels of TBARS significantly increased in BDL rats compared to BDL-sham (9.87 ± 0.62 μM vs BDL-sham 41.91 ± 7.40 μM, p < 0.001). No significant differences in levels of TBARS were observed in plasma of PCA rats or in the frontal cortex of either experimental group compared to their respective sham-operated controls (Figs. 2A and B).
Fig. 2. Oxidative stress effects on lipids in rats with PCA and BDL compared to respective sham-operated controls. (A) Arterial, (B) frontal cortex malondialdehyde (MDA). Data are expressed as means ± SEM. ***p < 0.001, significantly different from sham.
BBB extravasation
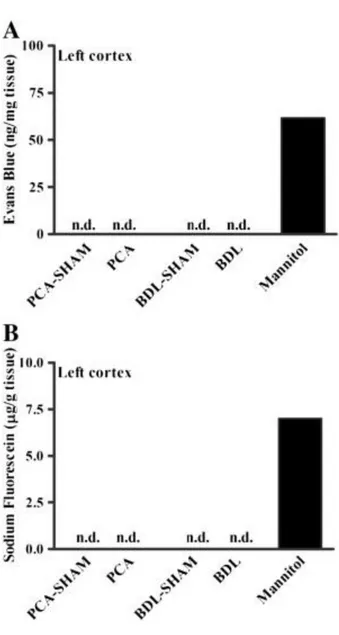
Evans blue and NaF were measured in the frontal cortex to evaluate BBB extravasation. Evans blue (961 Da) binds to albumin in plasma, forming a macromolecule, which, when present in brain tissue, denotes a large rupture of the BBB. The presence of NaF (376 Da) in brain tissue points to damages reflecting paracellular diffusion of small molecules. No trace of Evans blue or NaF extravasation was found in either BDL or PCA rats (Fig. 3).
Fig. 3. Blood–brain barrier permeability to (A) Evans blue and (B) sodium fluorescein in frontal cortex of rats with PCA and BDL compared to respective sham-operated controls.
Mannitol-injected naïve rats were used as positive controls to validate the technique (n.d., not detected, below the detection limit of the method).
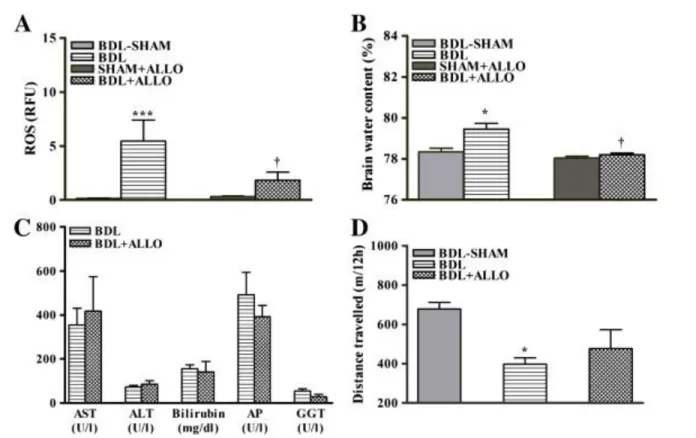
Effect of allopurinol in BDL rats
To delineate the effects of systemic oxidative stress on brain edema, BDL rats were treated with allopurinol
(xanthine oxidase inhibitor). After allopurinol treatment in BDL rats, both arterial ROS and brain edema decreased to levels similar to those seen in BDL-sham rats (Figs. 4A and B). Allopurinol treatment did not improve liver function, as no changes were found between levels of AST, ALT, bilirubin, AP, or GGT in allopurinol-treated vs untreated BDL rats (Fig. 4C). Locomotor activity (total distance traveled by BDL rats) was reduced compared to sham-operated controls and ameliorated after allopurinol (Fig. 4D).
Fig. 4. (A) Arterial ROS, (B) frontal cortex brain water, (C) liver biochemistry markers (AST, aspartate aminotransferase; ALT, alanine aminotransferase; AP, alkaline phosphatase; GGT, γ-glutamyl
transpeptidase), (D) distance traveled over a period of 12 h during the night in BDL and allopurinol-treated bile-duct ligation (BDL + ALLO) rats compared to respective sham-operated controls. Data are expressed as means ± SEM. *p < 0.01, ***p < 0.001, significantly different from sham; † p < 0.05, significantly different from untreated BDL.
Temporal resolution of ammonia, oxidative stress, and brain edema in BDL rats
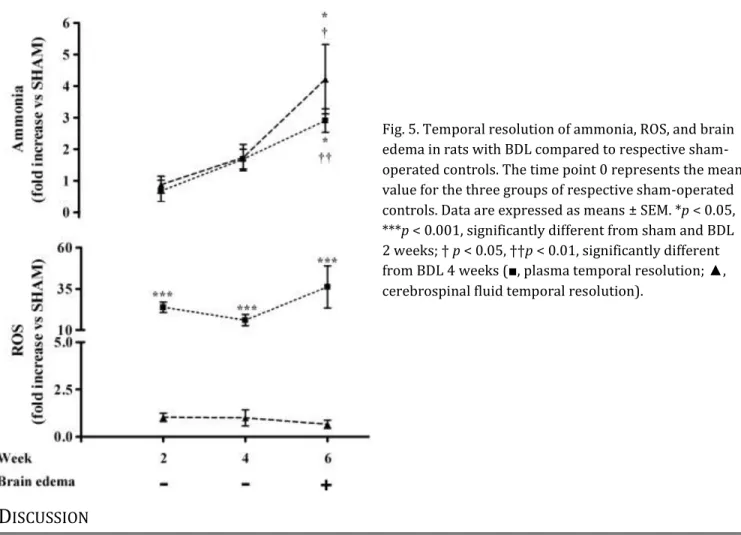
After 2 weeks of BDL, an increase in plasma oxidative stress was observed with no appearance of hyperammonemia, increased brain ammonia, or brain edema. After 4 weeks of BDL, in addition to an increased systemic oxidative stress, an increase in plasma and brain ammonia was demonstrated but still no evidence of brain edema. Brain edema appeared at 6 weeks, along with a further increase in plasma and brain ammonia compared to 4 weeks, but with similar levels of systemic oxidative stress (Fig. 5). Furthermore, another oxidative stress marker, TBARS, demonstrated a significant increase in plasma of BDL rats vs sham-operated controls at 2 (1.19-fold, p < 0.05), 4 (1.49-fold, p < 0.05), and 6 (4.23-fold, p < 0.001) weeks. No increase in ROS levels in the brain (Fig. 5) or levels of TBARS in CSF (data not shown) were found in BDL rats.
Fig. 5. Temporal resolution of ammonia, ROS, and brain edema in rats with BDL compared to respective sham-operated controls. The time point 0 represents the mean value for the three groups of respective sham-operated controls. Data are expressed as means ± SEM. *p < 0.05, ***p < 0.001, significantly different from sham and BDL 2 weeks; † p < 0.05, ††p < 0.01, significantly different from BDL 4 weeks (■, plasma temporal resolution; ▲, cerebrospinal fluid temporal resolution).
D
ISCUSSION
Results of this study reveal that chronic hyperammonemia, which consequently leads to an increase in brain ammonia, does not induce oxidative stress independently (neither centrally nor systemically) nor provoke brain edema. However, in combination, ammonia and systemic oxidative stress stimulate an increase in brain water. This conclusion was drawn from our results because brain edema is solely found in BDL rats and not in PCA rats, even with similar levels of ammonia (arterial and CSF) observed in both animal models. The role of systemic (not central) oxidative stress in the pathogenesis of brain edema was confirmed when brain water normalized along with
attenuation of systemic oxidative stress after treatment with allopurinol (inhibitor of the oxidant enzyme XO). These results suggest that ammonia and systemic oxidative stress act together in the pathogenesis of brain edema in CLF. It has previously been demonstrated that ammonia neurotoxicity leads to oxidative stress and subsequently to brain edema (astrocyte swelling) [17]. However it must be noted that these studies involved acute ammonia intoxication models (in vitro and in vivo). First, cultured astrocytes acutely exposed to ammonia (1, 5, and 10 mM) showed an increase in ROS levels [18] and cell swelling [19]. Moreover, naïve rats injected with an acute dose of ammonia (12 mmol/kg injected intraperitoneally) [20], as well as rats with acute liver failure [21] and [22], displayed severe HE along with increased oxidative stress in brain. In our study, chronic hyperammonemia and CSF ammonia levels present in PCA rats (125–250 μM; lower than brain ammonia concentrations found in animal models of acute liver failure: 1–5 mM [22] and [35]) do not stimulate severe HE or oxidative stress in brain (or in circulation).
Interestingly, a recent study in humans revealed oxidative stress markers in postmortem brain (cortical) tissue of cirrhotic patients that died with severe HE (grade 4) [36]. All in all, this suggests that the degree and/or the
acuteness of the onset of hyperammonemia is important for the induction of oxidative stress and that an oxidatively stressed brain is associated with severe HE.
Only BDL rats (not PCA rats) demonstrated an increase in systemic oxidative stress. One obvious difference between the two animal models is liver function. BDL rats displayed an increase in liver markers in comparison to PCA rats and their respective sham-operated controls. According to the Vienna Consensus on Classification of HE [37], PCA rats present type B HE (portosystemic shunting associated with hepatic atrophy and no significant intrinsic hepatocellular disease) and BDL rats present type C HE (associated with liver cirrhosis). In BDL rats, an increase in ROS and H2O2 blood levels was demonstrated along with an increase in XO activity and a decrease in antioxidant defense (decreased CAT activity and total GSH and GSH/GSSG ratio along with an increase in GR activity). A marker of oxidative stress, TBARS, was also observed to be increased in the blood of BDL rats. Moreover, plasma levels of albumin, a protein considered an important antioxidant [38], were decreased in BDL rats below the detection limit of our method. In PCA rats, a preserved oxidant/antioxidant balance was demonstrated with no changes in oxidant and antioxidant enzyme activities. Our results suggest systemic oxidative stress is a result of primary liver injury; a common finding observed in various types of liver disease such as nonalcoholic fatty liver disease, alcoholic liver disease, and viral hepatitis [39], [40] and [41], as well as cirrhosis [42], [43] and [44].
In our study no signs of central oxidative stress were observed in BDL rats, implying that systemic oxidative stress does not lead to oxidative stress in the brain. Systemic ROS could have an effect on the brain by acting directly on the luminal side of the BBB and causing BBB breakdown [45]; however, Wright et al. [46] demonstrated that the
anatomical integrity of the BBB is intact in BDL rats. This was also confirmed by our group since no brain extravasation of Evans blue and sodium fluorescein in BDL rats was observed. Nevertheless, systemic oxidative stress may induce posttranslational modifications of proteins implicated in the BBB, leading to changes in signal transduction pathways across the BBB and hyperpermeability. These aspects remain to be explored.
Furthermore, it is believed that oxidative stress is closely associated with inflammation. It has been demonstrated that proinflammatory cytokines are increased in plasma of cirrhotic patients with mHE as opposed to cirrhotic patients without HE [47] and [48]. Moreover, brain edema arises in endotoxemic BDL rats [46]. However, the relationship and dependency between ROS and inflammation during cirrhosis, as well as their effects on BBB permeability remain undefined.
XO released from the ailing liver is a major source of ROS [49]. Because an increase in XO activity was found in BDL rats, allopurinol, a XO inhibitor, was investigated as an antioxidant (oxidant inhibitor) treatment. Allopurinol (a structural isomer of the XO substrates hypoxanthine and xanthine) is oxidized by XO to a more active metabolite, oxypurinol, which acts by irreversibly binding to the active site of the enzyme [50]. Allopurinol has been previously demonstrated to reduce serum oxidative stress in stable cirrhotic patients [51]. In the present study, allopurinol-treated BDL rats displayed attenuated oxidative stress and brain edema. This protective effect was not due to an improvement in liver function because no change in hepatic function markers compared to untreated BDL rats was found. Allopurinol treatment also resulted in an amelioration but not normalization of locomotor activity, suggesting other factors in addition to brain edema may contribute to neurological dysfunction. Our results support that XO plays an important role in oxidative stress production during liver disease and therefore we propose that an antioxidant treatment directed toward inhibiting sources of ROS may be more beneficial in HE treatment than one directed toward improving antioxidant defense, including ROS scavengers.
Overall, the relationship between ammonia, systemic oxidative stress, and brain edema is a complex one: in BDL rats hyperammonemia and oxidative stress lead to brain edema, whereas in PCA rats hyperammonemia alone does not lead to brain edema. In addition, brain edema in BDL rats is attenuated after a reduction in systemic oxidative stress but also by lowering arterial levels of ammonia after AST-120 treatment, as we previously demonstrated [24]. Moreover, in patients with CLF, serum 3-nitrotyrosine (an oxidative stress marker) was found to be related to mHE, but did not correlate with concentrations of blood ammonia [43]. Together, these studies strongly suggest a
To further understand the relationship between blood ammonia and oxidative stress in the development of brain edema, we measured the pathogenetic factors along with brain water content at 2, 4, and 6 weeks after BDL. At 2 weeks, a significant increase in systemic ROS was observed without any signs of hyperammonemia or brain edema. At 4 weeks, both hyperammonemia and oxidative stress were present but no significant change in brain water content was observed. At 6 weeks, brain edema appeared and was associated with a significant further increase in ammonia levels and with similar oxidative stress levels, compared to those seen at 4 weeks. Therefore the
appearance of brain edema at 6 weeks is preceded by increased systemic oxidative stress (from week 2 to week 6) combined with a gradual chronic increase in ammonia (significantly increased at week 4 and significantly increased further at week 6). We propose systemic oxidative stress may be an important “first hit”, followed by
hyperammonemia as a “second hit” in the development of brain edema. Whether a certain threshold concentration of ammonia (≈ 120 μM) or a degree of chronic hyperammonemia is necessary for the development of brain edema remains to be investigated.
We conclude that chronic hyperammonemia and systemic (not central) oxidative stress do not lead independently to brain edema; however, when both factors are present, brain edema ensues. Our findings support the multifactorial pathogenesis of brain edema in HE and suggest systemic oxidative stress might be an important first hit, acting synergistically with ammonia to induce brain edema in chronic liver failure.
A
CKNOWLEDGMENT
This work was supported by a grant from the Canadian Institutes of Health Research.
R
EFERENCES
[1] J.S. Bajaj, K. Saeian, C.M. Schubert, M. Hafeezullah, J. Franco, R.R. Varma et al. Minimal hepatic encephalopathy is associated with motor vehicle crashes: the reality beyond the driving test Hepatology, 50 (2009), pp. 1175–1183 [2] P. Amodio, S. Montagnese, A. Gatta, M.Y. Morgan Characteristics of minimal hepatic encephalopathy Metab. Brain Dis., 19 (2004), pp. 253–267
[3] J. Córdoba New assessment of hepatic encephalopathy J. Hepatol., 54 (2011), pp. 1030–1040
[4] C.A. Stewart, F.T.B. Enders, N. Schneider, D. Felmlee-Devine, P.S. Kamath, G.E. Smith Development of a three-factor neuropsychological approach for detecting minimal hepatic encephalopathy Liver Int., 30 (2010), pp. 841–849 [5] I.J. Hartmann, M. Groeneweg, J.C. Quero, S.J. Beijeman, R.A. de Man, W.C. Hop et al. The prognostic significance of subclinical hepatic encephalopathy Am. J. Gastroenterol., 95 (2000), pp. 2029–2034
[6] D. Häussinger Low grade cerebral edema and the pathogenesis of hepatic encephalopathy in cirrhosis Hepatology, 43 (2006), pp. 1187–1190
[7] A. Rovira, B. Mínguez, F.X. Aymerich, C. Jacas, E. Huerga, J. Córdoba et al. Decreased white matter lesion volume and improved cognitive function after liver transplantation Hepatology, 46 (2007), pp. 1485–1490
[8] N.J. Shah, H. Neeb, G. Kircheis, P. Engels, D. Häussinger, K. Zilles Quantitative cerebral water content mapping in hepatic encephalopathy Neuroimage, 41 (2008), pp. 706–717
[9] A.J. Cooper, F. Plum Biochemistry and physiology of brain ammonia Physiol. Rev., 67 (1987), pp. 440–519 [10] V. Felipo, R.F. Butterworth Neurobiology of ammonia Prog. Neurobiol., 67 (2002), pp. 259–279
[11] A. Kundra, A. Jain, A. Banga, G. Bajaj, P. Kar Evaluation of plasma ammonia levels in patients with acute liver failure and chronic liver disease and its correlation with the severity of hepatic encephalopathy and clinical features of raised intracranial tension Clin. Biochem., 38 (2005), pp. 696–699
[12] J.P. Ong, A. Aggarwal, D. Krieger, K.A. Easley, M.T. Karafa, F.V. Lente et al. Correlation between ammonia levels and the severity of hepatic encephalopathy Am. J. Med., 114 (2003), pp. 188–193
[13] F. Nicolao, C. Efrati, A. Masini, M. Merli, A.F. Attili, O. Riggio Role of determination of partial pressure of ammonia in cirrhotic patients with and without hepatic encephalopathy J. Hepatol., 38 (2003), pp. 441–446
[14] K. Weissenborn, B. Ahl, D. Fischer-Wasels, J. van den Hoff, H. Hecker, W. Burchert et al. Correlations between magnetic resonance spectroscopy alterations and cerebral ammonia and glucose metabolism in cirrhotic patients with and without hepatic encephalopathy Gut, 56 (2007), pp. 1736–1742
[15] Y. He, G. Li, H. Song, T. Luo, B. Gao, J. Xu Partial pressure of NH3 in cirrhotic patients with and without hepatic
encephalopathy J. Gastrointestin. Liver Dis., 20 (2011), pp. 169–174
[16] D.J. Wilkinson, N.J. Smeeton, P.C. Castle, P.W. Watt Absence of neuropsychological impairment in
hyperammonaemia in healthy young adults: possible synergism in development of hepatic encephalopathy (HE) symptoms? Metab. Brain Dis., 26 (2011), pp. 203–212
[17] M.D. Norenberg, A.R. Jayakumar, K.V.R. Rao Oxidative stress in the pathogenesis of hepatic encephalopathy Metab. Brain Dis., 19 (2004), pp. 313–329
[18] C.R. Murthy, K.V. Rama Rao, G. Bai, M.D. Norenberg Ammonia-induced production of free radicals in primary cultures of rat astrocytes J. Neurosci. Res., 66 (2001), pp. 282–288
[19] A.R. Jayakumar, K.S. Panickar, C.R.K. Murthy, M.D. Norenberg Oxidative stress and mitogen-activated protein kinase phosphorylation mediate ammonia-induced cell swelling and glutamate uptake inhibition in cultured astrocytes J. Neurosci., 26 (2006), pp. 4774–4784
[20] E. Kosenko, N. Venediktova, Y. Kaminsky, C. Montoliu, V. Felipo Sources of oxygen radicals in brain in acute ammonia intoxication in vivo Brain Res., 981 (2003), pp. 193–200
[21] K.V. Sathyasaikumar, I. Swapna, P.V.B. Reddy, C.R.K. Murthy, A.D. Gupta, B. Senthilkumaran et al. Fulminant hepatic failure in rats induces oxidative stress differentially in cerebral cortex, cerebellum and pons
medulla Neurochem. Res., 32 (2007), pp. 517–524
[22] W. Jiang, P. Desjardins, R.F. Butterworth Hypothermia attenuates oxidative/nitrosative stress, encephalopathy and brain edema in acute (ischemic) liver failure Neurochem. Int., 55 (2009), pp. 124–128
[23] R.F. Butterworth, M.D. Norenberg, V. Felipo, P. Ferenci, J. Albrecht, A.T. Blei Experimental models of hepatic encephalopathy: ISHEN guidelines Liver Int., 29 (2009), pp. 783–788
[24] C.R. Bosoi, C. Parent-Robitaille, K. Anderson, M. Tremblay, C.F. Rose AST-120 (spherical carbon adsorbent) lowers ammonia levels and attenuates brain edema in bile duct-ligated rats Hepatology, 53 (2011), pp. 1995–2002 [25] R. Jover, E. Madaria, V. Felipo, R. Rodrigo, A. Candela, A. Compañ Animal models in the study of episodic hepatic encephalopathy in cirrhosis Metab. Brain Dis., 20 (2005), pp. 399–408
[27] B. Giray, A. Gürbay, F. Hincal Cypermethrin-induced oxidative stress in rat brain and liver is prevented by vitamin E or allopurinol Toxicol. Lett., 118 (2001), pp. 139–146
[28] A. Marmarou, W. Poll, K. Shulman, H. Bhagavan A simple gravimetric technique for measurement of cerebral edema J. Neurosurg., 49 (1978), pp. 530–537
[29] O.H. Lowry, N.J. Rosebrough, A.L. Farr, R.J. Randall Protein measurement with the Folin phenol reagent J. Biol. Chem., 193 (1951), pp. 265–275
[30] I. Carlberg, B. Mannervik Purification and characterization of the flavoenzyme glutathione reductase from rat liver J. Biol. Chem., 250 (1975), pp. 5475–5480
[31] D.E. Paglia, W.N. Valentine Studies on the quantitative and qualitative characterization of erythrocyte glutathione peroxidase J. Lab. Clin. Med., 70 (1967), pp. 158–169
[32] M. Kaya, R. Kalayci, M. Küçük, N. Arican, I. Elmas, H. Kudat et al. Effect of losartan on the blood–brain barrier permeability in diabetic hypertensive rats Life Sci., 73 (2003), pp. 3235–3244
[33] I.A. Krizbai, G. Lenzser, E. Szatmari, A.E. Farkas, I. Wilhelm, Z. Fekete et al. Blood–brain barrier changes during compensated and decompensated hemorrhagic shock Shock, 24 (2005), pp. 428–433
[34] P. Kozler, J. Pokorný Altered blood–brain barrier permeability and its effect on the distribution of Evans blue and sodium fluorescein in the rat brain applied by intracarotid injection Physiol. Res., 52 (2003), pp. 607–614 [35] M. Swain, R.F. Butterworth, A.T. Blei Ammonia and related amino acids in the pathogenesis of brain edema in acute ischemic liver failure in rats Hepatology, 15 (1992), pp. 449–453
[36] B. Görg, N. Qvartskhava, H.-J. Bidmon, N. Palomero-Gallagher, G. Kircheis, K. Zilles et al. Oxidative stress markers in the brain of patients with cirrhosis and hepatic encephalopathy Hepatology, 52 (2010), pp. 256–265
[37] P. Ferenci, A. Lockwood, K. Mullen, R. Tarter, K. Weissenborn, A.T. Blei Hepatic encephalopathy—definition, nomenclature, diagnosis, and quantification: final report of the Working Party at the 11th World Congresses of Gastroenterology, Vienna, 1998 Hepatology, 35 (2002), pp. 716–721
[38] M. Roche, P. Rondeau, N.R. Singh, E. Tarnus, E. Bourdon The antioxidant properties of serum albumin FEBS Lett., 582 (2008), pp. 1783–1787
[39] L. Malaguarnera, R. Madeddu, E. Palio, N. Arena, M. Malaguarnera Heme oxygenase-1 levels and oxidative stress-related parameters in non-alcoholic fatty liver disease patients J. Hepatol., 42 (2005), pp. 585–591
[40] S.F. Stewart, M. Vidali, C.P. Day, E. Albano, D.E.J. Jones Oxidative stress as a trigger for cellular immune responses in patients with alcoholic liver disease Hepatology, 39 (2004), pp. 197–203
[41] M. Vidali, M.-F. Tripodi, A. Ivaldi, R. Zampino, G. Occhino, L. Restivo et al. Interplay between oxidative stress and hepatic steatosis in the progression of chronic hepatitis C J. Hepatol., 48 (2008), pp. 399–406
[42] K.-C. Lee, Y.-Y. Yang, Y.-W. Wang, F.-Y. Lee, C.-C. Loong, M.-C. Hou et al. Increased plasma malondialdehyde in patients with viral cirrhosis and its relationships to plasma nitric oxide, endotoxin, and portal pressure Dig. Dis. Sci., 55 (2010), pp. 2077–2085
[43] C. Montoliu, O. Cauli, A. Urios, N. Elmlili, M.A. Serra, R. Giner-Duran et al. 3-Nitro-tyrosine as a peripheral biomarker of minimal hepatic encephalopathy in patients with liver cirrhosis Am. J. Gastroenterol., 106 (2011), pp. 1629–1637
[44] J. Zuwała-Jagiełło, M. Pazgan-Simon, K. Simon, M. Warwas Elevated advanced oxidation protein products levels in patients with liver cirrhosis Acta Biochim. Pol., 56 (2009), pp. 679–685
[45] P.B.L. Pun, J. Lu, S. Moochhala Involvement of ROS in BBB dysfunction Free Radic. Res., 43 (2009), pp. 348–364 [46] G. Wright, N.A. Davies, D.L. Shawcross, S.J. Hodges, C. Zwingmann, H.F. Brooks et al. Endotoxemia produces coma and brain swelling in bile duct ligated rats Hepatology, 45 (2007), pp. 1517–1526
[47] C. Montoliu, B. Piedrafita, M.A. Serra, J.A. del Olmo, A. Urios, J.M. Rodrigo et al. IL-6 and IL-18 in blood may discriminate cirrhotic patients with and without minimal hepatic encephalopathy J. Clin. Gastroenterol., 43 (2009), pp. 272–279
[48] D.L. Shawcross, G. Wright, S.W.M. Olde Damink, R. Jalan Role of ammonia and inflammation in minimal hepatic encephalopathy Metab. Brain Dis., 22 (2007), pp. 125–138
[49] M.G. Battelli, S. Musiani, M. Valgimigli, L. Gramantieri, F. Tomassoni, L. Bolondi et al. Serum xanthine oxidase in human liver disease Am. J. Gastroenterol., 96 (2001), pp. 1194–1199
[50] C.M. Smith, A.D. Marks, M. Lieberman Marks’ Basic Medical Biochemistry: a Clinical Approach Kluwer Health/Lippincott Williams & Wilkins, Philadelphia (2009)
[51] L. Spahr, S. Bresson-Hadni, P. Amann, I. Kern, O. Golaz, J.-L. Frossard et al. Allopurinol, oxidative stress and intestinal permeability in patients with cirrhosis: an open-label pilot study Liver Int., 27 (2007), pp. 54–60