AVIS
Ce document a été numérisé par la Division de la gestion des documents et des archives de l’Université de Montréal.
L’auteur a autorisé l’Université de Montréal à reproduire et diffuser, en totalité ou en partie, par quelque moyen que ce soit et sur quelque support que ce soit, et exclusivement à des fins non lucratives d’enseignement et de recherche, des copies de ce mémoire ou de cette thèse.
L’auteur et les coauteurs le cas échéant conservent la propriété du droit d’auteur et des droits moraux qui protègent ce document. Ni la thèse ou le mémoire, ni des extraits substantiels de ce document, ne doivent être imprimés ou autrement reproduits sans l’autorisation de l’auteur.
Afin de se conformer à la Loi canadienne sur la protection des renseignements personnels, quelques formulaires secondaires, coordonnées ou signatures intégrées au texte ont pu être enlevés de ce document. Bien que cela ait pu affecter la pagination, il n’y a aucun contenu manquant.
NOTICE
This document was digitized by the Records Management & Archives Division of Université de Montréal.
The author of this thesis or dissertation has granted a nonexclusive license allowing Université de Montréal to reproduce and publish the document, in part or in whole, and in any format, solely for noncommercial educational and research purposes.
The author and co-authors if applicable retain copyright ownership and moral rights in this document. Neither the whole thesis or dissertation, nor substantial extracts from it, may be printed or otherwise reproduced without the author’s permission.
In compliance with the Canadian Privacy Act some supporting forms, contact information or signatures may have been removed from the document. While this may affect the document page count, it does not represent any loss of content from the document.
Effect of hormone replacement therapy on retimH and optic nerve head blood flow and
topography in postmenopausal women,
and retinal tissue perfusion in ovariectomized rats
Par
Micheline Céline Deschênes
Faculté de Médecine
Thèse présentée à la Faculté des études supérieures en vue de l'obtention du grade de doctorat
en sciences biomédicales
Décembre, 2007
Université de Montréal Faculté des études supérieures
Cette thèse intitulée:
Effect of hormone replacement therapy on retinal and optic nerve head blood flow and topography in postmenopausal women,
and retinal tissue perfusion in ovariectomized rats
Présentée par: Micheline C Deschênes
a été évaluée par un jury composé des personnes suivantes:
Dre Hélène Boisjoly
présidente-rapporteuse et représentante du doyen
Dr Mark Richard Lesk
directeur de recherche
Dre Elvire Vaucher
codirectrice
Dr Sylvain Chemtob
codirecteur
Dr Sébastien Olivier
membre du jury
Dr Thomas Costin Register
RÉSlTMÉ
But: L'hormonothérapie (HT) aux estrogènes, seuls ou combinés aux progestatifs, est
prescrite aux femmes pour contrôler les symptômes reliés à la ménopause. Puisque l'HT
augmente le débit sanguin dans les organes non reproducteurs et protège contre l'atrophie du tissu cérébral dans certaines régions du cerveau, et que les récepteurs aux estrogènes et à la progestérone sont présents dans la rétine chez l'homme, nous avons étudié si l'HT améliore le débit sanguin de la rétine et de la tête du nerf optique (TNO), et protège la topographie du TNO et la fonction des cellules ganglionnaires (CGs) de la rétine chez les femmes ménopausées. De plus, les récepteurs aux estrogènes étant présents dans la rétine du rat, nous avons développé un modèle de rate ménopausée afin d'évaluer si l'estradiol altère le débit sanguin de la rétine.
Méthodologie: Soixante-cinq femmes ménopausées d'âges similaires ont été évaluées,
vingt-neuf n'ont jamais utilisé l'HT (0HT) et trente-six ont utilisé l'HT (+HT) depuis le début de leur ménopause. Le débit sanguin de l'artère inféro-temporale de la rétine
(AITR), et des régions nasales et temporales pérripapillaires a été mesuré dans un œil à
l'aide du "Canon Laser Blood Flowmeter" et du "Heidelberg Retina Flowmeter". Les douze paramètres stéréométriques de la TNO et l'électrorétinogramme évoqué par
inversion d'un damier (PERG) ont été mesurés à l'aide du "Heidelberg Retina
Tomograph" et du système VERIS™. Pour le modèle de rate ménopausée, des rates
matures (Rattus norvegicus) ont subi une ovariectomie et l'implantation sous-cutanée de
capsules silastic contenant de l'estradiol (EÛ ou placébo. Six semaines plus tard,
après l'injection d'un traceur radioactif diffusible, le N-1sopropyl-p-[14C]-iodoamphétamine ([14C]_1MP). L'1CR a été mesuré dans quatre isoptères concentriques à chaque quadrant, à l, 2, 3 et 4 mm de distance du centre de la TNO, de la rétine
montée à plat.
Résultats: Le groupe +HT a présenté des valeurs significativement plus élevées pour le
débit sanguin de l'AITR (15.4 ± 3.4 vs 12.5 ± 2.9 !-tL/min, p=0.006) et du volume de
l'anneau neurorétinien de la région entière de la TNO (0.438 ± 0.136 vs 0.380 ± 0.143
mm3, p=0.032), ainsi que pour le volume de l'anneau neurorétinien (0.066 ± 0.041 vs
0.050 ± 0.030 mm3, p=0.042), de la hauteur de la variation du contour (0.353 ± 0.099 vs
0.289
±
0.101 mm, p=O.Oll), de l'épaisseur moyenne (0.l94±
0.053 vs 0.167±
0.058mm, p=0.033) et de la surface (0.238 ± 0.068 vs 0.l98 ± 0.073 mm2, p=0.020) de la
couche des fibres nerveuses rétiniennes de la région inféro-temporale de la TNO comparativement au groupe 0HT. Chez les rates ménopausées, le traitement à l'E2 a
induit une augmentation significative des 1CRs de 40.6% (p=0.03) pour l'isoptère à 2
mm, 44.2% (p=0.04) à 3 mm et 31.4% (p=0.04) à 4 mm comparativement aux rates contrôles.
Conclusion: Ces résultats indiquent que l'utilisation de l'HT chez les femmes postménopausées est associé à une amélioration du débit sanguin de la rétine, et une couche des fibres nerveuses rétiniennes plus épaisse. De plus, le traitement à l'E2 chez les rates ovariectomisées a augmenté la perfusion rétinienne.
Most clés: femmes, ménopause, rats, ovariectomie, estrogènes, hormonothérapie, débit sanguin, rétine, fibres nerveuses rétiniennes, neuroprotection
ABSTRACT
Aim: Postmenopausal honnone therapy (HT) consisting of estrogens alone or combined
with progestagens, is prescribed to women in order to alleviate postmenopausal
symptorris. Since HT increases blood flow in non-reproductive organs and prevents
cerebral tissue atrophy in sorne brain regions, and estrogen and progesterone receptors
are present in the human retina, we investigated whether HT improves retinal and optic
nerve head (ONH) blood flow, and protects ONH topography and the function of retinal
ganglion cells (RGCs) in postmenopausal women. Moreover, since estrogen receptors
are present in the rat retina, we developed a menopaused ratmodel to assess the effects
of estradiol on the retinal blood flow.
Methods: Sixty-five healthy postmenopausal women of similar age were investigated,
twenty-nine of them who had never used HT (0HT) and thirty-six who were HT users
(+HT) since their ·'menopause onset. Blood flow of the infero-temporal retinal artery
(lTRA), both nasal and temporal peripapillary retinal areas, and ONH rim were
measured in one eye using the Canon Laser Blood Flowmeter and the Heidelberg Retina
Flowmeter. The 12 standard stereometric parameters Of the ONH and the pattern electroretinogram (PERG) were measured using the Heidelberg Retina Tomograph and
the VERIS ™ system. For the menopaused rat model, mature female rats (Rattus
norvegicus) were ovariectomized and silastic capsules containing either estradiol (E2) or
placebo were implanted subcutaneously. Six weeks later, the retinal uptake index (RUI),
an indicator of the retinal tissue perfusion, was measured following the injection of the
measured in four concentric isopters of aIl quadrants, at 1, 2, 3 and 4 mm away from the centre of the ONH, in the whole-mount retina.
Results: The +HT group presented significantly greater blood flow of the ITRA (15.4 ±
3.4 vs 12.5 ± 2.9 !-tL/min, p=0.006) and greater rim volume for the entire ONH region
(0.438 ± 0.136 vs 0.380 ± 0.143 mm3, p=0.032), as weIl as greater rim volume (0.066 ±
0.041 vs 0.050 ± 0.030 mm3, p=0.042), height variation contour (0.353 ± 0.099 vs 0.289
± 0.101 mm, p=O.Oll), mean thickness (0.194 ± 0.053 vs 0.167 ± 0.058 mm, p=0.033)
and cross-sectional area (0.238 ± 0.068 vs 0.198 ± 0.073 mm2, p=0.020) of the retinal
nerve fiber layer for the infero-temporal region of the ONH compared to those of the
0HT group. ln the menopaused rat model, E2 treatment significantly induced an
increase in the RUIs by 40.6% (p=0.03) for the 2 mm isopter, 44.2% (p=0.04) for the 3 mm isopter and 31.4% (p=0.04) for the 4 mm isopter compared to those in placebo animaIs.
Conclusion: These findings indicate that the use of HT in postmenopausal women was
associated with improved retinal blood flow and thicker retinal nerve fiber layer.
Moreover, the E2 treatment in ovariectomized rats was associated with enhanced retinal
tissue perfusion.
Keywords: women, menopause, rats, ovariectomy, estrogens, hormonotherapy, blood flow, retina, retinal nerve fiber layer, neuroprotection
CONTENTS
Résumé ... 3 Abstract. ... 6 Contents ... 8 List of tables ... 12 List of figures ... 15 List of acronyms ... 17 List of abbreviations ... 21 Dedication ... 22 Acknowledgments ... 23 Preface ... 25 1.0 Introduction ... 28 1.1 The eye ... 281.2 Arterial supply to the retina eye ... 31
1.2.1 Retinal vessels ... 3 3 1.2.2 Choroid ... 34
1.2.3 Optic nerve ... 34
1.2.4 Control of the ocular circulation ... 35
1.2.4.1 Perfusion pressure ... 35
1.2.4.2 Endothelium ... 36
1.2.4.3 Metabolic demand ... 38
1.2.4.4 Nervous controL ... 38
1.3 Techniques empIoyed to assess ocular blood flow ... .40
1.3.1 In humans ... 40
1.3.2 In animaIs ... 51
1.4 Glaucoma ... 55
1.5 Age-related macu1ar degeneration ... 58
1.6 Estrogens ... 60 1.6.1 Vasomotor effect. ... 63 1.6.1.1 N itric oxide ... 65 1.6.1.2 Prostacyc1in ... 67 1.6, 1.3 Potassium ... 68 1.6.1.4 Endothelin ... 68 1.6.1.5 Angiotensin IL ... 70 1.6.1.6 Thromboxane A2 •.•.•.•.•.••••••.•••••.••.•.•••..•.••••.•.•.•••...•.•....•.... 71 1.6.1.7 Calcium ... 72 1. 6.2 Neuronal effect. ... 72 1. 7 Progesterone ... 73 1. 7.1 Vasomotor effect. ... 74 1.7.2 Neuronal effect. ... 75 1.8 Menopause ... 76
1.9 Postmenopausa1 hormone therapy (HT) ... 77
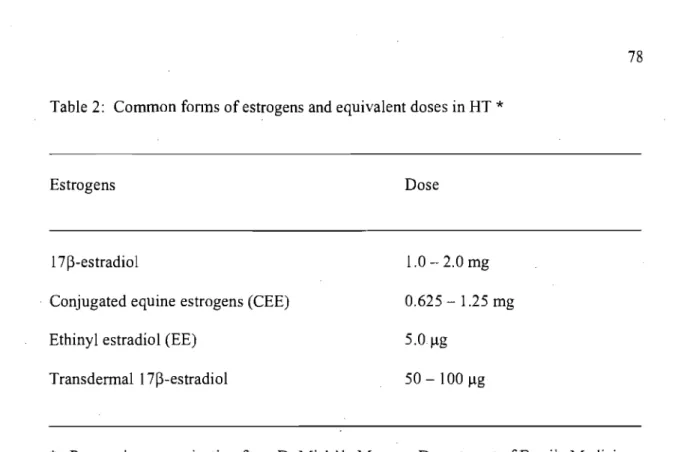
1.9.1 Estrogen therapy ... 77
1.9.2 Progestagen therapy ... 79
1.9.3 Vasomotor effect. ... 81
•
•
10
1.9.5 Guidelines and recommendations for HT use ... 85
1.10 Relationship between estrogens and HT with glaucoma andARMD ... 87
2.0 Aim of the study ... 89
3.0 Meth<;>dology ... 91
3.1 Observational study in postmenopausal women ... 91
3.2 Menopaused rat model. ... 109
4.0 Results: ... 117
Paper #1 titled "Effects of Postmenopausal Hormone Therapy on Retinal And Optic Nerve Head Blood Flow, and Retinal Nerve Fiber Layer in Postmenopausal Women" ... 118
Paper #2 titled "17~~estradiol increases the retinal tissue perfusion in a menopausa1 rat model" ... · ... 192
5.0 Discussion ... 227
5.1 Effects ofHT on retinal blood flow ... 227
5.2 Vasomotor mechanisms of estrogens on retinal blood flow ... 229
5.3 Vasomotor mechanisms of progestagens on retinal blood flow ... 229
5.4 Possible vasomotor effect of equol on retinal blood flow ... 230
5.5 Effect of l7~-estradiol on weight, hematocrit and blood pressure ... 231
5.6 Possible effect of 17~-estradiol on vascular density ... 234
5.7 Effects of HT on ONH Topography ... 235
5.8 Effect of HT on the functionality of RGC. ... 237
5.10 Possible effect HT on visual function ... 240
5.11 Possible neurotrophic effect of HT ... 240
5.12 Study limitations ... 241
6.0 Conclusion ... 244
7.0 Future directions ... 247
8.0 References ... 249
9.0 Annexes ... 305 Society of Obstetricians and Gynaecologists of Canada Practice Guidelines
LIST OF TABLES
Table 1: Concentration ranges of endogenous estradiol, estrone and progesterone during the follicular, luteal and postmenopausal period in women ... 77
Table 2: Common forms of estrogens and equivalent doses in HT ... 78
Table 3: Types ofprogestagens used in combination with estrogens in HT ... 80
Paper #1
Table 1: Clinical and Gynecological, and Ophthalmological Characteristics for The Whole Population Study of Women Who Never Used Postmenopausal Hormone Therapy (0HT) and Who Were HT Users (+HT) and for Sub-Population Study for CLBF (A), SLDF (B), HRT (C) and PERG (0) Assessments ... 148
Table 2: Type of Postmenopausal Hormone Therapy and Their Active Ingredients Prescribed and Used by the +HT Postmenopausal Women (n=36) ... 150
Table 3: Frequency Distribution of +HT (n=36) Categorized by Their Active Ingredients ... 151
Table 4: Diameter, Veloeity and Flow of the Infero-Temporal Retinal Artery Measured in 0HT and +HT Postmenopausal Women ... 153
Table 5: Volume, Veloeity and Flow of the Temporal, Rim and Nasal Areas of the Optie Nerve Head Regions Measured in 0HT and +HT Postmenopausal Women ... 155
Table 6: Standard Stereometrie Parameters of the Entire Optie Nerve Head (0-360°) Measured in 0HT and +HT Postmenopausal Women ... 157
Table 7: Standard Stereometrie Parameters of the lnfero-Temporal Region Optie Nerve Head (270-360°) Measured in 0HT and +HT Postmenopausal Women ... 158
Table 8: Components of the Pattern Eleetroretinogram Measured in 0HT and +HT Postmenopausal Women ... 160
Table 9: Effeet of Estrogens Therapy and Estrogens Combined with Progestagens Therapy on Different Outeome Variables ... 163
Paper#2
Table 1: Effects of 17p-estradiol (E2) treatment on the physiological parameters
monitored in the conscious OVx rats after two hours of recovery from anaesthesia and
prior to the injection of [14C]_IMP ... 207
Table 2: Effects of E2 treatment on local retinal uptake index of [14C]_IMP in OVx
conscious rats at different isopter distances from the centre of the optic nerve head ... 211
LIST OF FIGURES
Figure 1: The eye ... 28
Figure 2: Histo1ogy and schematic representation of the retina11ayer ... 30
Figure 3: Fundus picture of the optic nerve head and retina1 vesse1s ... 31
Figure 4: Gross anatomy of the arterial supply to the eye ... 32
Figure 5: Vasculature of the optic nerve head ... 33
Figure 6: B100d vesse1 wall ... 37
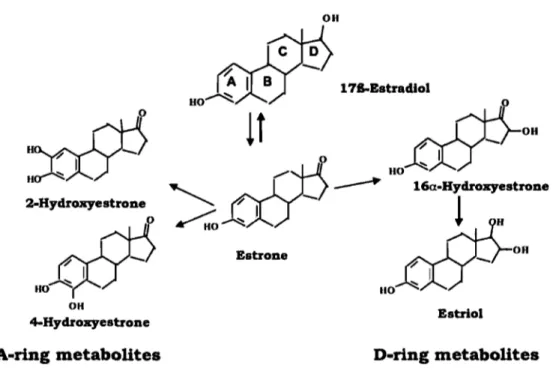
Figure 7: Chemica1 structures of the parent hormone 17B-estradio1 and its main A- and D-ring metabolites ... 61
Figure 8: Putative mechanisms for the action of estrogens on the vascular system ... 65
Figure 9: Example of a CLBF measurement from a normal subject. ... 97
Figure 10: Example of a SLDF perfusion image from a normal subject.. ... 100
Figure Il: Example of ONH topography measurement from a normal subject ... 103
Figure 12: Example of a transient pattern electroretinogram from a normal subject. .. 106
Figure 13: Schematic representation of a whole-mount retina showing the regions of interest (ROI) measured ... 115
Paper #1
Figure 1: Example ofa CLBF measurement from a normal subject.. ... 133
Figure 2: Example ofa SLDF perfusion image from a normal subject ... 136
Figure 3: Example ofONH topography measurement from a normal subject ... 139
Figure 4: Example of a transient pattern electroretinogram from a normal subject. .... 142
Paper #2
Figure 1: Schematic representation of a whole-mount retina showing the regions of interest (ROI) measured ... 204
Figure 2: Serum 17~-estradiol (E2) (A) and equol (B) level in the ovariectomized
female rats treated with silastic capsules either containing placebo or E2 ... 208
Figure 3: Representative whole-mount retina autoradiograms displayed in pseudocolor from an ovariectomized rat treated with placebo silastic capsules and an ovariectomized
rat treated with E2 silastic capsules ... 21 0
Figure 4: Percent of changes (OVx+E2 versus OVx) of the local retinal uptake index
LIST OF ACRONYMS
AFFPIA ACG ARMD ARVOAT
AU
BF
BMI BP BPrncanCBF
CBGCCD
cdlm2CDI
CEE CHDCLBF
CV DE2
EDHF
automatic full-field perfusion image analysis angle-c1osure glaucoma
age-related macular degeneration
Association for Research in Vision and Ophthalmology angiotensin
arbitrary unit blood flow body mass index blood pressure mean blood pressure cerebral blood flow
corticosteroid-binding globulin charged-coupled device
candela per metre squared color Doppler imaging conjugated equine estrogens coronary heart disease
Canon Laser Blood flowmeter cardiovascular disease
diameter
17~-estradiol
EDV ER ERa ER~ ET FA FMD FRSQ GABA Hct HDL HERS HRF HT 0HT +HT HRTI [14C]_IMP ICGA IMS IOP IRB ITRA
end diastolic velocity
estrogen receptor
estrogen receptor alpha
estrogen receptor beta
endothelin
fluorescein angiogram
flow mediated vasodilation
Fonds de la Recherche en Santé du Québec
y-aminobutyric acid
hematocrit
high-density lipoprotein
Heart and Estrogens/Progestins Replacement Study
Heidelberg Retina Flowmeter
hormone therapy
not hormone replacement therapy user
hormone replacement therapy user
Heidelberg Retina Tomograph 1
N-Isopropyl-p-[14C]-iodoamphetamine
indocyanine green angiogram
International Menopause Society
intraocular pressure
institutional review board
LDF laser Doppler Flowmetry
LDL low-density lipoprotein
LDV laser Doppler veloeimetry
MPA medroxyprogesterone
MI myoeardial infaretion
NETA norethindrone aeetate
NO nitrie oxide
NOS nitrie oxide synthase
NSERC Natural Sciences and Engineering Research Council
NTO normal tension glaucoma
OCT optical coherence tomography
OAO open-angle glaucoma
OC oral contraceptive
ONH optie nerve head
OPP oeular perfusion pressure
OVX ovariectomy
P progesterone
PVEP pattern visual evoked potentials
PERO pattern electroretinogram
POh prostacyclin
Pl pulsatility index
POBF pulsatile ocular blood flow
PR progesterone receptor
RBC red blood cell RGC retinal ganglion cell RI resistivity index
RPE retinal pigmentary epithelium rps reversaI per second
RNFL retinal nerve fiber layer ROI region of interest RUI retinal uptake index RVA Retinal Vessel Analyzer
RY reproductive year
SERM selective estrogen receptor modulator SHBG sex hormone-binding globulin
SLDF Scanning Laser Doppler Flowmetry
SOGC Society of Obstetricians and Gynaecologists of Canada SPECT single photon emission computed tomography
T time
TXA2 thromboxane A2
VA visual acuity
VEGF vascular endothelial growth factor VEP visual evoked potential
LIST OF ABBREVIATIONS
Vel Vel rncan Vol velocity mean velocity volumeDEDICATION
To my husband Gordon for his constant loving support.
•
23ACKNOWLEDGMENTS
1 would like to thank the Natural Sciences and Engineering Research Council of Canada (NSERC) and Jacqueline Avard Summer Scholarship University of Montreal for giving me scholarships and the Fonds de Recherche en Ophtalmologie de l'Université de Montréal (MRL and MCD), Glaucoma Research Society of Canada (MRL and MCD), the Vision Research Network (FRSQ) (EV), and the E.A. Baker Foundation for the Prevention ofBlindness (EV) who funded these studies.
The realization of this doctoral work is the result of a wonderful team to whom 1 am sincerely gratefuL
First of aIl, 1 want to thank aIl my research colleagues, Dr Denise Descovich, Dr Fawzia Djafari, Dr Marcelo Wajszilber, Muriel Bégin, Claudette Plante, Lucie Budack, Mireille Arpin, Caroline Claveau, Florence Dotigny, Roland Yang, Manon Lambert, Denis Latendresse, Vicki Stagg and Miguel Chagnon for their much appreciated expertise and assistance during the realization of my doctoral work and degree.
This doctorate degree would not have been possible without the invaluable teaching and guidance of my supervisor, Dr Mark Richard Lesk, and co-supervisors Drs Elvire Vaucher and Sylvain Chemtob. As weIl, Drs Michèle Moreau and Louis Oranger shared their knowledge about menopause and hormone replacement therapy and facilitated the
recruitment of subjects. It was an honour and privilege to have worked with all of these people as mentors.
l also want to thank Dr George A. Kuchel from the University of Connecticut Center on Aging and Dr Tomi S. Mikkola from the Department of Obstetrics and Gynecology at the Helsinki University Central Hospital for their collaboration and expertise about estradiol treatment and assays. Dr Gordon H. Fick from the Department of Community Health Sciences at the University of Calgary provided his expertise and assistance in the statistical analysis.
l want to express my thanks to all the menopausal women who participated as subjects in the study and gave their precious time for the advancement of knowledge on menopause and vision.
Finally and as important, l would like to thank my family, Gordon, Georgette, Helen and Jim for their wonderful help, support and encouragement throughout this longjoumey ....
PREFACE
Menopause is the period corresponding to the pennanent cessation of ovarian foHicular activity and subsequent faH in en doge nous estrogens and progesterone production in aging women. The average age at menopause is around 50 years.
Women undergoing menopause experience physiological and metabolic changes that may or may not be symptomatic. These changes are translated into vasomotor instability (hot flushes, night sweats), urogenital tissue atrophy, vaginal dryness, dry skin, bone and collagen loss, and psychological symptoms such as insomnia, depression, irritability, lethargy/fatigue and loss of libido. As well, ocular changes occur such as the onset of dry eyes (keratoconjunctivitis sicca), senile cataract, presbyopia, ptosis of the eyelids, glaucoma and age-related macular degeneration (ARMD).
Particularly in glaucoma and ARMD, recent epidemiological studies have reported that reduced exposure time to endogenous estrogens defined as late menarche, early menopause onset and decreasing duration of reproductive year increases the risk in the development and progression of glaucoma and ARMD in postmenopausal women. As, well, the use of postmenopausal honnone therapy (HT) decreases this risk. Impaired ocular blood flow contributes to the etiology and progression of glaucoma and ARMD. The apparent protective role of estrogens and HT against glaucoma and ARMD in postmenopausal women could result from the vasomotor effect of estrogens by providing a better blood flow as well as a protective effect on the optic nerve head
(ONH) topography. However, there is no direct evidence that estrogens and HT influence the retina and ONH head flow and the ONH topography.
The research area of this thesis focuses on investigating whether estrogens and HT
influence the blood flow in the retina and ONH, and the ONH topography. An
introductory chapter will present the basic knowledge of the eye and histology, anatomy of the arterial ocular supply, control of the ocular circulation and the techniques employed to measure the ocular circulation. This chapter will also discuss glaucoma and ARMD, the estrogen and progesterone hormones and the CUITent knowledge on menopause and postmenopausal hormone therapy and their relation to glaucoma and ARMD. The second and third chapters will present the aim of two studies designed to investigate whether estrogens and HT influence the blood flow in the retina and ONH blood, and the ONH topography. An observational study investigates the long-term effects of estrogen depletion and the use of HT on retinal and ONH blood flow, and ONH topography in a group of healthy postmenopausal women. The second study investigates the long-term effect of estrogen depletion and estrogen treatment on the retinal tissue perfusion using a radioactive blood flow tracer, the N-Isopropyl-p-[14C]-iodoamphetamine in a menopausal rat model. A fourth chapter reports the findings of these two studies followed by a discussion chapter on the interpretation of these findings.
We hope that this postdoctoral work provides a better understanding of how menopause, estrogens and HT play roles in the ocular circulation and optic nerve head topography in an attempt to explain the link between the hormonal status of estrogens and progesterone
throughout a wornan's life and the risk of developing glaucorna and ARMD in the aging wornan.
1.0
INTRODUCTION
1.1 The eye
The eye is the organ of vision. The retina is the photosensitive layer in the innermost part of the eye responsible for the conversion of different light energy quanta into nervous pulses. Hs externai surface is in contact with the choroid and its internaI surface is in contact with the vitreous body (Fig. 1).
Figure 1: The eye. (From http://www.basiclenses.comiimages/uploadslEye Diagram National Eye Institute Refno NEA08.jpg)
The histology of the retina consists of eleven layers of cells. They are listed as follows along the path of the incident light: (Fig. 2):
1) inner limiting membrane (glial cell fibers separating the retina from the vitreous body
2) nerve fiber layer (astrocytes and bundles of the retinal ganglion cells (RGCs) axons surrounded by neuroglia)
3) retinal ganglion celllayer (cell nuclei)
4) inner plexiform (synapses between the bipolar, horizontal and amacrine cells with RGCs)
5) inner nuclear layer (cell nuclei of the bipolar cells, horizontal and amacrine cells) 6) outer plexiform layer (synapses between the bipolar cells, horizontal and amacrine
cells with photoreceptors)
7) outer nuclear layer (cell nuclei of the photoreceptors)
8) outer limiting membrane (sieve-like plate of the rods and cones) 9) layer of the rod and cone outer segments
10) retinal pigmentary epithelium
L 1 9 h t 1.1..., llmitlncjmmllw_ - - - --2.L~ofop(k,-fi~ 1 ... 01 goongIlon (~ 4. _ plrxllonn ~ S.I~nuc:iNr~ /IIpoIarr"" 6. OUt .. pW.1fonn ~ Horilooral cftk 7. 0Utr< nud .... ~ 8. o.-Umlting ~_ -9. ~of rod,.ndconn lo.1IetiNI pigment rpthrium Il. Bruch', membr_
-Figure 2: Histology and schematic representation of the retinallayers. (From Lang, GK. Ophthalmology. A Poeket Textbook Atlas. Stuttgart, Germany: Georg Thieme Verlag;
2000:301)
Ali the nerve fiber layer bundles converge to form the neuroretinal rim of the optic nerve head (ONH) (Fig. 3). The cup of the optic disc is a concave region of the optic nerve head. The fibers exit the eye through a sieve-like structure called the lamina cribrosa and form the optic nerve.
Cilioretinal vessel Neuroretinal rim Optic cup Vein Artery
Figure 3: Fundus picture of the optic nerve head and retinal vessels. (From Lang, GK. Ophthalmology. A Poeket Textbook Atfas. Stuttgart, Germany: Georg Thieme Verlag; 2000:360)
1.2 Arterial supply to the eye
The ocular circulation is provided by the ophthalmic artery, which is a branch of the internai carotid.! The ophthalmic artery enters the orbit of the eye and branches into the central retinal artery, two or three posterior ciliary arteries and several anterior ciliary arteries (Fig. 4). The central retinal artery enters the optic nerve at approximately 10 mm behind the globe, then at the exit of the optic nerve head, is divided into four retinal vessels, each supplying one of the four quadrants of the retina (Fig. 3). The posterior ci liary arteries divide into lOto 20 short posterior ciliary arteries and, as a ruIe, two long posterior ciliary arteries.! The short and long posterior ciliary arteries pierce the sciera to supply the choroid. The short posterior ciliary arteries pierce the scIera at the
posterior pole, while the long posterior ciliary arteries pIerce the sciera toward the periphery. The circle of Zinn-Haller represents the scierai penetration of the short posterior ciliary arteries organized in a ring fashion around the optic nerve.1 The outer
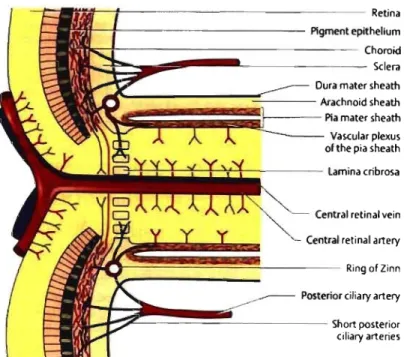
portion of the optic nerve behind the lamina cribrosa is supplied by the pial vessels, whereas the inner portion is supplied by branches of the central retinal artery, while running within the nerve, and anastomose with the superficial pial vessels (Fig. 5).
BoNEs. VESSELS. Al'ID NEIlVES
Figure 4: Gross anatomy of the arterial suppl y to the eye showing the internai carotid (17), ophthalmic artery (18), central retinal artery (35), medial posterior ci liary artery (38) and short ciliary branches of the lateral posterior ciliary artery (39). (From Zide BM, Jelks GW. Bones, vessels and nerves. In Surgical Anatomy of the Orbit. New York, USA: Raven Press, 1985: II)
1Hif--:-- - - -- - -- -- - - - Retina ' - - - f -- - - -- - - -Pigment epithellum
~~--- Choro~
--..;~
~
.... _ - - --- - - - -- Sciera Dura mater sheath~
~
=ij=;=~=t
=
==
AraChnOid
Pia mater sheath sheath Vascular plexus01 the pia sheath
C3-+-+-+-+-+-~~---- Lamina cribrosa Central retinal vein
,
~
~=
;=;=;L--=-c
:
e
=
nt
=
ral
retinal artery; Ring 01 Zinn
Posterior ciliary artery
t
t~
~~~~~
c
---
Shortposteriorciliary arteries
Figure 5: Vasculature of the optic nerve head. (From Lang, GK. Ophthalmology. A
Poeket Textbook Atlas. Stuttgart, Gennany: Georg Thieme Verlag; 2000:362)
1.2.1 Retinal vessels
The retinal vessels are distributed within the inner two-third portion of the retina including the nerve fiber layer, with the exception of a capillary-free zone within the fovea. The fovea is the central region of the retina (diameter 1500 !lm) and has the greatest cone density. The foveal avascular zone (F AZ) is within the fovea (500 !lm) and comprises the foveola (350 !lm), characterized by the absence of inner retinal layers and the presence of cones as the only photoreceptors. The intervening capillaries of the retinal vessels are organized in a multilaminate fashion. In the posterior pole, the retinal capillaries fonn several layers and are greater in number than in the more peripheral retina.2 The peripapillary retina has a superficial layer of fine capillaries. If present, a
cilioretinal artery which may be a direct branch of the ciliary or choroidal arteries,
supplies a variably sized region of the retina, temporal to the optic nerve.2
1.2.2 Choroid
The choroid supplies the outer one third portion of the retina incIuding the
photoreceptors, bipolar cells and RPE.2,3 It extends from the ora serrata anteriorly to the
optic nerve head posteriorly. Histologically, the choroid consists of three layers layers: the outermost layer of large vessels (Haller's layer), the medium vessellayer (Sattler's layer) and the inner choriocapillaris layer, which is the capillary layer of the choroid. The suprachoroidal space is a virtual space between the choroid and the sciera. The outer half of Bruch's membrane can be considered as part of the choroid, whereas its inner half can be considered as a part of the retinal pigmentary epithelium. Due to its avascular nature, the central fovea depends entire1y on the blood supply provided by the choroid.
1.2.3 Optic N erve
There are four anatomical regions constituting the optic nerve: 1) the surface layer of the nerve fiber layer, 2) the prelaminar region, 3) the lamina cribrosa and 4) the retrolaminar
region.4 The nerve fiber layer region gets its blood supply from the retinal arterioles.
The pre1aminar region receives blood supply from the choroid. The lamina cribrosa receives its blood supply from the short posterior ciliary arteries, either directly or from the circIe of Zinn-Haller formed by the short posterior ciliary arteries. The retrolaminar region gets a dual source of blood supply, from the peripheral centripetal vascular bed
formed by the pial vessels and from the axial centrifugaI vascular bed derived from branches of the central retinal artery (Fig. 5).
1.2.4 Control of the ocular circulation
To maintain the functional integrity of the blood flow in the vascular architecture of the retina, choroid and optic nerve head, several local and systemic factors regulate the ocular circulation. The local factors are the 1) perfusion pressure, 2) endothelium activity, and 3) metabolic demand. The systemic factors are the 1) innervations from the autonomie nervous system and 2) blood gases.I,5-12
1.2.4.1 Perfusion pressure
The perfusion pressure is the entering force of the blood through the intraocular blood vessels. lt is determined by the difference between the two-third mean arterial pressure (MAP) (the diastolic pressure
+
1/3 of the systemic blood pressure pulse) in the arteries entering the eye and the pressure in the veins leaving it. The intraocular pressure (IOP) is normally almost identical to the pressure in the veins. Therefore, the ocular perfusion pressure (OPP) is calculated using the following equation: 1OPP
=
2/3 MAP-IOPwhere MAP = Diastolic pressure
+
1 /3 (Systolic pressure- Diastolic pressure)Consequently, it is expected that a change in IOP or BP cou Id affect the perfusion pressure to the eye. However, several studies have shown that the retinal vessel
circulation in humans has an autoregulatory property allowing constant blood flow
regardless of moderate changes in perfusion pressure.13•14 This is called myogenic
autoregulation of the perfusion pressure. Myogenic autoregulation is the maintenance of consistent blood flow in the presence of altered perfusion pressure. The principle is that myocytes sense the transmural pressure, which is the difference in pressure across the wall of vessel, i.e. the internaI blood pressure minus the external pressure acting on the
vessel.15 In the event that the internaI pressure is raised, the myocytes undergo a
mechanical stretch and activate their stretch-sensitive non-selective cation channels and chloride channels. The resulting ionic currents depolarize the myocytes, which increase
the open probability of L-type Ca2+ channels leading to the contraction of the arterial
wall. In ocular circulation, myogenic autoregulation occurs with BP and IOP changes.
Myogemc autoregu ahon occurs m t e retma vesse s, · 1 . . h . 1 1 16-20 ON2122 . an c orm . d h 'd 23-25
There is clinical evidence that points to impaired autoregulation mechanisms in patients who suffer of diabetes,26 glaucoma,27-30 and age-related macular degeneration. 31
1.2.4.2 Endothelium
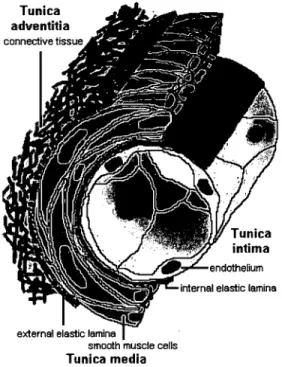
The blood vessel wall consists of three different layers: the intima (innermost layer also called the endothelium), media (middle layer also called the smooth muscle), and the adventitia (outer layer) (Fig 6).15 The intima is a layer offlat endothelial cells and is the
main barrier to plasma proteins. It secretes many vasoactive products and is
mechanically weak, while the media supplies the mechanical strength and contractile power. The media is made of spindle-shaped smooth muscle cells arranged circularly.
The adventitia is a connective tissue sheath with no distinct border. It serves to secure
Tunica adventitia
Figure 6: Blood vessel wall.
smoolh muscle cells Tunica media
(From http://www.lab.anhb.uwa.edu.au/mb140/CorePagesNascularNascular.htm)
The endothelium controls the tone of the underlying vascular smooth muscle (VSM) by releasing endothelium-derived relaxing factors (nitric oxide, prostacyclin, and endothelium-derived hyperpolarizing factors) and endothelium-derived contracting factors (endothelin-l , thromboxane A2, angiotensin (AT), superoxide anions, and endoperoxides).32 The VSM controls the radius of the blood vessels and consequently
the blood flow running through it. The VSM contraction is triggered by a rise in Ca2+
ion concentration in the cytoplasm leading to the activation or shortening of the actin
and myosin filaments. 15
Nitric oxide (NO), prostacyclin (PGh) and endothelin (ET) are strong vasoactive factors (see reviews).33,34 Nitric oxide is an endothelial vasodilating compound and is believed
to be involved in the basal blood flow in the retina, choroid and optic nerve.33 AIso, nitric oxide acts as a vasodilator mediator for acetylcholine, bradykinin, histamine, substance P and insulin. Prostacyc1in is also present in the retina and intravitreal injection of prostacyc1in has been shown to increase retinal blood flow. 35,36 Endothelin is a vasoconstrictive peptide released by the endothelium. Its vasoconstrictive effect has been observed in ophthalmic, ciliary and retinal arteries in animal studies?4 In humans, systemic injection of endothelin induces a reduction of the pulsatile blood flow in the choroid and optic nerve. 37
1.2.4.3 Metabolic demand
The retina, choroid and optic nerve head induce changes in the ocular circulation in response to dark or light stimulation in order to meet the metabolic demand. Human studies have shown that blood flow at the optic disk surface increases from dark to light
condition,38 and that choroidal blood flow decreases from light to darkness.39
Moreover, the diameter of retinal arteries and veins, blood velocity in the macular capillary and blood flow at the optic disc surface have been shown to increase during a
flicker4o-43 or a pattern stimulation.44 Therefore, retinal vessels, the choroid and the
optic nerve head circulation have an autoregulatory metabolic property in order to meet the physiologic demand in response to the level of ambient light or light stimulation.
1.2.4.4 Nervous control
Sympathetic and parasympathetic innervation are present in the choroid1,45-48 but not in
blood flow.3 The sympathetic adrenergic innervation is present in the central retinal artery but absent in the retinal vessels.47,48 It has been postulated that the presence of cholinergic innervation in the central retinal artery plays a role in protecting the fragile capillaries of the retina in situations of marked increase of blood pressure. A sudden increase in sympathetic activity, as may occur during stress, causes a marked increase of blood pressure. It is believed that the constriction of the extraocular part of the central retinal artery increases resistance and limits the increase of the intravascular pressure in the fragile capillary bed.9 The role of parasympathetic innervation of the choroid is less known, other than that parasympathetic innervation seems to increase choroidal blood flow possibly via the vasoactive intestinal peptide (VIP) and nitric oxide (NO).1,46
1.2.4.5 Blood gases
Ambient oxygen (02) and carbon dioxide (C02) are also contributing factors changing the ocular blood flow to the retina, choroid and optic nerve head in humans. In the presence of elevated O2, blood flow decreases in the retinal vessels and macular capillaries causing a reduction of blood velocity and constriction of the vessels,49-53 while elevated CO2 causes an increase of the velocity and dilation of the blood vessels.50,51,54 Pulsatility, velocity, volume and flow of the neuroretinal rim decrease in the presence of O2 and increase in the presence of CO2. 55-57 Finally, 02 has been shown to have very little effect on choroidal pulsatility, while CO2 induces an increase on choroidal pulsatility55,56,58 and flow. 59
1.3 Techniques employed to assess ocular blood flow
Several techniques have been developed to measure ocular blood flow so as to understand the vascular supply of the retina, choroid and optic nerve as well as the underlying mechanisms of impaired ocular blood flow in eye diseases.
1.3.1 In humans
Techniques to assess ocular blood flow in humans are: fluorescein angiogram (FA), indocyanine angiogram (ICG), pulsatile ocular blood flow (POBF), laser interferometry, blue field entoptic simulation, color Doppler imaging (CDI), laser Doppler velocimetry (LDV), retinal vessel analyzer (RVA), laser Doppler flowmetry (LDF), scanning laser Doppler flowmetry (SLDF) and Canon laser Doppler flowmeter (CLBF).
Fluorescein angiography (FA) is a technique consisting of injecting a bolus of 10 mL of
5% fluorescein sodium into one of the patient's cubital veins.60-62 The sodium
fluorescein has a peak of absorption at 490 nm and emission at 530 nm. Blue and yellow-green filters are positioned along the optical axis of a single-Iens reflex camera for viewing and documenting the fundus fluorescence. As the fluorescein dye reaches the retinal and choroidal circulation, it is photographed at several time intervals while the circulation of the fluorescein dye progresses in time. The fluorescein angiogram is a technique which qualitatively assesses blood flow in the retina and optic nerve head and localizes the regions of ischemia and leakage.
The indocyanine green angiography (ICGA) consists of injecting indocyanine dye using
choroidal circulation. The indocyanine dye has several advantages over the sodium fluorescein dye. Its fluorescence is near-infrared spectrum. Unlike sodium fluorescein, which absorbs and emits light in the visible portion of the spectrum, indocyanine dye has
a peak absorption (805 nm) and fluorescence (835 nm) in the near-infrared range.62
Light at a wavelength in the near-infrared spectrum penetrates deeper in tissue than light
in the visible spectrum.62 Therefore, light at wavelengths in the near-infrared spectrum
penetrates the pigmented layers of the fundus allowing to assess deeper structures of the retina (RPE and Bruch's membrane) and choriocapillaris. Similar to FA, ICG is used for qualitative assessment of the blood flow and localizes the regions of ischemia and leakage.
The pulsatile ocular blood flow (POBF) is the pressure change of the eye in response to the bolus of blood from each heartbeat. Each heart contraction causes a bolus of blood to flow into the ophthalmic artery from the internaI carotid artery (ICA) and then spreads rapidly forward through the retinal vessels and choroidal vascular network. The entry of blood into the eye increases the ocular volume with a proportionate increase of the IOP to reach a maximum IOP, which corresponds to the systolic IOP. Following relaxation of the heart and closure of the aortic valve, the IOP falls gradually to a minimal value, which corresponds to the diastolic IOP. The observed changes in pressure reflect the fact that the eye volume must change in response to accommodate changes in the
intraocular blood volume induced by the arterial pulse. A re1ationship between
pressure/volume has been established by Silver et al. (1989,1994) from living human
eyes.63,64 From this relationship, the volume of blood ente ring the eye can be estimated
pulsatile and non-pulsatile components. In healthy eyes, the pulsatile component is 75%
to 85% of the total flow.65,66 It has been estimated that from the total ocular circulation,
95% is constituted from the choroidal circulation and 5% from the retinal circulation.65.
68 Therefore, POBF is essentially the measurement of blood flow circulating in the
choroid with each heartbeat, and is a reliable parameter for evaluating the status of the
choroidal circulation, and consequently the overall ocular circulation. However, the
POBF technique does not account for the sc1eral rigidity, which has an impact on how
rigid or elasticthe eye is and affects its mechanical property to pulsate from each bolus
of blood. Sc1eral rigidity' extremes might not reflect the "true" representation of the
volume of bolus of blood. As explained before, POBF is used to mainly assess the
overall choroidal circulation. Therefore, it does not provide any information on the
retinal and optic nerve head circulation and it does not give information on particular
regions of the retina, optic nerve or choroid.
Laser interferometry is another technique that has the capability of measuring the
pulsatility of the ocular blood flow by measuring fundus pulsation of the eye. It uses an
infrared single-mode laser diode (780 nm) integrated to a fundus camera.69,70 The
fundus camera permits the visualization and control of the region of the fun dus to be
investigated, i.e. the retina, the choroid or the optic nerve head. The principle of this
technique is that it measures the distance changes between the fundus and the cornea,
called the fundus pulsation. The laser beam is reflected at the front side of the cornea
and at the retina. Distance variations between the cornea and the retina lead to a
resulting from the two reflected beams.71 The advantage of this technique compared to the pulsatile ocular blood flow system is that no contact is required with the comea and no topical anaesthesia is needed. The instrument allows the operator to locally measure the pulsatility at a discrete region of the fundus, either at the retina, the macula, or the neuroretinal rimlcup. However, as for the pulsatile ocular blood flow, it does not account for scleral rigidity, and a relatively clear media is necessary for performing this test.
The blue field simulation technique consists of illuminating the eye fundus with an
intense blue light from a narrow optical spectrum centered at a wavelength of 430 nm.72
Under this condition, bright corpuscles can be seen "flying" in an are a of 10 to 15° of arc radius centered at the fovea. These corpuscles correspond to the white blood cells (leukocytes) circulating in the macular capillaries. The leukocytes do not absorb short wavelength as the red blood cells do, therefore they are perceived as shadows on the background of the continuous blood stream. Because the fovea is avascu1ar, the entoptic phenomenon is absent. There are two physical properties drawn from the blue field perception of the leukocytes in the blood stream: one is the velocity and the other is the density. Therefore, based on these two properties, the blue field perception of the
leukocytes is a close index of the blood velocity, volume and flow.73 During the blue
field entoptic simulation, one of the subject' s eyes is stimulated by the intense blue light at a wavelength of 430 nm, while the subject is asked to observe a CRT screen with the other eye, which is also illuminated with a blue light but at a wavelength of 450 nm to prevent the perception of the entoptic phenomenon. The CR T screen displays computer simulated leukocytes and the subject adjusts the velocity pulsatility, me an velocity and
number of the simulated leukocytes with control buttons in order to match with his own leukocyte motion in the stimulated eye. This is a very subjective technique used to measure retinal blood flow and cannot be used in the presence of opaque media.
The optical property of laser light and the property of ultrasound to shift at a frequency (Doppler shift) corresponding to a specific velocity of a moving particle, for instance the blood cells, have led to a series of new techniques for assessing blood flow in various vascular structures, including the ones from the eye. Color Doppler ultrasound imaging, laser Doppler velocimetry, retinal vessel analyzer, laser Doppler flowmetry, confocal scanning laser Doppler flowmetry techniques and Canon laser Blood Flowmeter have been developed to study the vascular and microvascular (capillary) beds of the retina, choroid and optic nerve head.
The color Doppler ultrasound imaging (CDI) is the only non-invasive system that
records the blood circulation from the retrobulbar vessels. It uses ultrasound
scanners/transducers (5-10 MHz) which are applied with contact jelly through the closed
upper eyelid.74 Blood flow in the retrobulbar vessels is detected by the production of
colour pixels (representing Doppler frequency shifts) on a visual display unit. Pulsed Doppler ultrasound is thereby aimed at the vessel of interest (ophthalmic artery, central retina artery and vein, posterior ciliary artery), and spectral analysis of the resultant Doppler frequency shift is used to obtain a velocity waveform. Peak systolic (PSV) and end diastolic velocities (EDV) are obtained from the signal and are used to calculate two indexes, i.e the resistivity (Rl=(PSV -EDV)/PSV) and pulsatility (PI=(PSV -EDV)/Tmax)
indexes. These two indexes provide a measure of peripheral resistance to flow. The resistance index ranging from 0 to 1, where 0 represents no resistance and 1 represents high resistance, is also called the Pourcelot's index. High velocity readings provide
better reproducibility than low velocity readings. It has been shown that the coefficient
of variation with either the Acuson 128 System or the Siemens Q2000 System varies from 4.0% to 4.8% for the ophthalmic artery, 6.4% to 11.0% for the central retinal
artery, and 10.0% to 38.0% for the posterior ciliary artery.74 Therefore the cor
technique is not a reliable technique for measuring the posterior ciliary arteries. CDr has a limited resolution range for detecting velocity as low as 1-3 cm/s. The angle of incidence between the scanner/transducer and the measured vessel is normally very low as most of the vessels have an antero-posterior orientation. However, in situations where the blood vessels present a tortuosity, the measurement is unreliable.
Laser Doppler velocimetry (LDV) permits the measurement of red blood cell velocity in retinal vessels. A helium-neon laser beam (632 nm) incorporated to a fundus camera is
focused on a retinal vessel (50 to 150 um diameter) and illuminates the entire lumen
over a short vessel segment. 75 This vessel segment contains many RBCs moving at different velocities aIl in one direction. The scattered laser light is detected by a detector (optical fiber) located in the retinal image plane of a fundus camera. Two components of this light, one originating from the moving RBCs, the other from the vessel wall, are optically mixed by a photomultiplier tube (PMT). The resultant photocurrent contains a
whole spectrum of different frequencies (~fs) corresponding to the spectrum of different
the number of RBCs moving at the corresponding velocity. A good analogy is that the
power spectrum of the photocurrent represents several histograms of RBC velocities.
From Poiseuille's mathematical model of the flow, the distribution of the RBC velocities
within the vessels is a parabolic function of the radial distance from the vessel axis with
an equal number of RBCs flowing at each velocity from V=O to V=Vmax. Vmax is the
maximum (centre line) velocity of the RBCs.72 In order to increase the accuracy and
reproducibility of Vmax at the centre line of the blood vessel and to obtain an absolute
measurement ofVmax, a bi-directionallaser has been developed.76 In the bi-directional
technique, one incident beam is used to illumina te a site along a retinal vessel. The light
scattered by the blood cells at the illuminated site is detected simultaneously in two
distinct directions separated by a known fixed angle. Two Doppler shift frequency
spectra are measured, each with a particular value of ~f max. The difference of the two
values is used to ca1culate the Vmax in units of speed, i.e. cm/s. By determining the
vessel diameter from photograph or laser measurement (CLBF technique described
later), the retinal blood flow can be ca1culated. LDV requires relatively clear media and
good fixation from patients.
The retinal vessel analyzer (RVA) is a fundus camera (FF450, Zeiss Jena, Germany). It
allows on line measurement of the diameterof a retinal vessel of interest. The diameter
measurement is obtained with a charged-coupled device (CCD) camera mounted in the
fundus camera. The CCD camera measures diameters of ~90 ' . .un 77 on a vessel segment which can be up to 1 mm maximum length. The CCD camera and analysis software
blood cells. Temporal resolution is 40 ms and the diameter resolution is 1 !lm. One interesting feature of the RV A system is that it permits the recording of the video signal of the eye fundus (30°) for :::;10 minutes using an SVHS recorder. This feature gives the opportunity to recall data and to analyse different vessels after data acquisition. Since the RV A only gives information on retinal vessel diameter, it does not provide quantitative data ofblood flow of the vessel investigated.
Laser Doppler flowmetry (LDF) is a technique that measures the relative velocity,
number and flow of red blood cells in the vascular network embedded in tissue. It is
used for measuring blood flow in a discrete area of the choroid, the optic nerve superficiallayer or retina, where blood vessels are absent. The laser wavelength chosen for the site of measurement determines how deep the measurement is done in the tissue. The longer the laser wavelength is, the deeper is the tissue sampled. The principle of LDF is that the incident laser beam illuminates a small region i.e. the retina, choroid or the optic nerve head free of surface vessels. As the light penetrates the tissue, it is randomly scattered both by nonvascular tissue elements and by blood cells circulating through the capillaries embedded in the tissue. In this situation, each blood cell receives light from a multiplicity of directions. Moreover, the Doppler shifted light scattered by each cell is again randomly scattered by the surrounding nonvascular tissue prior to detection. The power spectrum depends not only on the blood cell speed as for retinal vessels, but also on the light scattering property of the tissue. The Doppler shift power spectrum is recorded via a photodetector placed near the site of illumination of the incident laser. The shape of the power spectrum is logarithmic. The logarithmic fit of
the power spectrum where it meets the baseline is proportional to the velocity of the red
blood cells. Bonner and Nossa178 developed the mathematical model of the broadened
Doppler shift spectrum to quantify the total number of blood cells moving in the
illuminated tissue volume (X), and to quantify the flux or flow rate of the moving cells
(w). The mean blood cell speed is th en related to the quotient w/x. In the Occulix
system, which is an LDF system, the volume sample corresponds to the area of the laser beam reaching the tissue. The Occulix records in real time, which allows applying stress
tests such as the cold provocative test, breathing of different CO2/02 mixtures and light
stimulation. However, the output measurements of velocity and flow are in arbitrary units (AU) and therefore it does not allow comparing inter-session measurements. Like the LDV, the Occulix requires relatively clear media and good fixation from patients. The choice of laser wavelength used will determine the depth of the blood flow sampling. The LDF is a single point laser and does not allow the measurment of blood flow in different regions simultaneously.
Scanning laser Doppler flowmetry is the combination of laser Doppler flowmetry (described above) and a scanning laser device. This system has been developed by
Heidelberg Engineering.79 The principle of this system is that the direction of the laser
beam (780 nm) entering the eye is periodically changed in two orthogonal directions by means of two oscillating mirrors, so that a two dimensional region is scanned line by
line. The scanned field is 100
wide by 2.50
(2.88 mm x 0.72 mm). During the scan along one line, the reflected light intensity at 256 equidistant locations (pixels) is
th en the next line goes through the same process up to a total of 64 lines. The total
acquisition time is 2.05 seconds. A discrete fast Fourier over the 128 intensity values for
each pixel is performed for generating the power spectrum of the Doppler shift. An
automatic full-field perfusion image analysis software (AFFPIA, v3.3),80,8\ is used to
determine perfusion analysis of the pixels of the entire image and to obtain the overall
volume, velocity and flow. It improves data quality by removing over-exposed pixels
and saccades, vessels greater than 30 /lm and allows the analysis of large regions of
tissue such as the neuroretinal rim. When the acquired image con tains the neuroretinal
rim area surrounded by the peripapillary retina, inner and outer circles can be drawn by
the operator to delimit the neuroretinal rim.
The depth of penetration of the SLDF measurement has been estimated to be 300 to 400
/lm.82 This estimate has been obtained from a monkey model where the central or
posterior ciliary arteries were ligatured. Following the occlusion of the central retinal
artery, which provides the blood supply to the retinal nerve fiber layer (300 to 400 um
thickness), a 51 % decrease of the blood flow measured with the SLDF was observed.
Following the occlusion of the posterior ciliary arteries, which supply the laminar and
retrolaminar region of the ONH, no change in the blood flow was observed.
In nonnal subjects, SLDF intra-session coefficient of variations for the mean of 5
images of same centration, brightness, and absence of movement, ranges from II.4% to
16.4%, and the coefficient ofreliability ranges from 0.93 to 0.95. Regarding the
,(
reliability ranges from 0.80 to 0.87 respectively.83 Since it is necessary to obtain at least
three good images without blinking and eye drifting, the SLDF system is not a simple
test for patients and requires very good cooperation and fixation. Like any other laser
Doppler technique, it is necessary to have a relatively c1ear media.
In order to de termine accurate1y the blood flow from a retinal vessel at a giventime, it is
necessary to record simultaneously the velocity of the centre line blood colurnn of the
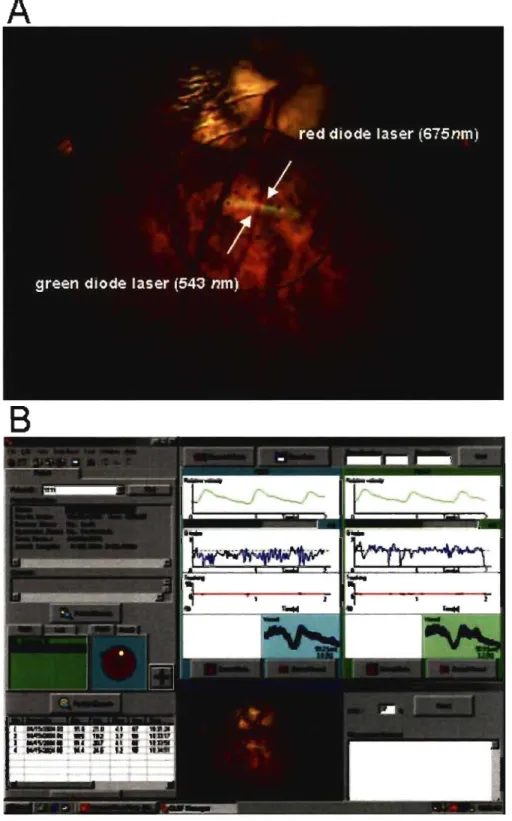
vessel and its corresponding width (diameter). The Canon Laser Blood Flowmeter
(CLBF) has been developed to achieve this. It uses a bi-directional red diode laser (675
nm, 80 ~m x 50 ~m oval) that measures the centre line blood colurnn velocity, and a
green diode laser (543 nm, 1500 ~m x 150 ~m) that measures the blood vessel diameter
and also serves as a vessel trac king system. These two lasers are mounted in a fundus
camera. Refer to the section above describing the principle of the bi-directional laser
system. The vessel tracking system corrects for small eye movements. It allows a
graph of eye position to be superposed oyer the velocity time curve to aid in artefact
rejection. Two sequent bi-directional readings (i;e. path 1 and path 2) are takenand
averaged to give one reading. Multiple diameter readings are simultaneously acquired
during the first and final 60 ms of the 2-second velocity measurement window. The
CLBF software calculates the blood flow of the vessel of interest once the mean vessel
diameter and centre blood velocity are obtained from two paths (2 measurements), using
the following fonnula:
where Velocitymcan is the time averaged centre line blood velocity (mm/s) during the
cardiac cycle and nDiameter2/8 is the cross-sectional area of the measurement site (J.!m2).
The CLBF software takes into consideration the axial length. The CLBF accuracy relies on the possibility of rejecting or accepting the reading of the path based on visual inspection of the signal in terms of its stability. From our lab experience, we have obtained a coefficient of variation of3.2 +/- 1.9% for the diameter, 6.7 +/- 3.2% for the
velocity, and 7.1 4.4% for the flow following a standard protocol (paper in
preparation). AIso, the system keeps in memory the location of the measurement site for follow-up investigations. The CLBF system is user friendly for both technician and
patient, but it has minor limitations. lt does not allow for measures of an artery if too
close to a vein as the laser beams are dragged away from the arterial measurement site by the vein signal. To be performed on patients, CLBF requires a good dilation of at least 7 mm of diameter as the iris blocks the incident laser coming superiorly. Therefore, droopy eyelids or long eyelashes cause problems as the laser signal is blocked. In the presence of lens opacities, the power of the laser can be increased to the next level from 200 to 300 J.! W for the velocity measurement laser, and from 4 to 6 Il W for the trac king and diameter measurement laser.
1.3.2 In animaIs
An the techniques mentioned in the previous section can be performed on monkeys or other large animaIs under anaesthesia, which can alter basal hemodynamics and normal physiologie levels. For smaller animaIs such as rodent s, laser Doppler techniques have
, , been adapted to the confined working area present in the eye, but they still present sorne
limitations.
The laser Doppler flowmetry technique usmg an intraocular probe can be used to
measure retinal blood flow in rodents.84-86 However, this technique is invasive as it
requires one to position the probe near the retinal surface while the IOP has to remain
constant. AIso, it has to be performed under anaesthesia, which can alter basal
hemodynamics and normal physiologic levels. The scanning Laser Doppler Flowmetry (SLDF) (HRF, Heidelberg Engineering, Germany, vl.02) technique can be used in small rodents, but again it must be used in animaIs under anaesthesia. Moreover, comeal dryness under anaesthesia is a limiting factor. Finally, the SLDF cannot be applied in small rodents for capillary blood flow measurements as it does not have the ability to
visualize the capillary layers and it detects blood flow signal from the choroid.87
The microsphere technique consists of injecting radioactive microspheres (MS) of a known dosage and size into the left ventricle. MS have been used to measure the retina,
optic nerve head and choroidal blood flow.88,89 As the MS circulate in the blood stream,
they become entrapped within the vascular bed in proportion to its regional blood flow. The regional blood flow is determined by calculating the ratio of total MS in the tissue in reference to the arterial contamination obtained from blood samples collected during MS injection. The MS technique presents sorne limitations, which can ov or und
er-estimate blood flow.90-92 A too high or too low dose may lead to over or under MS
large vessels. Axial streaming of the MS is also another limiting factor. In the retina, optic nerve and choroid of rats, 8 !lm and lO !lm MS are optimal sizes to estimate blood flow in the retina/optic nerve head and choroid respectively.89 However, since MS are entrapped with the microvascular space and not in the tissue, measurement of the blood flow of the tissue is missed.
Diffusible blood flow tracers su ch as [14C]-iodoantipyrine,93 [14C ]diazepam,94 or
n-[14C]butanol,95 have been developed to measure regional blood flow in a tissue of interest. The use of a diffusible tracer avoids inaccuracies of the retinal blood flow measurement due to axial streaming, plugging or permeability changes as reported with the classical microsphere technique.89,92 However, post-mortem intraparenchymal diffusion occurs, which results in weakening the local tracer spatial gradients as observed in the brain,96 retina, optic nerve and choroid.92,97-IOO The [14C]_ iodoamphetamine ([14C]_IMP) is a blood flow tracer, which has been developed and proven to be ideal in measuring blood flow several reasons. First, the [14C]-IMP binds to the amine siteslOI,I02 and has a very high extraction at the first pass through the microvasculature, which aUows a non-restrictive diffusion from blood to tissue despite the blood-retinal barrier. Second, [14C]_IMP has a very low clearance rate and low post-mortem diffusion,lo3 due to its high affinity for cerebral tissue. Third, [14C]-IMP is chemicaUy and biologicaUy inert for the duration of the measurement period.I03 These properties have aUowed the IMP to be successfuUy used for measuring cerebral blood flow in smaU animal research,96,I03,I04 and in humans using Single Photon Emission