Université de Montréal
The relationship between retinal nerve fiber layer, visual
function and vision-specific quality of life in multiple
sclerosis
par Vanessa Bachir École d’Optométrie
Thèse présentée
en vue de l’obtention du grade de Maitrise en Sciences de la vision
Option Sciences fondamentales
Mars, 2019
Résumé
La sclérose en plaques est une maladie dégénérative qui peut affecter la vision ainsi que différentes structures du système visuel afférent. La partie de l'oeil plus souvent affectée par la sclérose en plaques est le nerf optique, sous forme de névrite optique. Une technologie, nommée TCO (tomographie par cohérence optique), permet de prendre une image du nerf optique et de ses fibres nerveuses qui s'étendent sur la rétine. Dans cette thèse, la TCO a permis d’obtenir une épaisseur des fibres nerveuses autour du nerf optique, ainsi qu’une épaisseur totale de la macula et de la couche de cellules ganglionnaires chez les patients atteints de sclérose en plaques, avec et sans histoire de nérite optique, et chez un groupe de patients contrôle. Les résultats démontrent que seule l’épaisseur de la couche de cellules ganglionnaires permet de différentier les patients avec sclérose en plaques sans histoire de névrite optique des patients contrôle. Une deuxième étude a évalué la qualité visuelle en mesurant la sensibilité aux contrastes ainsi que la qualité de vie reliée à la vision avec un questionnaire de qualité de vie. Les résultats démontrent qu’une nouvelle charte de sensibilité aux contrastes, plus facile à administrer en clinique, permet aussi de différentier les patients sans névrite optique du groupe contrôle. De plus, la qualité de vie des patients ayant eu un épisode de névrite optique semble significativement affectée, même si le pronostic est considéré très favorable et que l’acuité visuelle est « bonne » suite à une névrite optique. En conclusion, l’utilisation de l’OCT en plus de mesures sensibles de fonction visuelle, telle la sensibilité aux contrastes, et de qualité de vié peuvent contribuer à mieux détecter des
dysfonctions oculo-visuelles subtiles, mais importantes chez les patients atteints de sclérose en plaque.
Mots-clés : sclérose en plaques, TCO (tomographie par cohérence optique), fibres nerveuses rétiniennes, cellules ganglionnaires rétiniennes, névrite optique, imagerie rétinienne
Abstract
Multiple sclerosis (MS) is the most common neurological condition causing disability in working-age adults. The hallmark of MS related disability is axonal loss (Petzold et al., 2010). Through new technologies, such as optical coherence tomography (OCT), the retinal nerve fibre layer (RNFL), composed of ganglion cell axons, can be visualized and studied non-invasively in cross-section. Furthermore, recent OCT advances allow precise retinal layer segmentation and macular imaging of the ganglion cell layer. In this thesis, these different OCT parameters were measured to see which layers would be most affected in MS patients without previous optic neuritis. Results show that macular ganglion cell layer thickness is the only OCT parameter that can differentiate this sub-group of patients from healthy controls. Visual function was then assessed using a newly available, easy to use contrast sensitivity chart that can be self-administered by patients. Results show that this chart is also capable of differentiating MS patients without optic neuritis from controls, but usually gives better contrast sensitivity scores than the Mars chart. Lastly, vision-specific quality of life was assessed and proved to be reduced in MS patients with prior optic neuritis, despite supposed favorable recovery and good visual acuity in patients with this diagnosis. In sum, the use of OCT imaging, as well as sensitive visual function and quality of life measures, could help detect subtle, yet important structural or functional visual changes in patients with MS. This could ultimately help better screen, manage and counsel this subset of patients.
Keywords : multiple sclerosis, OCT (optical coherence tomography), retinal nerve fiber layer, retinal ganglion cell layer, optic neuritis, retinal imaging, vision-related quality of life
Table des matières
Résumé ... 3
Abstract ... 5
Table des matières ... 6
Liste des tableaux... 9
Liste des figures ... 12
Liste des sigles ... 13
Liste des abréviations ... 14
Introduction ... 15
Epidemiology of MS ... 15
Pathophysiology of MS ... 15
Optic neuritis (ON) ... 16
Visual Loss in MS ... 18
With history of optic neuritis ... 18
Without history of optic neuritis ... 19
Visual acuity and contrast function in MS ... 20
High contrast visual acuity ... 20
Contrast sensitivity ... 20
The Mars chart ... 22
Camblobs2 Chart ... 23
Quality of Life (QoL) and Vision-Related QoL in MS ... 24
NEI-VFQ 25 Questionnaire ... 25 OCT imaging in MS ... 26 Anatomy overview ... 26 OCT technology ... 28 Spectralis OCT ... 29 OCT imaging in MS ... 29 Objectives ... 31
Article 1: Macular and optic nerve head analysis in multiple sclerosis (MS) using spectral-domain optical coherence tomography (SD-OCT). ... 32
Introduction ... 32 Methods ... 33 Participants ... 34 Materials ... 35 OCT ... 35 Protocol ... 38 Results ... 38 1. RNFL ... 38
Multiple Sclerosis without history of Optic Neuritis Group (MSNON) vs. Controls... 39
Multiple Sclerosis with history of Optic Neuritis (MSON) vs. Controls ... 40
MSON vs. MSNON ... 40
2. Macular thickness ... 40
Multiple Sclerosis without history of Optic Neuritis Group (MSNON) vs. Controls... 41
Multiple Sclerosis with history of Optic Neuritis (MSON) vs. Controls ... 41
MSON vs. MSNON ... 42
3. Ganglion cell thickness ... 42
Multiple Sclerosis without history of Optic Neuritis Group (MSNON) vs. Controls... 43
Multiple Sclerosis with history of Optic Neuritis (MSON) vs. Controls ... 43
Discussion ... 45
Conclusion ... 48
Article 2: Visual function and vision-related quality of life in multiple sclerosis. ... 49
Introduction ... 49
Material and methods ... 51
Participants ... 51 Inclusion criteria ... 51 Exclusion criteria ... 52 Study Protocol ... 52 NEI-VFQ-25 Questionnaire... 52 Contrast sensitivity ... 53 Statistical Analyses ... 55 Results ... 56
Contrast Sensitivity ... 56
Overall results ... 56
Mars Chart ... 56
CamBlobs2 Chart ... 57
Correlation and comparison between Mars and Camblobs2 Charts ... 57
Vision-related Quality of Life (NEI-VFQ-25 Questionnaire) ... 58
Composite score ... 58
Subscale scores... 58
Driving ... 60
Other subscale scores ... 60
Discussion ... 60
Conclusion ... 64
Overall Conclusion ... 66
Annex : Statistical Source Tables ... 67
Contrast sensitivity ... 67
Vision-specific quality of life (NEI-VFQ-25) ... 71
Liste des tableaux
Table 1. Main causes of immune-mediated optic neuritis (Toosy et al., 2014) ... 17
Table 2. Descriptive Statistics for Global RNFL across groups... 38
Table 3. Descriptive Statistics for Total Macular Thickness across groups ... 40
Table 4. Post hoc analyses (Bonferroni) for Total Macular Thickness (global) across participant groups ... 41
Table 5.Descriptive Statistics for Ganglion Cell Layer Thickness across groups... 42
Table 6. Post hoc analyses (Bonferroni) for Global Ganglion Cell Layer Thickness across participant groups ... 43
Table 7. Post hoc analyses (Bonferroni) for OCT parameters across participant groups ... 44
Table 8. Descriptive Statistics for Contrast Sensitivity Results ... 56
Table 9. Descriptive Statistics for NEI-VFQ-25 Questionnaire Composite Score ... 58
Table 10. ANOVA Results (Welch) for Mars Contrast Sensitivity ... 67
Table 11. ANOVA Results (Welch) for Mars Contrast Sensitivity ... 67
Table 12. Post hoc analyses (Games-Howell) for Mars Contrast Sensitivity across participant groups ... 68
Table 13. Results of Welch’s ANOVA for CamBlobs2 Contrast Sensitivity ... 68
Table 14. Post hoc analyses (Games-Howell) for CamBlobs2 Contrast Sensitivity across participant groups ... 69
Table 15. Paired t-test between Mars and Camblobs2 CS Scores in Control Group ... 69
Table 16. Paired t-test between Mars and Camblobs2 CS Scores in MSON Group ... 69
Table 17. Paired t-test between Mars and Camblobs2 CS Scores in MSNON Group ... 70
Table 18. Pearson's Correlation for Camblobs2 and Mars CS in control group ... 70
Table 19. Pearson's Correlation for Camblobs2 and Mars CS in MSON group ... 70
Table 20. Pearson's Correlation for Camblobs2 and Mars CS in MSNON group ... 70
Table 21. Pearson's Correlation for Camblobs2 and Mars CS in MSON and MSNON groups combined ... 71
Table 22. Pearson's Correlation for Camblobs2 and Mars CS in all groups combined ... 71
Table 24. Post hoc analyses (Bonferroni) for NEI-VFQ 25 Composite Score across participant
groups ... 72
Table 25. ANOVA Results (Standard) for NEI-VFQ 25 General Vision Subscale Score ... 72
Table 26. Post hoc analyses (Bonferroni) for NEI-VFQ 25 General Vision Score across participant groups ... 72
Table 27. Descriptive Statistics for General Vision Subscale Score ... 73
Table 28. Anova Results (Welch) for NEI-VFQ-25 Ocular Pain Subscale Score ... 73
Table 29. Post hoc analyses (Games-Howell) for Ocular Pain Subscale Score across participant groups ... 74
Table 30. Descriptive Statistics for Ocular Pain Subscale Score ... 74
Table 31. Anova Results (Welch) for NEI-VFQ-25 Near Activities Subscale Score ... 74
Table 32. Post hoc analyses (Games-Howell) for Near Activities Score across participant groups ... 75
Table 33. Descriptive Statistics for Near Activities Subscale Score ... 75
Table 34. Anova Results (Welch) for NEI-VFQ-25 Distance Activities Subscale Score ... 76
Table 35. Post hoc analyses (Games-Howell) for Distance Activities Score across participant groups ... 76
Table 36. Descriptive Statistics for Distance Activities Subscale Score ... 76
Table 37. Anova Results (Welch) for NEI-VFQ-25 Social Functioning Subscale Score ... 77
Table 38. ANOVA Results (Standard) for NEI-VFQ 25 Mental Health Subscale Score ... 77
Table 39. Descriptive Statistics for Mental Health Subscale Score ... 77
Table 40. Anova Results (Welch) for NEI-VFQ-25 Role Difficulties Subscale Score ... 78
Table 41. Descriptive Statistics for Role Difficulties Subscale Score ... 78
Table 42. ANOVA Results (Standard) for NEI-VFQ 25 Vision-specific Dependency Subscale Score... 79
Table 43. Descriptive Statistics for Vision-specific Dependency Subscale Score ... 79
Table 44. ANOVA Results (Standard) for NEI-VFQ 25 Driving Subscale Score ... 79
Table 45. Post hoc analyses (Bonferroni) for Driving Score across participant groups ... 80
Table 46. Descriptive Statistics for Driving Subscale Score... 80
Table 47. ANOVA Results (Standard) for NEI-VFQ 25 Color Vision Subscale Score ... 80
Table 49. ANOVA Results (Welch) for NEI-VFQ 25 Peripheral Vision Subscale Score ... 81 Table 50. Descriptive Statistics for Peripheral Vision Subscale Score ... 82
Liste des figures
Figure 1. MARS Chart ... 22
Figure 2. Camblobs2 / SpotChecks CS Test ... 24
Figure 3. Retinal layers and their cell composition (Britze, Pihl-Jensen, and Frederiksen 2017) ... 28
Figure 4. Example of RNFL acquisition on Spectralis OCT ... 36
Figure 5. Example of GCL layer acquisition on Spectralis OCT ... 37
Figure 6. Post hoc analyses (Bonferroni) for Global RNFL thickness across participant groups ... 39
Figure 7. Mean GCL thickness with SE and significance levels across groups... 44
Figure 8. MARS Chart ... 53
Liste des sigles
CNS: Central nervous system GCL: Ganglion cell layer IPL: Inner plexiform layer MS: Multiple SclerosisOCT: Optical coherence tomography ONTT : Optic neuritis treatment trial PMB: Papillomacular bundle
RNFL: Retinal nerve fiber layer
Liste des abréviations
CS: Contrast sensitivityQoL: Quality of life SD: Spectral Domain TD: Time domain
Introduction
Epidemiology of MS
Multiple sclerosis (MS) is the most common neurological condition causing disability in working age adults (Frohman, Frohman, Zee, McColl, & Galetta, 2005) In 2013, the worldwide estimate for MS was 2.3 million people (Browne et al., 2014). In Canada, the prevalence of MS has been estimated to be as high as 240 per 100 000, with significant inter-province variability (Beck et al. 2005). This statistic places Canada as one of the countries with the highest prevalence of MS in the world. The geographic
distribution of MS is thought to be in part due to a combination of genetic and
environmental factors (Ramagopalan, Dobson, Meier, & Giovannoni, 2010). Although genetic predisposition seems to be an important component, environmental factors, such as viruses, hormones, vitamin D deficiency, ultra violet B deficiency, diet and smoking, may be needed as cofactors in order to trigger the onset of MS (Coo & Aronson, 2004).
Pathophysiology of MS
Although much remains to be understood regarding the pathogenesis of MS, it is believed to be an immune-mediated disease that attacks myelin throughout the central nervous system (CNS) (Korn, 2008). Once the myelin sheath that surrounds nerve fibers is damaged or scarred (sclerosis), nerve impulses cannot be properly transmitted throughout the CNS, which can result in a variety of symptoms.
Within the visual system, MS can damage the afferent neural pathway, which transmits information from the eye to many different brain areas, leading to changes in
both anatomical structure and visual function (Frohman et al., 2005). MS can also affect the efferent visual pathway, which will not be discussed in this thesis.
Optic neuritis (ON)
One of the most common forms of MS-induced damage to the afferent visual system is optic neuritis (S. L. Graham & Klistorner, 2017). Acute demyelinating optic neuritis is an inflammation of the optic nerve which can be an early predictor of MS and is the presenting sign in 25% of cases (Toosy, Mason, & Miller, 2014). Patients with MS have a 70% chance of having an episode of optic neuritis during the course of their disease, usually in the relapsing-remitting phase (Toosy et al., 2014).
Clinically, optic neuritis presents as an acute decrease in vision, pain on eye movements, decreased color vision, and a relative afferent pupillary defect in the affected eye (Frohman et al., 2005). The diagnosis of ON is generally made clinically. In two thirds of cases, optic nerve inflammation is retro-bulbar and the fundus appears absolutely normal in the acute phase. However, optic atrophy, seen as pallor of the optic nerve head, typically ensues in the following weeks as a result of retrograde axonal degeneration. Generally, pallor will develop preferentially on the temporal aspic of the optic disc, as a result of geographic distribution of the macular retinal nerve fibers (Miller, Walsh, & Hoyt, 2005). These fibers insert into the temporal part of the optic nerve head and are thought to be more sensitive to injury by neurological or demyelinating processes.
ON is most commonly associated with MS (MSON), but maybe also be caused by less frequent inflammatory or demyelinating diseases, as listed in Table 1. Based on the Optic Neuritis Treatment Trial (ONTT), the cumulative risk of developing MS after an acute
episode of ON is 50% at 15 years (Optic Neuritis Study Group, 2008b). The present study will only look at optic neuritis patients that have a confirmed diagnosis of MS (MSON), which corresponds to the red box in Table 1.
Table 1. Main causes of immune-mediated optic neuritis (Toosy et al., 2014) Features
No systemic disease
Multiple sclerosis-associated optic neuritis Typical symptoms of optic neuritis, usually disseminated white-matter brain lesions suggestive of demyelination, CSF-positive oligoclonal bands (unmatched); if first episode can be called demyelinating clinically isolated syndrome
Solitary isolated optic neuritis Diagnosed after extended follow-up; normal brain MRI, isolated optic neuritis
Neuromyelitis optica-associated optic neuritis
Positive antibodies to aquaporin 4 or
myelin-oligodendrocytes, longitudinally extensive cord lesion (myelitis), CSF pleocytosis, negative oligoclonal bands, normal MRI brain or abnormalities atypical for MS (hypothalamus, third ventricle, medulla)
Chronic relapsing inflammatory optic neuropathy
Tendency to relapse when off steroids, normal MRI brain, optic nerve sheath enhancement, might become bilateral, needs chronic immunosuppression
Recurrent isolated optic neuritis Diagnosed after extended follow-up; normal brain MRI, no other neurological sequelae
Visual Loss in MS
With history of optic neuritis
Visual loss is one of the most common and disabling clinical manifestations of MS and is often caused or worsened by episodes of acute demyelinating ON (Sakai et al., 2011). Generally, long term visual outcome is favorable for patients who develop ON (Optic Neuritis Study Group, 2008a). In the ONTT, 72% of patients with prior ON had a visual acuity of 20/20 or better at 15 years. Interestingly, the same study also reported that a significant number of patients perceive their long-term visual function to remain poorer
Acute disseminated encephalomyelitis Enhancing brain lesions, severe bilateral optic neuritis, more common in children than in adults
Systemic disease
Sarcoid Other signs of intraocular inflammation, optic nerve sheath enhancement, white matter brain lesions, meningeal enhancement, respiratory symptoms, abnormal chest radiograph, CSF pleocytosis, matched oligoclonal bands
Connective tissue disease (eg, lupus) Skin rash, arthritis, alopecia, positive autoantibodies (double-stranded DNA for lupus), raised inflammatory markers
Vasculitis (eg, polyarteritis nodosa, Wegener's granulomatosis)
Ischaemic presentation if pure vasculitic; compressive presentation if sino–nasal disease
than the normal population after an episode of ON.
In fact, persistent residual defects have been reported in up to 34.6% of MS patients in a study including both patients with and without prior optic neuritis (Jasse et al., 2013). These visual disturbances included visual fatigue (59%), blurred vision (59%), diplopia (35%) and visual instability (28%). Objectively, despite typical recovery after ON, some clinical findings are abnormal in a significant percentage of patients (Miller et al., 2005). Defects in contrast sensitivity can be seen in 63 to 100 % of patients, decreased color vision in 33 to 100%, visual field defects in 62 to 100%, decreased stereopsis in 89%, abnormal pupillary reaction in 92% and abnormal visual evoked potentials in 63 to 100%.
Some aspects of visual loss related to ON may therefore be permanent and
symptomatic despite excellent findings on standard visual function testing, such as 20/20 Snellen visual acuity. For eye care practitioners, this can lead to underestimation of a patient’s visual impairment and difficulty educating patients about their visual impairment.
Without history of optic neuritis
A mismatch between clinical signs and symptoms is especially true in patients without obvious prior ON, where MS-related visual loss can be very subtle (Ma et al., 2002). In patients without previously diagnosed acute optic neuritis, long-term visual dysfunction has been reported as part of a more progressive optic neuropathy without acute symptoms (Jasse et al., 2013). Since most standard ocular testing reveals normal results in these patients, the importance of finding reliable, precise and objective markers of visual dysfunction in MS was the premise for this thesis. More specifically, imaging of the posterior pole of the eye (macula and optic nerve head regions) with optical coherence
tomography (OCT) is currently being studied to detect subclinical axonal loss and may help explain patient symptoms. This technology will be discussed in further detail below.
In MS patients without optic neuritis, the disparity between patient symptoms and normal clinical findings can be due to lack of sensitive visual function measurements during routine optometric and ophthalmological examinations. As explained in the following paragraphs, contrast sensitivity plays an important role in detecting subtle neuropathy in these patients.
Visual acuity and contrast function in MS
High contrast visual acuity
Subtle visual dysfunction is often difficult to detect with standard high contrast (Snellen or Early Treatment Diabetic Retinopathy Study (ETDRS)) visual acuity scales, yet Snellen visual acuity remains the gold standard for acuity testing in the vast majority of optometric and ophthalmological examinations.
Visual acuity is usually performed in the highest contrast setting during routine eye exams, i.e. black lettering on a white chart. Interestingly, this is typically the only measure of visual acuity tested during routine ocular examinations. Studies have shown that despite MS progression and worsening severity scores of MS, high contrast letter acuity is
unchanged over time, further confirming its poor correlation to subjective visual
symptoms (Jasse et al., 2013). In light of this, more sensitive visual function testing should be considered, such as contrast sensitivity, in the MS population.
Contrast sensitivity
decreasing contrast on the same chart but using letters of the same size (same spatial frequency). This measure of visual function differs from standard high contrast visual acuity testing in that it is a more realistic measure of a patient’s vision in real world tasks, such as reading a text with poorly contrasted background or driving in suboptimal weather conditions.
The Pelli-Robson (PR) contrast sensitivity chart has been validated as a highly repeatable and specific measure of visual dysfunction in MS (Thayaparan, Crossland, & Rubin, 2007). In a group of MS patients with and without optic neuritis, contrast
sensitivity with Pelli Robson was lower in both groups compared to control participants (Wender, 2007). This study concluded that the Pelli-Robson contrast discrimination test is a more sensitive procedure for detecting visual disturbances than Snellen visual acuity. In another study on MS patients without optic neuritis and without visual symptoms, 77 % of participants had abnormal contrast sensitivity (Sisto et al., 2005). Contrast sensitivity can therefore be used to measure subclinical changes in visual function that could go
undetected with standard high contrast acuity testing.
Contrast sensitivity scores have also been correlated to structural damage in the visual pathway, using optical coherence imaging measurements and more specifically retinal nerve fiber layer thickness in patients with MS. Fisher et al. (2006) found a 4.4 micron decrease in RNFL for each 3 letter decrease in Pelli-Robson contrast sensitivity score. These findings further confirmed a role for visual function measures, such as contrast sensitivity, as an outcome measure for clinical trials in MS. Unfortunately, in a clinical setting, contrast sensitivity is rarely incorporated into eye examinations. This is in
large part because practitioners find it time consuming and most do not own the proper equipment. It is important, especially in diseases such as MS, to find easier, more motivating alternatives to promote CS testing when examining these patients. The Mars chart
The Mars chart is a much more portable option and may be easier to incorporate into routine eye examinations than the Pelli-Robson chart. The Mars chart has shown good agreement with the Pelli-Robson chart in a low vision population and may even be more repeatable than the PR chart (Thayaparan et al., 2007). To our knowledge, there are no studies using Mars contrast sensitivity specifically in an MS population.
The Mars test assesses contrast sensitivity at 50 cm. Forty-eight letters placed on eight lines with an increase of 0.04 log units are used to determine the contrast threshold (Arditi, 2005). The range of contrast tested is 0.04 to 1.92 log units (Thayaparan et al., 2007). Testing ends when the patient misses 2 consecutive letters (Dougherty et al., 2005). Contrast sensitivity is calculated by taking into account the number of letters missed prior to stopping
Figure 1. MARS Chart
the test with a given value of 0.04 log unit for each letter (Haymes et al., 2006). Three different forms exist to control for a learning factor. Since it is smaller than the Pelli-Robson chart, it is easier to illuminate evenly and to carry around (Doughetry et al., 2005). It differs from the Pelli-Robson chart in that contrast decreases with each letter at a progression of 0.04 log CS. The Pelli-Robosn chart uses triplets of letters with the same contrast. Each triplet decreases in contrast by 0.15 log unit from top to bottom of chart. Another important difference between PR and Mars charts is that they test CS at distance and near respectively.
Camblobs2 Chart
The CamBlobs2 is the first single-use, printed CS chart that can be
self-administered by patients to monitor progression at home or in a clinical setting (Robson et al., 2016). These unique characteristics may be useful in motivating eye care providers to test CS in a clinical setting. Camblobs2 has been validated in normal participants and has shown very good reproducibility and agreement with Pelli-Robson CS (Griffin, Cheng, & Robson, 2017). The same study found that it is less dependent on viewing distance and refractive error than grating or letter contrast tests.
Camblobs2 measures contrast sensitivity at a reading distance (Robson et al., 2016). The chart uses 25 lines of 9 mm diameter round patches at varying contrasts. Each line contains 4 patches (“blobs”) of the same contrast at different locations. Participants have to mark the position of the patches with a pen on the chart. Contrast ranges from 0.80 to 2.05 log unit with a step size of 0.05 log unit. Participants can be encouraged to guess the positions of the blobs and are allowed to tilt the chart in order to locate the blobs (Griffin et al. , 2017). A transparent template is used to determine the correct positions of the blobs (Robson et al., 2016). Contrast sensitivity score is determined at the highest log contrast sensitivity value for
which two or less blobs were correctly identified (Robson et al., 2017). Camblobs2 has
recently been renamed SpotChecks and is now available commercially for purchase. This new version has a fifth column of spots, but remains otherwise identical to Camblobs2.
Figure 2. Camblobs2 / SpotChecks CS Test
(https://www.precision-vision.com/product/spotchecks/)
Quality of Life (QoL) and Vision-Related QoL in MS
Visual impairment negatively affects (QoL), as shown in multiple studies (Schinzel et al., 2014; Jasse et al., 2013; Noble et al., 2006). In MS, quality of life indices are
considerably worse than control groups without ocular disease and similar to glaucoma and cataract patient scores (Noble et al., 2006).
NEI-VFQ 25 Questionnaire
The NEI-VFQ-25 (Annex I) questionnaire is commonly used to measure of vision-related quality of life in MS patients. This 25-item questionnaire has been validated in different chronic ocular diseases (C M Mangione et al., 1998).
In MS, the NEI-FQ-25 questionnaire has been shown to be a sensitive and useful tool in assessing visual function (Noble et al., 2006). Furthermore, vision-related quality of life scores have been shown to be negatively affected by MS (Jasse et al., 2013). Reduced VFQ-25 scores have been correlated to objective clinical findings such as a decrease in acuity, contrast sensitivity, color vision, and/or visual field changes (Noble et al., 2006).
Optical coherence tomography findings have also been studied in relation to QoL in MS. Walter et al. (2012) found that ganglion cell layer and inner plexiform layer
thicknesses were the most significantly correlated OCT finding with both visual function and vision-specific QOL in MS patients. These findings were significant for both patients with and without history of optic neuritis. Despite “favorable” recovery after optic neuritis in most patients, Sabadia et al. (2016) found that patients defined as good visual recovery are still left with clinically meaningful reductions in vision-specific QoL. Furthermore, these deficits reflected underlying degrees or axonal and neuronal loss on OCT even in patients with maximal high contrast visual acuity recovery.
Patients with a history of ON and "good" visual recovery, defined in the literature as 20/40 or better HCVA, are left with clinically meaningful reductions in vision-specific QOL. Such patient-observed deficits reflect the underlying significant degrees of retinal axonal and neuronal loss and visual dysfunction that are now known to characterize ON even in the
setting of maximal HCVA recovery. There remains an unmet therapeutic need for patients with ON.
Interestingly, vision-related QoL appears to be affected as of the early stages of multiple sclerosis. A study by Noble et al. showed significantly decreased scores on NEI-VFQ-25, but failed to show a correlation between QoL scores and EDSS (Expanded Disability Status Scores). The EDSS is the gold standard for measuring MS severity in a clinical setting and is often used by neurologists (Noble et al., 2006). The lack of
correlation between QoL and EDSS is important to help understand why patients with varying degrees of MS severity can report debilitating impairment in daily activities related to problems with visual function, even in early disease. Authors suggested that the presence of MS, and not the severity of disease, is related to visual dysfunction and impaired QoL.
NEI-VFQ-25 scores can therefore serve as a standardized measure to help explain self-reported visual dysfunction in MS patients, even in the absence of visible ocular abnormalities. Along with other objective findings, such as optic nerve appearance and optical coherence tomography imaging, QoL questionnaires may help provide a more global picture of visual impairment as experienced by the patient.
OCT imaging in MS
Anatomy overview
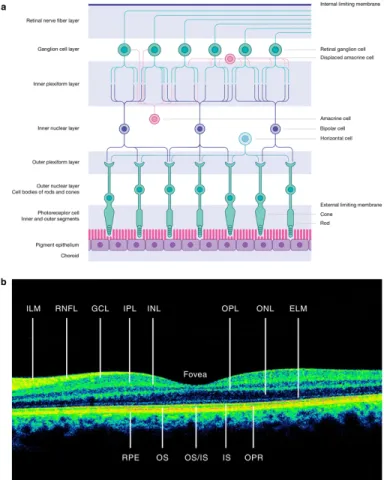
The retina is multi-layered and composed of six types of neurons. Its average thickness is 120um, with a maximum of 230 um in the macula (Miller et al., 2005). The external retinal layers are involved in light transduction and include photoreceptor cells. The inner retinal
layers, specifically the ganglion cell and retinal nerve fiber layer, are intrinsically related to the optic nerve and central nervous system. Therefore, they can be affected by numerous
conditions such as glaucoma and other neurologically-related optic neuropathies.
The retinal ganglion cell layer contains approximately 1.2 million ganglion cells and is thickest in the perifoveal area. In fact, the central macular area contains an estimated 69% of all retinal ganglion cells (Miller et al., 2005). The retinal ganglion cell layer is made up of cell bodies of the retinal nerve fiber layer. Therefore, the RNFL and GCL represent different parts of the same cell. The RNFL is typically measured on OCT at the peripapillary area, where it is at its thickest. The GCL is typically measured at the macula, where the majority of retinal ganglion cells are concentrated. RNFL measurements indicate axonal integrity or damage, while GCL thickness represents neuronal cell integrity. It seems logical to think that both these layers would be damaged after acute inflammation of the optic nerve (ON) by retrograde atrophy. However, based on the current literature, the relationship between RNFL and GCL loss is not yet clearly understood in MS patients without optic neuritis.
The inner plexiform layer (IPL) contains ganglion cell dendrites and their synapses with the underlying bipolar cells (Remington, 2012). Depending on the OCT model, macular analysis can include individual layer segmentation (ex. GCL) or can provide multiple layer analysis such as the ganglion cell complex. The ganglion cell complex is obtained by adding the retinal nerve fiber, ganglion cell and inner plexiform layers.
Figure 3. Retinal layers and their cell composition (Britze, Pihl-Jensen, and Frederiksen 2017)
OCT technology
OCT is a non-invasive technology used to visualize ocular tissues such as the retina in vivo, with extremely high resolution. It uses an interferometer with a low-coherence light source to produce a high-quality cross section through tissues, depending on their density and light-reflection capacity (Frohman et al., 2006). The different retinal layers can be analyzed and quantified, either averaged over a large area or averaged as quadrants / sections surrounding the optic nerve or macula, with a resolution capacity of less than 10 microns (um). The RNFL can be compared to a normative database, which allows for age-matched comparison, whereas other retinal layers, such as the GCL do not always have a
normative database available. Spectralis OCT
The OCT used in this study will be the Spectralis (Heidelberg Engineering Inc., Heidelberg, Germany), which is mainly used worldwide to monitor RNFL progression (thinning) in glaucoma (Serbecic et al., 2011).
The Spectralis OCT is part of the newest generation of spectral-domain (SD) OCT technology. This technology is superior from past time-domain (TD) OCT regarding improved impage resolution, imaging speed, scan coverage and retinal segmentation algorithms. The Spectralis OCT operates with TruTrack technology, a proprietary
eye-tracking software which uses automated eye alignment. Reproducibility has been shown to be extremely high with Spectralis imaging, with coefficients of variation ranging from 0.29% to 1.07% for RNFL measurements (Serbecic et al., 2011). Furthermore, foveal-disc orientation is measured automatically with the Fovea-Disc Alignment system. This ensures that follow-up sans will be taken at precisely the same location and that RNFL sectors are positioned relative to the fovea on each scan, despite eye movements during data acquisition.
OCT imaging in MS
One of the hallmarks of MS-related disability is axonal loss affecting different parts of the central nervous system (Petzold et al., 2010). The retina allows direct, non-invasive visualization of its unmyelinated axons, the RNFL. With optical coherence tomography, the RNFL can be measured and studied in cross-section, in vivo, to further understand the development and progression of MS (Petzold et al., 2010). This technology has the unique advantage of providing an objective, precise and quantitative measure of axonal loss that is
invisible on fundus examination. Furthermore, information on neuronal cell body loss can be obtained by imaging the ganglion cell layer in the macular area. OCT testing is one of the only objective measures for assessing damage to the anterior visual pathway disease in MS (Frohman et al., 2006).
RNFL thinning has been shown MS in patients without prior optic neuritis (Walter et al., 2012). Therefore, OCT may provide confirmation of axonal loss in the absence of visible ocular abnormalities or subtle optic neuropathy, which may help explain self-reported visual complaints in MS patients. Furthermore, RNFL thinning may also serve as a reliable biomarker for disease progression, as it represents direct axonal loss in the central nervous system. The use of OCT has been suggested as a possible marker to help develop neuroprotective drugs to treat MS.
In recent years, because of increased resolution of OCT imaging, the ganglion cell layer (GCL),has been studied in addition to the RNFL and has been shown to be
negatively affected by MS (Garcia-Martin et al., 2014) A recent meta-analysis concluded both RNFL and GCL+IPL thinning in MS eyes with and without history of optic neuritis (Petzold et al., 2017). Eyes with history of optic neuritis showed a 20 um RNFL thinning and 16 um thinning of the GCL and IPL layers, compared to controls. Eyes without optic neuritis showed 7 um of RNFL thinning and 6 um for the GCL and IPL layers. The study concluded that the most robust differences between eyes with MS and controls are found in the
peripapillary RNFL and macular GC+IPL. Another study concluded that GCL + IPL thinning was most significantly correlated with both visual function and vision-specific QoL (Walter et al., 2012).
Objectives
The first goal of this thesis is to further understand the structural damage to the afferent visual pathway, via the retinal layers, in a group of participants with MS. OCT imaging will be used as an objective, structural marker for MS-related disability. More specifically, measurements will be taken at the optic nerve (peripapillary RFNL) and in the macular region (total macular thickness and ganglion cell layer thickness). The objective is to confirm whether RNFL, GCL and/or total macular thickness are significantly decreased in MS participants, with and without optic neuritis, compared to age-matched controls.
The second goal of this thesis is to further understand the functional damage to the visual system, via contrast sensitivity and quality of life, in a group of participants with MS. A newly available, more clinic-friendly contrast sensitivity chart will be compared to a known and validated CS chart. Also, vision-specific quality of life will be measured in order to evaluate which aspects of QoL are most impacted in MS participants with and without optic neuritis.
The outcomes will ultimately inform practitioners in order to be able to better screen, manage and counsel patients with multiple sclerosis.
Article 1: Macular and optic nerve head analysis in
multiple sclerosis (MS) using spectral-domain optical
coherence tomography (SD-OCT).
Introduction
Optical coherence tomography (OCT) is a highly reproducible and accurate technology which is being studied as a potential biomarker for patients with multiple sclerosis (Gupta, Zivadinov, Ramanathan, & Weinstock-Guttman, 2016). In the past few years, studies have shown that both OCT measurements of the optic nerve head area and macula can be affected in MS patients with and without prior optic neuritis (Garcia-Martin et al., 2017; Petzold et al., 2017; Martinez-Lapiscina et al., 2016).
In patients with prior optic neuritis (MSON), it is well established that both the retinal nerve fiber layer (RNFL) and ganglion cell layer (GCL) thickness show significant thinning (Petzold et al., 2017). However, for MS patients without a history of optic neuritis (MSNON), the magnitude of these anatomical changes, their clinical significance and correlation to visual function is not yet well established and varies between studies. This is especially true for macular ganglion cell layer analysis, which was not available on older generation OCT instruments and has been less extensively studied than the retinal nerve fiber layer in MS patients (Walter et al., 2012).
The ganglion cell layer is composed of nuclei from which stem axons that course through the retina and are known as the retinal nerve fiber layer. Therefore, both the RNFL and GCL represent different parts of the same cell. The RNFL is typically measured on OCT
at the peripapillary area, where it is at its thickest. The GCL is typically measured by layer segmentation at the macula, where a significant portion of retinal ganglion cells are
concentrated. RNFL measurements indicate axonal integrity or damage, while GCL thickness represents neuronal cell integrity. It has even been suggested that GCL damage may precede RNFL abnormalities in MS patients (Pietroboni et al., 2019). It seems logical to think that both these layers would be damaged after acute inflammation of the optic nerve (ON) by retrograde atrophy. However, based on the current literature, the relationship between RNFL and GCL loss is not clearly understood in MS patients without optic neuritis.
To our knowledge, there is no available protocol or recommended guidelines for eye care practitioners regarding OCT screening in MS patients without prior optic neuritis, despite abnormal findings in multiple studies (Abalo-Lojo et al., 2018; Walter et al., 2012). The goal of this study is to compare OCT measurements in a cohort of MS patients with and without prior optic neuritis and a group of age-matched controls. We hypothesized that MS patients without optic neuritis would show more significant thinning on macular OCT (total thickness and ganglion cell layer thickness) than peripapillary RNFL measurements. We also expected to confirm previous findings that MS patients with optic neuritis have significant thinning on both RNFL and macular OCT and hypothesized that the temporal quadrant would be more significantly affected.
Methods
This study was approved by the research ethics committee at the University of Montreal (#17-139-CERES-D) and by the Commission d’accès à l’information du Québec (CAI), which allowed the primary investigator and research assistant to contact patients with a diagnosis of MS for potential recruitment. The CAI is a governmental agency that oversees
data and consumer protection in the Province of Quebec. Patients were recruited in person or by phone from the Institut de l’oeil des Laurentides (IOL), a multidisciplinary ophthalmology practice near Montreal, Quebec.
Participants
This cross-sectional study included 58 patients with a diagnosis of multiple sclerosis as per their treating neurologist. Patients were subdivided into two groups based on prior history of optic neuritis (MSON, n=29) or absence of past optic neuritis (MSNON, n=28). These two groups were compared to healthy age-matched controls (n=19). Patients of both sexes with all types of multiple sclerosis, age 18 and over, with or without history of optic neuritis, were included in this study. Patients were only included in the optic neuritis group if chart review confirmed a previous diagnosis in at least one eye by an ophthalmologist or neurologist. Patients with diagnosed or suspected retinal or optic nerve disease, except optic atrophy secondary to optic neuritis, were excluded from the study. As glaucoma is a disease that affects OCT results (optic nerve head and macula), patients that are diagnosed or followed as glaucoma suspects were excluded. For the same reason, patients with myopia > 5.00 diopters (D) were excluded. Patients with decreased vision from any cause unrelated to MS
(amblyopia, corneal opacity, visually significant cataract (visual acuity <6/6), optic neuropathy) were not eligible to participate. Some of the previous conditions can impede optimal ocular imaging with OCT and affect image quality. Lastly, patients under the age of 18 or those unable to carry out reliable OCT and visual acuity testing were not included in this study.
Materials
OCT
The Spectralis OCT (Heidelberg Engineering Inc., Heidelberg, Germany) operates with TruTrack technology, a proprietary eye-tracking software which uses automated eye
alignment. Reproducibility has been shown to be extremely high with Spectralis imaging, with coefficients of variation ranging from 0.29% to 1.07% for RNFL measurements (Serbecic et al., 2011). Furthermore, foveal-disc orientation is measured automatically with the Fovea-Disc Alignment system. This ensures that follow-up sans will be taken at precisely the same
location and that RNFL sectors are positioned relative to the fovea on each scan, despite eye movements during data acquisition.
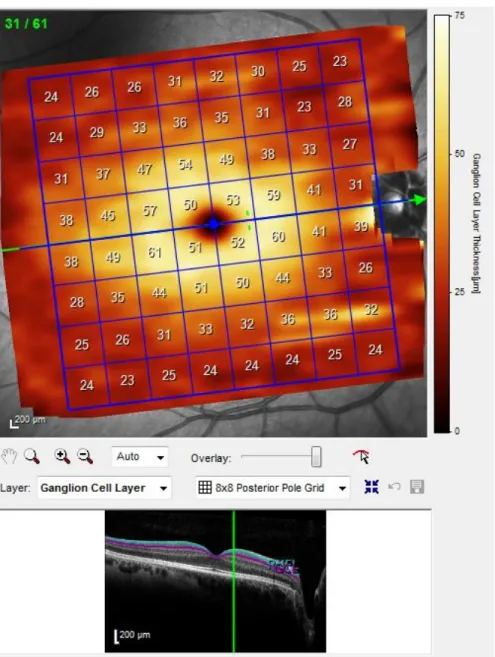
OCT images were acquired by the same two experienced operators for all participants. For each participant, RNFL scans were repeated three times and macular PPole (posterior pole = PP) scans were repeated twice (in order to reduce fatigue, longer acquisition time compared to RNFL). All scans were reviewed by the principal investigator following the
recommendations from the APOSTEL study (Cruz-Herranz et al., 2016). Scans were also excluded if the OSCAR-IB quality control criteria (Tewarie et al., 2012) for retinal OCT were not met. Layer segmentations were automatically processed by the Spectralis software, as illustrated in figures 4 and 5. In only a few cases, segmentation was manually adjusted by the principal investigator where errors were identified. Only scans with signal strength above 20 were considered (Huang et al., 2012) and the highest signal strength scan was chosen for data analysis for both RNFL and Ppole analysis.
Protocol
Patients were examined at the Institut de l’oeil des Laurentides (Boisbriand, Quebec), at which time the following testing was done: contrast sensitivity (CS) (Mars and CamBlobs2), fundus photography and OCT testing (RNFL, macular thickness, ganglion cell layer (GCL) thickness).
Results
Statistical analysis was performed using JASP (version 0.9.1, Netherlands). In the MSNON and control group, data from the right eye only were included in this study. An analysis of variance (ANOVA) was used to compare results of each test in all three groups, followed by post hoc analyses using Bonferroni correction. Effect sizes were calculated using eta squared (h2) for overall ANOVA results and Cohen’s d for paired post hoc comparisons.
Normality of samples was confirmed for each ANOVA using Levene’s test of equality of variances. In the MSON group, the eye with prior optic neuritis was included for analysis. In eyes with bilateral optic neuritis, the eye with weakest Mars contrast sensitivity was chosen as the worst eye and was included for analysis.
1. RNFL
Descriptive statistics for global RNFL across all groups are found in Table 2. Table 2. Descriptive Statistics for Global RNFL across groups
Global RNFL Thickness (um)
Controls MSON MSNON
n 19 30 29
Global RNFL Thickness (um)
Controls MSON MSNON
Std. Error of Mean 2.475 2.629 2.056
Std. Deviation 10.79 14.40 11.07
Minimum 81.00 43.00 70.00
Maximum 115.0 102.0 119.0
There was a significant difference between groups for global RNFL thickness as determined by one-way ANOVA (F(2,75) = 18.33, p = < .001, η² = .33).
Figure 6. Post hoc analyses (Bonferroni) for Global RNFL thickness across participant groups
Multiple Sclerosis without history of Optic Neuritis Group (MSNON) vs. Controls Global (mean) RNFL thickness was not significantly decreased (p = .73, d = .39) in MSNON patients (91.1 um, SE 2.1) compared to controls (95.4 um, SE 2.5). The superior RNFL was the only significantly decreased (p = .05, d = .81) RNFL sector in MSNON patients (104.7
95% CI for Mean Difference
Mean Difference Lower Upper SE t Cohen's d p bonf
0 1 19.754 11.058 28.451 3.637 5.432 1.504 < .001 2 4.318 -4.437 13.072 3.661 1.179 0.394 0.726 1 2 -15.437 -23.161 -7.713 3.230 -4.779 -1.199 < .001
um, SE 2.9) compared to controls (116.8 um, SE 3.2). This previous finding indicates a statistical trend, but has still been considered as valuable since it is accompanied by a relatively large effect size.
Multiple Sclerosis with history of Optic Neuritis (MSON) vs. Controls
As expected, global RNFL thickness was significantly decreased (p < .01, d = 1.50) in MSON (75.7 um, SE 2.6) patients compared to controls (95.4 um, SE 2.5). Furthermore, all RNFL sectors except the nasal quadrant were also statistically thinned compared to controls (see Table 3 for details).
MSON vs. MSNON
The superior (104.7 vum , SE 2.9) and superior nasal (91.0 um, SE 3.5) RNFL thickness in the MSNON group did not differ statistically (p = .40; p = .73 respectively) to patients with prior optic neuritis (MSON) (98.1 um, SE 3.6; 85.1 um, SE 4.0 respectively).
2. Macular thickness
Descriptive statistics for global macular thickness across all groups are found in Table 3.
Table 3. Descriptive Statistics for Total Macular Thickness across groups Total Macular Thickness (Global) (um)
Controls MSON MSNON
n 19 27 28
Mean 292.2 277.0 285.5
Std. Error of Mean 2.195 2.636 2.445
Total Macular Thickness (Global) (um)
Controls MSON MSNON
Minimum 273.0 251.0 261.0
Maximum 305.0 302.0 317.0
There was a significant difference between groups for global macular thickness as determined by one-way ANOVA (F(2,71) = 8.52, p = < .001, η² = .19).
Table 4. Post hoc analyses (Bonferroni) for Total Macular Thickness (global) across participant groups
95% CI for Mean Difference
Mean Difference Lower Upper SE t Cohen's d p bonf
0 1 15.173 6.232 24.115 3.735 4.062 1.246 < .001 2 6.711 -2.165 15.586 3.708 1.810 0.573 0.224 1 2 -8.463 -16.517 -0.409 3.364 -2.515 -0.635 0.042
Note. 0 = controls, 1 = MSON, 2 = MSNON
Multiple Sclerosis without history of Optic Neuritis Group (MSNON) vs. Controls Macular thickness, whether global, superior or inferior, did not show significant differences (p > .05) between MSNON and control groups.
Multiple Sclerosis with history of Optic Neuritis (MSON) vs. Controls
For patients with previous optic neuritis (MSON), all macular thicknesses were statistically decreased compared to controls (see Table 7 for details).
MSON vs. MSNON
The superior macular thickness (285.5 um, SE 2.3) in MS patients without history of optic neuritis (MSNON) was not statistically different (p = .07) from patients with prior optic neuritis (MSON) (278.1 um, SE 2.5). The similarities between MS patients with and without optic neuritis previously found for peripapillary RNFL are therefore reproducible in the macular area.
3. Ganglion cell thickness
Descriptive statistics for global macular thickness across all groups are found in Table 5.
Table 5.Descriptive Statistics for Ganglion Cell Layer Thickness across groups Ganglion Cell Layer Thickness (um)
Controls MSON MSNON
n 16 27 28
Mean 32.15 26.80 29.50
Std. Deviation 2.661 2.979 2.969
Minimum 26.16 21.67 23.36
Maximum 35.70 32.08 35.67
There was a significant difference between groups for global ganglion cell layer thickness as determined by one-way ANOVA (F(2,68) = 17,50, p = < .001, η² = .34).
Table 6. Post hoc analyses (Bonferroni) for Global Ganglion Cell Layer Thickness across participant groups
95% CI for Mean Difference
Mean Difference Lower Upper SE t Cohen's d p bonf
0 1 5.348 3.150 7.546 0.917 5.830 1.865 < .001 2 2.649 0.465 4.832 0.911 2.907 0.925 0.015 1 2 -2.699 -4.578 -0.820 0.784 -3.442 -0.908 0.003
Note. 0 = controls; 1 = MSON; 2 = MSNON
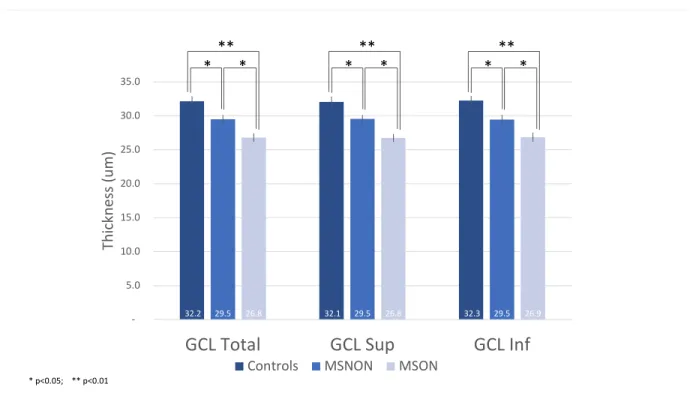
Multiple Sclerosis without history of Optic Neuritis Group (MSNON) vs. Controls Macular GCL thickness (total) was significantly decreased (p = .01, d = .93) in the MSNON group (29.5 um, SE 0.6) compared to controls (32.2 um, SE 0.7). Additionally, superior (p = .02, d = .89) and inferior (p = .02, d = .91) ganglion cell thickness were also significantly decreased.
Multiple Sclerosis with history of Optic Neuritis (MSON) vs. Controls
Total (p < .01, d = 1.87), superior (p < .01, d = 1.88) and inferior (p < .01, d = 1.80) ganglion cell layer thickness was significantly decreased in patients with prior optic neuritis compared to controls.
Table 7. Post hoc analyses (Bonferroni) for OCT parameters across participant groups
Figure 7. Mean GCL thickness with SE and significance levels across groups
32.2 29.5 26.8 32.1 29.5 26.8 32.3 29.5 26.9 5.0 10.0 15.0 20.0 25.0 30.0 35.0
GCL Total GCL Sup GCL Inf
Thick
ne
ss (um)
Controls MSNON MSON
* ***
* p<0.05; ** p<0.01
* *** * ***
Mean (um) SE Mean SE Mean (um) SE Mean SE Mean (um) SE Mean SE
RNFL Global 95.4 2.5 75.7 2.6 1.50** 95.4 2.5 91.1 2.06 0.39 75.7 2.6 91.1 2.1 -1.20** RNFL Sup 116.8 3.2 98.1 3.6 1.06** 116.8 3.2 104.7 2.87 0.81* 98.1 3.6 104.7 2.9 -0.38 RNFL Sup Nas 99.2 3.6 85.1 4.0 0.72* 99.2 3.6 91.0 3.47 0.47 85.1 4.0 91.0 3.5 -0.29 RNFL Nas 69.3 2.2 58.3 2.9 0.79 69.3 2.2 72.7 3.41 -0.22 58.3 2.9 72.7 3.4 -0.84* RNFL Inf Nas 102.3 4.2 84.5 4.4 0.81* 102.3 4.2 104.8 5.32 -0.10 84.5 4.4 104.8 5.3 -0.77* RNFL Inf 121.8 3.6 96.0 3.6 1.40** 121.8 3.6 118.9 3.38 0.17 96.0 3.6 118.9 3.4 -1.20** RNFL Inf Temp 141.8 4.8 107.6 4.7 1.42** 141.8 4.8 132.9 4.18 0.41 107.6 4.7 132.9 4.2 -1.04** RNFL Temp 73.6 3.4 50.0 2.8 1.55** 73.6 3.4 68.3 3.62 0.30 50.0 2.8 68.3 3.6 -1.04** PMB 55.7 2.2 38.3 1.8 1.77** 55.7 2.2 51.4 2.26 0.38 38.3 1.8 51.4 2.3 -1.18** Total thickness 292.2 2.2 277.0 2.6 1.25** 292.2 2.2 285.5 2.45 0.57 277.0 2.6 285.5 2.4 -0.64* Sup thickness 292.7 2.2 278.1 2.5 1.25** 292.7 2.2 285.5 2.27 0.66 278.1 2.5 285.5 2.3 -0.59 Inf thickness 291.7 2.3 275.9 2.9 1.20** 291.7 2.3 285.6 2.79 0.46 275.9 2.9 285.6 2.8 -0.66* GCL Total 32.2 0.7 26.8 0.6 1.87** 32.2 0.7 29.5 0.56 0.93* 26.8 0.6 29.5 0.6 -0.91* GCL Sup 32.1 0.7 26.8 0.5 1.88** 32.1 0.7 29.5 0.53 0.89* 26.8 0.5 29.5 0.5 -1.00* GCL Inf 32.3 0.6 26.9 0.6 1.80** 32.3 0.6 29.5 0.63 0.91* 26.9 0.6 29.5 0.6 -0.79*
Statistically significant pair-wise comparisons are indicated with * < .05 or ** < .001
Cohen's d Op tic n er ve h ea d Ma cu la
Control Group MSON Control Group MSNON MSON MSNON
Discussion
The purpose of the present study was to see whether OCT parameters could distinguish MS participants without prior optic neuritis from age-matched controls. Interestingly, our study found that the only OCT parameter to distinguish MS patients MS without optic neuritis from healthy controls was ganglion cell layer thickness. Retinal macular fibers are thought to be most vulnerable to different neurological insults, such as demyelinating disease or compression (Miller et al., 2005). This may be due to the extremely high metabolic activity in the macular area. This was the premise for our hypothesis that macular OCT findings would be more affected than peripapillary RNFL. Our results for total macular thickness and peripapillary RNFL global thickness did not show significant thinning in MSNON eyes compared to controls, suggesting that the GCL may be a more sensitive measure of retinal atrophy in the context of multiple sclerosis.
The ganglion cell layer has only started to be studied with OCT technology in recent years (approximately 5) due to increased resolution of images and more precise layer segmentation. The measures of different layer thicknesses can now be easily achieved with segmentation software available for use after retinal images have been taken with OCT technology. The ganglion cells are the nuclei of the RNFL axons, which would explain why this layer could also show thinning as a result of MS-induced axonal loss. Such results have been found in MS participants (Garcia-Martin et al., 2014).
Our study did not corroborate findings of RNFL thinning in patients without prior optic neuritis, as previously shown (Walter et al., 2012; Graham et al., 2016), specifically in the temporal quadrant. The macular fibers of the papillomacular bundle in the RNFL
have their insertion on the temporal part of optic disc, which provides a logical explanation for their susceptibility to damage in MS.
A recent meta-analysis concluded both RNFL and GCL+IPL thinning in MS eyes with and without history of optic neuritis (Petzold et al., 2017). Eyes with history of optic neuritis showed a 20 um RNFL thinning and 16 um thinning of the GCL and IPL layers, compared to controls. Eyes without optic neuritis showed 7 um of RNFL thinning and 6 um for the GCL and IPL layers. The study concluded that the most robust differences between eyes with MS and controls are found in the peripapillary RNFL and macular GC+IPL. It is difficult to compare these findings with our study, since we did not include the inner plexiform layer in our segmentation analysis. Unfortunately, the Spectralis does not have an automatic GCC segmentation analysis. The next step would be to segment the macular IPL and RNFL and calculate the sum of all three layers that form the ganglion cell complex.
Some practitioners may not have segmentation analysis available on their OCT models, so we wanted to include full macular thickness in the present study to see if it can be used to detect subtle differences in MS patients without optic neuritis compared to control
participants. No significant difference was found for total macular thickness, further suggesting the GCL is a more sensitive marker for neuronal loss on OCT.
Ultimately, it will be important to understand the link between OCT findings and visual function in MS patients. This will help determine what role OCT can play in detecting MS-related visual dysfunction that can be very subtle and difficult to detect in a clinical setting. Of all OCT parameters, one study concluded that GCL + IPL thinning was most significantly correlated with both visual function and vision-specific QoL (Walter et al., 2012).
Despite numerous articles having been published on OCT in multiple sclerosis, it is difficult to accurately compare the majority of studies. Considerable variability between instruments, non-standardized protocols for data acquisition, poor resolution on older time-domain OCT, absence of gaze tracking in most OCT software and limitations in layer segmentation software are some of the main factors which complicate interpretation of findings. Furthermore, many studies have only measured peripapillary RNFL, without any macular data acquisition or additional layer segmentation. Further limitations of some of the available literature involve the inclusion of both eyes in statistical analysis without accounting for inter-eye correlation. At the present time, these factors limit which conclusions can be drawn about the role of OCT in multiple sclerosis management.
Data acquisition in the present study was done according to the highest standards of OCT quality control, in accordance to the established OSCAR-IB criteria. Furthermore, the OCT used (Spectralis) is known for its high resolution, incorporation of gaze tracking during all scans, high reproducibility and small margin of error (Polo et al., 2014). However, there are several limitations in this study, the most important of which is small sample size. Also, patients were not subdivided into types of MS because groups would have been too small and lack statistical power.
In conclusion, OCT may provide confirmation of axonal and/or neuronal loss in the absence of visible ocular abnormalities or subtle optic neuropathy, which may help explain self-reported visual complaints in MS patients. Furthermore, ganglion cell layer thinning can possibly serve as a biomarker for disease progression, as it represents direct neuronal loss in the central nervous system. The use of OCT in MS has a promising future and has even been suggested as a possible marker to help develop new neuroprotective treatments.
Conclusion
In MS patients with prior ON (MSON), most optic nerve head (RNFL) and macular thicknesses were decreased on OCT, as expected. In MS patients without prior ON (MSNON), optic nerve head (RNFL) thicknesses were not significantly decreased, except for the superior sector. Macular OCT findings allowed differentiation of this group from age-matched healthy controls. More specifically, the ganglion cell layer thickness was consistently significantly decreased in MSNON eyes compared to control group. These findings were upheld for total, superior and inferior GCL thickness. These results are consistent with our hypothesis that macular OCT measurements are more significantly affected than peripapillary RNFL thickness in patients with MS without optic neuritis. Macular GCL thickness can help detect subtle structural changes which may precede visual dysfunction.
Article 2: Visual function and vision-related quality of life
in multiple sclerosis.
Introduction
Visual function and vision-related quality of life have been shown to be affected in patients with MS with and without prior optic neuritis (ON). In many cases, visual loss is caused or worsened by episodes of acute demyelinating ON (Sakai et al., 2011). While long term visual outcome is said to be favorable in patients who develop ON, a significant number of patients perceive their long-term visual function as abnormal (Optic Neuritis Study Group, 2008). Furthermore, standard visual function testing often yields results of 20/20 or better, yet 34.6% of MS patients report persistent long term visual defects (Jasse et al., 2013). A mismatch between clinical signs and symptoms is especially true in
patients without obvious prior ON, where MS-related visual loss can be very subtle (Ma et al., 2002). This disparity between symptoms and normal clinical findings is often due to the lack of sensitive visual function measurements during routine optometric and
ophthalmological examinations. The use of contrast sensitivity and validated vision-specific quality of life questionnaires can play an important role in detecting subtle but symptomatic visual dysfunction in these patients.
Contrast sensitivity (CS) has been shown to be a sensitive subjective measure of visual dysfunction in MS (Thayaparan et al., 2007). Unfortunately, this test is very rarely done in clinical setting, partly because additional time and equipment is required. The Pelli-Robson contrast sensitivity chart is a validated, highly repeatable and specific
measure of visual dysfunction in MS (Thayaparan et al., 2007). Other contrast sensitivity charts exist and may be easier to use in a clinical setting. The Mars is a more portable option for testing contrast sensitivity and may be easier to incorporate into routine eye examinations than the Pelli-Robson chart. It has been validated in a low vision population (Haymes et al., 2006). The CamBlobs2 is the first single-use, printed CS chart that can be self-administered by patients to monitor progression at home or in a clinical setting. These unique characteristics may be useful in motivating eye care providers to test CS in a clinical setting. Camblobs2 has been validated in normal participants and has shown very good reproducibility and agreement with Pelli-Robson CS (Griffin et al., 2017). The same study found that it is less dependent on viewing distance and refractive error than grating or letter contrast tests.
The NEI-VFQ-25 is a validated questionnaire used to measure vision-related quality of life and is commonly used in research for different chronic ocular diseases (C M Mangione et al., 1998). The 25-item questionnaire has been shown to be a sensitive and useful tool in assessing visual function in MS patients (Noble et al., 2006).
This study measured Mars CS in a cohort of MS patients with and without optic neuritis, as well as a group of age matched-controls. To our knowledge, this is the first study to specifically evaluate the MARS chart in an MS population. The MARS chart was also be compared to a new CS test, Camblobs2, that has yet to be validated in patients with MS. We hypothesized that CS measured with CamBlobs2 would yield similar scores to the Mars CS test in a cohort of MS patients. We also hypothesized that both charts would show good agreement (correlation). The second objective of this study was to evaluate if
the NEI-VFQ-25 questionnaire could distinguish MS patients with and without optic neuritis to age-matched controls.
Material and methods
This study was approved by the research ethics committee at the University of Montreal (#17-139-CERES-D) and by the Commission d’accès à l’information du Québec (CAI), which allowed the primary investigator and research assistant to contact patients with a diagnosis of MS for potential recruitment. The CAI is a governmental agency that oversees data and consumer protection in the Province of Quebec. Patients were recruited in person or by phone from the Institut de l’oeil des Laurentides (IOL), a multidisciplinary ophthalmology practice near Montreal, Quebec.
Participants
This cross-sectional study was done with the same participants as the previous experiment and included 58 patients with a diagnosis of multiple sclerosis. Participants were subdivided into two groups based on prior history of optic neuritis (MSON, n=29) or absence of past optic neuritis (MSNON, n=28). These two groups were compared to healthy age-matched controls (n=19).
Inclusion criteria
Patients of both sexes with all types of multiple sclerosis, age 18 and over, with or without history of optic neuritis, were included in this study. Patients were only included in the optic neuritis group if chart review confirm previous diagnosis in at least one eye by an
Exclusion criteria
Patients with diagnosed or suspected retinal or optic nerve disease, except optic atrophy secondary to optic neuritis, were excluded from the study. Patients with decreased vision from any cause unrelated to MS (amblyopia, corneal opacity, visually significant cataract (visual acuity <6/6), optic neuropathy) were not eligible to participate. The previous conditions were excluded as they have been shown to affect vision-related quality of life and visual function, such as contrast sensitivity. Lastly, patients under the age of 18 or those unable to carry out reliable visual acuity testing were not included in this study.
Study Protocol
Patients were examined at the Institut de l’oeil des Laurentides (Boisbriand, Quebec), at which time the following measures were administrated: NEI-VFQ-25 vision-specific quality of life questionnaire and contrast sensitivity (Mars and CamBlobs2 charts).
NEI-VFQ-25 Questionnaire
The NEI-VFQ-25 was either administered by the primary investigator or research assistant, or was sent to the patient electronically and completed prior to the date of testing, as per patient preference. Scoring was done according to the guidelines provided by the instrument developers (Mangione, 2015). Each item has a score ranging from 0 to 100, which can be averaged into an overall composite score or can be used to calculate 11 vision-specific subscale scores. The subscale categories are as follows: general vision, ocular pain, near activities, distance activities, social functioning, mental health, role difficulties, dependency, driving, color vision and peripheral vision. Unanswered questions
are considered missing items and are not considered when averaging scores. The closer the score is to 100, the better the result of the composite or subscale score.
Contrast sensitivity
Contrast sensitivity measures the lowest contrast distinguishable by the patient by decreasing contrast on a chart containing letters of the same size (same spatial frequency). In this study, CS was measured monocularly and binocularly with the CamBlobs2 and Mars charts. Both tests were conducted with refracted near correction and at the same luminance level.
The Mars test assesses contrast sensitivity at 50 cm. Forty-eight letters placed on eight lines with an increase of 0.04 log units are used to determine the contrast threshold (Arditi, 2005). The range of contrast tested is 0.04 to 1.92 log units (Thayaparan et al., 2007). Testing ends when the patient misses 2 consecutive letters (Dougherty et al., 2005). Contrast sensitivity is calculated by taking into account the number of letters missed prior to stopping the test with a given value of 0.04 log unit for each letter (Dougherty et al., 2005; Haymes et