Provides Insight into Cell Sensitivity to
BCNU-Induced DNA Damage
by Yuge Ji
S.B., C.S. M.I.T., 2018 MASSACHiUSETTS INSTITUTE OFTECHNOLOGYOCT
0 7
2019
LIBRARIES
Submitted to the Department of Electrical Engineering and Computer Science in Partial Fulfillment of the Requirements for the Degree of
Master of Engineering in Computer Science and Molecular Biology, at the
Massachusetts Institute of Technology September 2019
The author hereby grants to M.I.T. permission to reproduce and to distribute publicly paper and electronic copies of this thesis document in whole and in part in any medium now known
or hereafter created.
Author:
Certified by:
Signature redacted
4
Department of lectrical Engineering and Computer Science August 23, 20
Signature redacted.
Professor Leona Samson, Thesis Supervisor August 23, 2018 ;;,
Certified by:
CSignatureredacted
Professor Bevin Engelward, Thesis Supervisor August 23, 2018
Acceptedby_Signature
redacted
Katrina LaCurts, Chair, Master of Engineering Thesis Committee
1
;)
:0
X
MITLibraries
77 Massachusetts Avenue
Cambridge, MA 02139 http://Iibraries.mit.edu/ask
DISCLAIMER NOTICE
Due to the condition of the original material, there are unavoidable
flaws in this reproduction. We have made every effort possible to
provide you with the best copy available.
Thank you.
The images contained in this document are
of
the
best quality available.
Sensitivity to BCNU-Induced DNA Damage
by
Yuge Ji
Submitted to the Department of Electrical Engineering and Computer Science on August 23, 2019 in Partial Fulfillment of the Requirements for the Degree of Master of Engineering in Computer Science
Abstract
The transcriptional response to DNA damage plays a critical role in cellular responses to exoge-nous stress, and is a key component of resistance to therapeutics in cancer cells. Understanding the underlying mechanisms, as well as the differences in DNA damage responses, between cell lines can have implications for how we evaluate drug treatments, and contributes to our under-standing of cellular growth and replication. Here, I have analyzed a dataset previously created
by Chandni Valiathan, replicating and expanding beyond her initial analyses. Dr. Valiathans
initial studies clearly show that cell lines derived from different individuals are highly variable in their sensitivity to BCNU. We therefore set out to determine mechanisms underlying this difference in phenotypic responses. Using gene expression analysis methods, we determined that the transcription factor NF-Y plays a key role in the differential response among cell lines, which is consistent with a model wherein transactivation of genes related to DNA repair, cell cycle arrest, and apoptosis together dictate cell fate.
Acknowledgements
Some notes of gratitude:
" First, a special thank you to Anne Hunter and the EECS office, without whom none of
us have graduated.
" Thank you to Duanduan Ma for working with me time and again on the IPA analysis,
Eric Guo for teaching me ChIP-seq, Brian Joughin for inviting me to Lauffenburger lab meetings and providing me with valuable feedback, Tony Lee for some super terrific advising, Nhan Huynh for pulling me through Westerns, and everyone in the Engelward Lab for being exceptional role models, and for their encouragement and enthusiasm.
" I would like to thank Doug Lauffenburger for opening the doors to a wealth of resources
that help and inspire my research, Bevin Engelward for generously providing me with her time, feedback, and an awesome lab to work with, and Leona Samson for bestowing me with this wonderful opportunity for my degree, supporting me both this past year and on-wards through publishing this work.
" A great big hug to my friends, for being there and being the kind of people who are always
there. In particular: waifu, thank you for always listening to and accepting me. uwu • I am, as always, indebted to my mother for her ever-constant support, encouragement,
and love.
Contents
Abstract
Acknowledgements
1 Introduction
1.1 D ata Sources . . . .. . .. .
2 Materials and Methods
3 Results
3.1 Characterization of cellular response to BCNU exposure using transcriptional tim e course data . . . .
3.2 Inference of gene networks and regulatory interactions from transcriptional time course data . . . .. .. .
3.3 Differential gene expression analysis identifies NF-Y as a common upstream factor 28 3.4 NF-Y binding differs between sensitive and resistant cell lines . . . . 32 3.5 Supplementary Figures . . . . 33 5 1 3 9 15 17 21 21 25
4.1 D iscussion . . . . 35
Bibliography 37
List of Figures
1.1 Mechanism of action of BCNU . . . . 12
1.2 Survival curves from Chandni Valiathan. . . . . 13
1.3 Project workflow . . . . 15
3.1 K-means clustered normalized transcriptional profiles. . . . . 23
3.2 Hierarchical clustering of 556 probe sets. . . . . 23
3.3 Basal expression of 123 probes in 24 cell lines. . . . . 24
3.4 GO BP gene sets for basal expression probe set. . . . . 25
3.5 DAVID results for upregulated prove sets. . . . . 26
3.6 DAVID results for cluster 1, GO Biological Process. . . . . 26
3.7 Cluster behavior in cell line 4. . . . 27
3.8 TFBS gene sets for the four clusters. . . . 28
3.9 Figure from Benatti et al., 2008. . . . .. 29
3.10 IPA analysis of P53 network. . . . . 30
3.11 NF-Y trimeric factor expression in all cell lines. . . . . 31
3.12 Western analysis. . . . . 33 7
Chapter 1
Introduction
The creation and prevalence of mutations in DNA as a result of DNA damage has been shown to be a driver of key cellular phenotypes, such as growth inhibition and apoptosis. DNA dam-age occurs due to a variety of dam-agents, from environmental exposures to DNA reactive chemicals and various kinds of radiation, to endogenous exposures to naturally occuring oxidative species in the cell. To combat fatal instability in our genetic code, a complex set of genes and pro-teins are involved in the response to DNA damage and in numerous DNA repair mechanisms. These interactions and pathways regulate cell survival, in many vital ways which are not fully understood. For example, a decline in DNA integrity, sometimes caused by a lack of sufficient
DNA repair, is the fundamental source of cancer [1]. Gaining further insight into the mech-anisms of DNA damage response and repair is important as differences in repair mechmech-anisms and regulation can determine cell death, malfunction, and survival. For example, the interplay between and regulation of continued proliferation versus apoptosis is a primary contributing factor to cancer metastasis [2]. Many chemotherapeutics act as toxins to a cell by causing DNA damage [3], which allows them to kill cancer cells, which are fundamentally overly proliferating cells. Thus, a critical utility gained from studying DNA damaging agents is in the treatment of cancer.
Given the ability of DNA damaging agents to reduce cell proliferation, many chemotherapeutics are DNA damaging agents. This is critical in the treatment of cancer, as many cancers have
defects in DNA repair that lead to genomic instability, which lead to further mutations and uncontrollable proliferation. However, the same deficiencies in DNA repair pathways which resulted in cancerous behavior can also lead to increased sensitivity to DNA damaging agents. Thus, BCNU's mechanisms of action may be particularly useful in the context of cancer. The formation of interstrand crosslinks and base lesions results in DNA damage that both reduces proliferation and causes replication errors during cell division. As a result, BCNU can both reduce the number of cancer cells, and preferentially target cancer cells due to their speed of division and potential inadequacies in DNA repair pathways.
Due to the usage of DNA damaging agents for cancer treatment, it is important to consider the apoptotic and cell cycle response caused by these treatments. Specifically, there are two ways that understanding DNA repair is relevant - the first is to optimize for killing the tumor, and the second is to minimize toxicity to healthy cells in the patient.
In addition to inter-tumor differences in response to chemotherapeutics, it is important to consider the difference in sensitivity and magnitude of cellular response to DNA damage between individuals. Differences in the efficiency of DNA repair mechanisms in individuals can have an impact on susceptibility to disease and cancer [4, 5]. While there have been many studies on the general response of cells to DNA damage, it has come to light that inter-individual responses (such as cell cycle arrest and apoptosis) can vary widely, such that effective treatment in one patient can produce little to no positive effect in another, or an approved treatment can prove to be overly toxic in certain individuals. In the treatment of tumors and cancerous tissue, many chemotherapeutics aim to induce an apoptotic response in cancer cells [3, 6]. However, this induced DNA damage often has highly varying effects among different individuals, with some individuals experiencing resistance to treatment for reasons that are not well understood
[7]. Furthermore, different tumors can have mechanistic differences in what leads to over-proliferation, and thus require different treatment. For example, tumors with intact DNA repair pathways may not respond with inhibited growth after treatment with a DNA-damage-causing chemotherapeutic.
im-11
portant in ascertaining cellular phenotypes and constructing informative models of the cellular response to perturbation. Differential expression of transcripts in a cell can provide snapshots of basal and induced changes in gene expression. The transcriptional response to DNA dam-age provides significant insight into the mechanisms of DNA damdam-age repair [8, 9]. However, the complexity of transcription factor networks make it difficult to identify which genes and pathways are responsible for inter-individual differences in the response to DNA damage [4]. To further highlight the importance of understanding these mechanisms, an estimated 1/3 of genes are responsive to acute DNA damage, and further research has shown that gene changes go beyond differences in expression
[10,
11]. A close examination of gene expression over timeon the transcriptional level allows us to unveil regulatory pathways and causal mechanisms. Having a more precise understanding of the behavior of the genes involved in DNA damage re-sponse can allow us to predict cellular sensitivity to damaging agents [12], and ideally provides information that can guide development of better approaches to restoring sensitivity to tumor cells [13]. Understanding growth and replication is the basis for new insights that can change how we evaluate drug efficacy. Elucidating why there arise differences in DNA damage response efficiency which impact survival between cells of the same cell type can have implications for how we evaluate drug treatments, and contributes to our understanding of cellular growth and replication.
I will henceforth primarily detail an investigation of the different responses to DNA damage
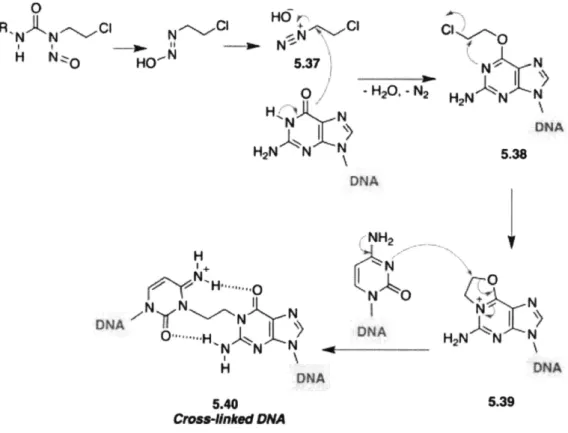
caused by bis-chloroethylnitrosourea (BCNU) also known as Carmustine. BCNU falls under the category of a DNA aklyating agent: in other words, the mechanism of damage results in strand breaks during cell division due to the addition of an alkyl group to the double helix structure, which causes a DNA lesion that results in a strand break during replication. BCNU is commonly used as a chemotherapeutic at the site of the tumor (most often malignant glioblastoma [15, 16], as BCNU goes through the blood-brain barrier [17]), with recent advancements allowing for continuous delivery in the form of wafers [16]. BCNU halts cell growth through two different types of DNA damage: chloroethyl adducts at the 06 position of guanine and inter-strand cross-links [18, 14].
d V"Cl 5.37 0 Hp.-Na; H;* NN HN N N DNA H 1+ N N .. DNA N
1N
N O'%~HN N N NH2 NO DNA DNA 5.40 Cmes4nked DMA N N H2N N N DNA 5.38 N KN H2N N N DNA 5.39Figure 1.1: Mechanism of action of BCNU in affecting adenine to cause interstrand crosslinks and cellular toxicity, from Medicinal Chemistry of Anticancer Drugs (Second Edition), 2015.
0
' N 0 ON C
Survival Curves for 24 Lymphoblast Cell Lines from Different Individuals
100
sn 10 0 1 0 0.1 0 10 20 30 40 50 60 70 80Dose (pM)
Figure 1.2: Data from Valiathan et al. [19] showing vastly differential survival responses to
BCNU treatment in 24 Coriell cell lines, which come from unique individuals with varied
ethnicity. -'S
~1
m16 a-... --- 20 X.-24 22~--23
90 1 q 13Person
Person 4
examined the transcriptional signatures of four Coriell lymphoblastoid lines originally isolated from different individuals after treatment with BCNU. Valiathan et al. 2013 [19] quantified a range of sensitivities to BCNU treatment in 24 Coriell cell lines, each established by EBV transformation of lymphoblasts from different individuals. From an ethnically diverse set, the Coriell lines represent a valuable standard of potential genetic diversity. With the Coriell col-lection, we can evaluate potential person-to-person variation in response to a variety of external treaments, including chemotherapies. Thus, by using four Coriell cell lines, we can interrogate the inter-individual differences in response to BCNU, and their potential mechanisms of action.
Of the 24 cell lines assayed, Valiathan selected the two most sensitive cell lines, cell line 4 and
cell line 5, and two resistant cell lines, 13 and 16, to further interrogate. The sensitivity of the cell lines differ significantly (Figure 1.2), where resistant cell lines experience over a thousand fold viability over sensitive lines at the 40 pM dosage used in our experiments
[19].
Sensitive cell lines have an LD50 for BCNU of less than 10 pM whereas resistant cell lines have an LD50 for BCNU of 40 pM [19].The process we followed to characterize the cellular response to BCNU follows a standard work flow of experiments and results (Figure 1.3). The analysis can be divided into two parts based on the data: 1) analysis of the transcriptional response to BCNU in order to reveal possible underlying molecular pathways that correlate with sensitivity and 2) determining the mechanism of action by which the damage response differs between cell lines. Here, based on analysis of cellular assays and the transcriptional response, we show that sensitive cells arrest before mitosis and die primarily through apoptosis. In addition, our analysis of gene expression patterns has revealed that NF-Y and p53 targets behave differently between cell lines. Post-transcriptional activity of NF-Y and p53 transcription factor activity play important parts in cell line sensitivity to alkylation damage.
While many studies have focused on a single time point in the response to chemotherapy, few studies have been designed to investigate the dynamic responses that occur over time. The dynamics of a transcriptional response over time gives us critical insight into gene expression patterns, and particularly co-association between genes, which helps to understand which
cellu-1 cellu-1 Datauir,-p.
1
nn
Geest r c
4 cell lines 8 timepoints (0-72 hours)BCNU and ethanol treated
= 120 microarray samples assay validation of predicted phenotypes Mitotic fraction Apoptotic fraction Comparison of upstream regulator NF-Y activity Regulatory network construction from putative targets Western blot CIP-st
Figure 1.3: Project workflow. Most experimentation related to cell culture assays had pre-viously been completed. All computational analyses of the data sources detailed below were independently performed. Analyses and assays done by Chandni Valiathan are in orange, whereas my analyses are in blue with a box around them.
lar phenotypes occur before others. This helps to pinpoint potential driver genes and, in turn, actionable targets for therapeutics.
1.1
Data Sources
Table 1. Organization of the 120 microarray samples.
Given the benefits of investigating a dynamic transcriptional response, time-course transcrip-tional data were obtained using Affymetrix microarrays and analyzed to determine differentially expressed genes, across 8 time points for a total of 120 samples (Table 1). Affymetrix microar-rays capture the mRNA expression of cells in the sample through a continuous luminosity measure of the microarray spot. Each sample contains 54,650 probes (also know as probe sets), where each probe represents a spot with DNA oligos that are made to hybridize to specific cDNAs. The expression level of certain genes may be quantified by multiple probes due to re-dundancy in the probe sets to increase accuracy of the measurement of gene expression. Thus, each microarray approximately captures the average expression levels of tens of thousands of genes per sample.
mRNA expression
profiles Cell line
characterization
Proliferation assay from alithan et al Cel Icycle assay
cell line untreated timepoints treated timepoints total (2 replicates)
4 8 7 30
5 8 7 30
13 8 7 30
16 8 7 30
For the computational analysis, all Affymetrix microarray measurements of the four Coriell cell lines and chromatin immunoprecipitation sequencing (ChIP-seq) characterization of untreated cell line 4 were generated by Chandni Valiathan by herself and generously provided by Professor Leona Samson.
In order to quantitatively measure the effect of BCNU treatment in the lymphoblast cell lines over time, all four cell lines were treated with 40 pM BCNU and transcriptionally profiled at
8 timepoints: 0, 4, 8, 12, 24, 48, and 72 hours. As mentioned in Chandni Valiathan's original
thesis [20], 40 pM was chosen as the dosage based on the proliferation assay data from
[19]
in which a BCNU concentration of 40 pM resulted in a 48-fold change in cell survival between the most sensitive and most resistant cell lines, while maintaining sufficient viability in the most sensitive cell line for a sufficient number of cells to be harvested for profiling.In addition to the microarray gene expression data listed above, Professor Rebecca Fry also provided preliminary basal expression data of the 24 lymphoblastoid cell lines from which the set of four were chosen. This basal expression data was originally generated as a cell line comparison in Fry et al,. 2008 [21].
Chapter 2
Materials and Methods
Cell culture. Lymphoblastoid suspension cell lines were grown in RPMI medium (nvitrogen)
supplemented with 15% FBS, supplemented with 2% penicillin-streptomycin and L-glutamine.
All cell lines were in the mid-log phase of growth prior to treatment.
Drug treatment. Cells were grown to mid log-phase prior to drug treatment. On the day of
treatment, cells were spun down at 1500 rpm for 5 min and diluted to 4.5x10⁵ cells/ml in warm serum free RPMl medium. BCNU (100 mM stock in 100% ethanol; Sigma-Aldrich C0400) was added directly to cells at a concentration of 40 M. Mock-treated samples were set up in the same manner as treated samples, except that 100% ethanol was added to cells instead of
BCNU. After an hour long BCNU exposure, cells were washed with IX PBS and re-suspended
in fresh RPMI medium supplemented with 15% FBS. Cells were collected at the each time-point following the appropriate protocol for each assay.
Affymetrix microarray values. Reading off of values from the probe images and Robust
Multi-Array Averaging (RMA) normalization of the raw Affymetrix microarray .CEL images were performed using the affy package [22] from Rs Bioconducter toolkit. Microarrays were run on HG-U133Plus2 Affymetrix chips. Data was exported for further analysis and visualization in python. Heatmaps were created to visualize log normalized probe set expression. Visualization and further downstream analysis makes use of values normalized to the control sample, such
that
t
expression= log
2( t 0
Plotting was performed using the python package matplotlib[23].
Replicate consistency. As a measure of replicate consistency, samples were plotted in Prin-ciple Component Analysis (PCA) space using the first two prinPrin-ciple components generated by running PCA on gene expression values across all samples. The sensitive cell lines (4 and 5) have the greatest difference between the behavior of replicates, with more divergent behavior than the resistant cell lines between themselves. Pearson R2 values were also calculated for all replicates; correlation were all > .8, with the resistant cell line replicates demonstrating less variability than the sensitive cell lines'.
Identification of differentially regulated probe sets and genes. Analysis of variance (ANOVA) was used to account for the multi-variate nature of the data. Each sample was
la-beled with two binary variables: sensitive versus resistant (hereby referred to as the sensitivity variable), and BCNU treated versus DMSO control (hereby referred to as the treatment vari-able). Identification of differential probe sets across cell lines and timepoints was performed using multi-way ANOVA from the python package statsmodels[24]. Both replicates were in-cluded in the ANOVA. Probe sets where the joint sensitivity x treatment variable had p-value less than .02 (totalling 858) were selected as significant for the transcriptional signature. A smaller set of probes (556) where the sensitivity x treatment variable p-value < .01 was also defined.
Hierarchical clustering was performed using the python package scipy[25], on the second repli-cate of cell line 4. Cell line 4 was chosen as it was the most sensitive to BCNU and exhibited the most distinct transcriptional response.
K-means clustering (using the default parameters from sklearn [26] with four clusters) was also performed on the second replicate of cell line 4. Four was chosen as the number of clusters as increasing the number of clusters decreased the interpretability of the behavior visualized, and some clusters had an extremely small number of genes. With four clusters, we cleanly capture
19
varying degress of up-regulation and down-regulation.
Gene set enrichment and pathway analysis: We gained initial insight into potential mechanisms through gene ontology enrichment. GO functional analysis was performed by
uploading lists of significant genes onto the online tool DAVID[27, 28. We primarily examined the gene sets included under GO Biological Process, KEGG Pathways (not shown), and UCSC TFBS (Transcription Factor Binding Sites). The latter is derived from curated ChIP-seq data of various transcription factors. Gene sets were considered significant if they fell below a maximum benjamini-corrected p-value of .05 and maximum false discovery rate of .25.
Ingenuity Pathway Analysis(IPA) was performed by the BioMicrocenter to identify significant gene regulatory networks as well as provide visualization of known network activity, in particular the well-studied P53 pathways. IPA also confirmed enrichment of cell-cycle regulatory genes in the set of 858 probes.
ChIP-seq and data processing. Chromatin immunoprecipitation was performed using the
Agilent mammalian protocol. Briefly, cells were cross-linked in 10% formaldehyde for 10 min-utes at room temperature after which Glycine was added to quench cross-linking activity. Cells were washed with IX PBS, aliquoted into tubes (108 cells per aliquote). Prior to immuno-precipitation, cells were permeabilized in lysis buffer (50 mM Hepes-KOH, pH 7.5, 140 mM NaCl, 1 mM EDTA, 10% glycerol, 0.5% NP-40, 0.25% Triton X and protease inhibitors) for
10 minutes at 4C, nuclei were washed and resuspended in sonication buffer (50 mM Tris-HCI pH 8,140 mM NaCl, 1 mM EDTA, 1% Triton X-100, 0.1% SDS, 0.1% Na-deoxycholate).
Nu-clei were sonicated to obtain chromatin fragments <500 bp (36 cycles of 20 seconds on and 1 minute off at 45% amplitude). 50 pl of the sonicated chromatin was saved as input control and the rest was incubated overnight with anti-NF-YA antibody (Rockland, 200-401-100) bound ProteinA-Dynal beads (Invitrogen). Beads were washed thrice with sonication buffer and one last time with a LiCl wash (20 mM Tris pH 8, 1 mM EDTA, 250 mM LiCl, 0.5% NP-40, 0.5% Na-deoxycholate) and eluted in elution buffer(50 mM Tris-HCI, pH 8, 10 mM EDTA, 1% SDS) at 65°C with vortexing. Crosslinks were reversed at 65°C for 6 hours, and samples were treated with RNAse and proteinase K. Following this, DNA was isolated using the
QIAquick
PCRPurification Kit.
Sample preparation, sequencing and preliminary data extraction was performed at the Biomicro Center, MIT on the Illumina sequencing platform. Peak calling and motif discovery on aligned sequences were performed using Homer[29], with default settings.
Western blot analysis. Protein lysate was extracted from cell lines 4 and 13 at 0, 4, 8, 12, 24, and 48 hours, with and without BCNU treatment. Western blot analysis was carried out according to standard procedures by using these primary antibodies: NF-YA polyclonal from Santa Cruz Biotechnology (Santa Cruz, CA) and -actin monoclonal from Sigma. Appropriate JRDye-conjugated secondary antibodies (Abcam) were used and the immunoblots were scanned and quantified using the Odyssey system (Licor Biosciences).
Tools and software: All analyses performed in python made use of Jupyter notebooks[30] running on the luria clusters of the BioMicrocenter, MIT [31].
Chapter 3
Results
3.1
Characterization of cellular response to BCNU
ex-posure using transcriptional time course data
Characterization of the transcriptome after treatment by an alkylating agent can capture both causal and phenotypic effects of DNA damage. To more closely examine potential primary drivers of sensitivity to BCNU, I identified 858 probe sets (mapping to 641 genes) that were differentially expressed after treatment between the sensitive (4, 5) and resistant(13, 16) cell lines using ANOVA (Methods). As compared to the untreated control, BCNU considerably inhibits cell growth in the sensitive cell lines [20]. Using the expression values measured for the most sensitive cell line (4), I clustered these genes into four clusters of similar expression patterns (k-means clustering, Methods, Figure 3.1). Generally, genes clustered into a pattern of upregulation or downregulation, with upregulatory activity primarily occurring at the 12-24 hour timepoints. Notably, 12-12-24 hours is also when the mitotic fraction assay results as demonstrated in Chandni Valiathan's thesis peaked for cell cycle arrest [20]. These clusters allowed us to more specifically categorize the transcriptional response to BCNU treatment. We hypothesized that we would see a stronger response in the sensitive cell lines, caused by a greater change in the transcriptional state from usual phenotypic behavior. We defined amount
of cell survival after BCNU treatment of the resistant lines as the usual phenotypic behavior as the majority of the 24 cell lines assayed in Valiathan et al. 2011 [19] had similar survival curves as the resistant cell lines, with the sensitive cell lines 4 and 5 exhibiting an outlier phenotype of decreased cell viability. More specifically, the standard phenotype for an EBV transformed, stable cell line is proliferation. The resistant cell lines continue to proliferate, but the sensitive cell lines proliferate less after BCNU treatment. Results indeed show that we see a distinct pattern of transcriptional response in the sensitive cell lines. We see distinct patterns of upregulation and downregulation that differ between the treated and untreated conditions, resulting in one large cluster of downregulated genes and three clusters (of varying sizes) of slightly to strongly upregulated genes, with the most marked transcriptional changes occurring between the 12 and 24 hour mark (Figure 3.4). Notably, the control state does not have a marked pattern of genes that are differentially transcribed between treated and control. As expected, the distinct response in the post 12-hour timepoints are in cell lines 4 and 5 (Figure
3.1), and especially so in the most sensitive cell line 4. This is consistent with our hypothesis
that the more significant changes in gene expression will be observed in the sensitive cell lines. In addition to k-means clustering of the data to identify functional groupings, we also visualized the expression values using hierarchical clustering (Figure 3.2). We see that the data clusters by distinct patterns of expression, and the replicates have mostly similar behavior in the differential genes. We also see that not all of the differentially expressed genes are consistent in their behavior from replicate to replicate, particularly in genes with lower levels of expression as between the 100th and 280th probes (Figure 3.2). Nevertheless, overall the two replicates are consistent. Although more fine-grained and clearly interpretable, hierarchical clustering (on cell line 4, both biological replicates; Figure 3.2) did not reveal significant functional behaviors when subsets of the probe sets representing the groups from hierarchical clustering were analyzed using gene ontology enrichment [27, 28]. Hierarchical clustering groups were taken from the second and third layers of the dendogram (Figure 3.2). Since expression data is inherently noisy, it is best to take into account a general behavioral trend rather than more precise associations. Therefore, we continued our gene ontology enrichment analyses with clusters derived from k-means clustering instead of hierarchical clustering.
3.1. Characterization of cellular response to BCNU exposure using transcriptional time course data23
Downregulated
Upregulated
-Figure 3.1: K-means clustered normalized transcriptional profiles for 858 differentially expressed probe sets derived from ANOVA in the four cell lines after treatment with BCNU. Up and down expression patterns for the probe sets can be seen. Values are log2 (t/tO); a lack of change from the time 0 is centered at zero (white). Expression values with high relative expression are indicated in red and low relative expression are indicated in blue.
E
cell line 4. repkate (T. T} treated
Replicate 1 24 Replicate 2 - 24 WO10 260 -10 400 500
I
-10 r' 0 -9I
Figure 3.2: Hierarchical clustering of the smaller 556 set of differentially expressed probe sets derived from ANOVA. Expression patterns are log(t/t) of the two treated replicates in cell line 4. Note that hierarchical clustering does not produce a clean divide of up and down regulated genes, as in k-means clustering. Expression values with high relative expression are indicated in red and low relative expression are indicated in blue. Slight differences in replicates are indicated by the orange arrows.
Cell line 4 4 8 12 24 36 48 72 -5 4 8 12 24 36 48 72 0 13 4 12 M 346 72 Clusters Time( hr) a IDO xl 16 4 8 12 24 36 48 72 -- 7 -0.4 -02 C 0 0-. -- 0. 4W
Basal Gene Expression of 24 Cell lines
-- - 6.".o -NM0
5
10
Cell Lines
15
-7
6
5
-4
-3
20
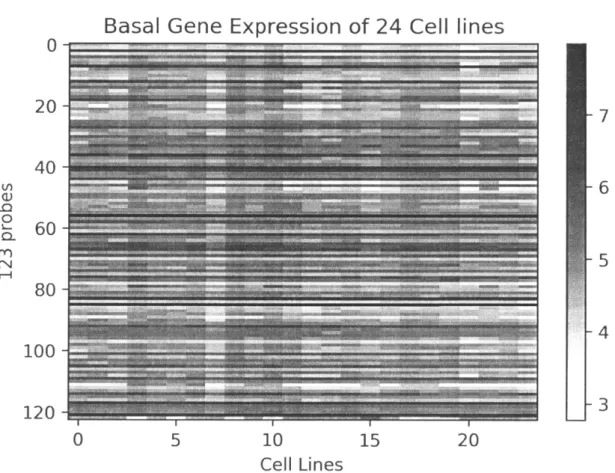
Figure 3.3: Basal expression of 123 probes from the 24 Coriell cell lines assayed in Valiathan et al. 2011 and Fry et al. 2008 to BCNU, for which the correlation of expression with sensitivity was significant(absolute value of Pearson R < 0.6 and p-value < 0.05). Expression values are log(expression), with darker colors representing more highly expressed probe sets.
0
20
40
60
80
LA 0 r-4 r__4100
120
7 7 , IT 7 1 '_ . I . I I I I I I I , 1, ",Ell
3.2. Inference of gene networks and regulatory interactions from transcriptional time course data25
GOTERM PDIRECT ER to G vesi deL~td tranortiRT
m
5 5.1 9.2E-3 9.2E-1GOTER BPDIRECT orotein locahzation to endoniasmic reticulum exit site R 2 2.0 2.OE-2 9.8E-1
GOTERM-0BP.DIRECT orqn InaWnq r" vtire i 2 2.0 2.5E-2 9.7&1 GOTERMBPDIRECT response to cobalt ion RT F 2 2.0 3.OE-2 9.7E-1
GOTERLBPJB_DIRECT prtein stablizatio F 4.0 3.3E-2 9.5E-1
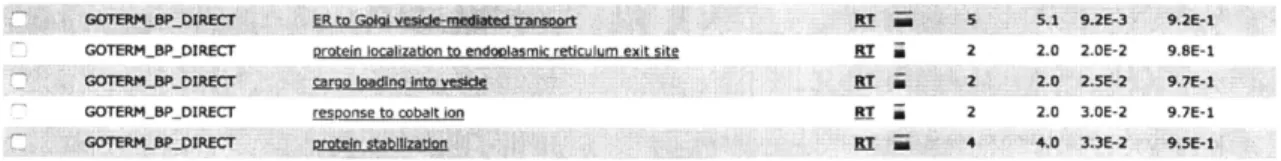
Figure 3.4: The top five enriched GO Biological Process gene sets from DAVID using the 123 probes found by correlation with BCNU sensitivity. Note that results are not statisticallly significant according to the Benjamini corrected p-values.
In addition to our prediction that dynamic responses can reveal understanding regarding mech-anism, we also predicted that analysis of basal levels of gene expression can predict whether a cell type is predisposed to being sensitive or resistant. We analyzed the transcriptomics of the basal expression states of 24 cell lines [21]. The basal expression data contained expression values for 19,289 probes, for which we can measure correlation to the BCNU sensitivity values from Valiathan et al., 2011, which would provide insight into genes which have a response that is linearly correlated with BCNU sensitivity. We identified 123 probes that are correlated with sensitivity (Figure 3.3), where the absolute value of the Pearson R correlation statistic was less than 0.6, and the p-value of the correlation was less than 0.05 (thus, this includes genes both up and downregulated linearly with increased BCNU sensitivity). However, I found that the ontology terms enriched for in these probe sets were not statistically significant and, further-more, unrelated to DNA damage or stress response, as response we clearly see in the sensitive cell lines (Figure 3.5). This leads me to believe that the patterns of transcription observed at the basal level do not encapsulate causal factors.
3.2
Inference of gene networks and regulatory
interac-tions from transcriptional time course data
We broke down the complex response to BCNU-induced DNA damage using gene enrichment analysis. Gene ontology analysis[15] of the differentially expressed probe sets from ANOVA yielded cell cycle regulation and DNA damage response gene sets (Figure 3.5) among other cellular responses. Importantly, the strong signals for p53 mediated DNA damage response and cell division align with what we expect to see given the cell cycle arrest phenotype. In
Upreg Genes GO Biological Process Upreg Genes TFBS Gene Set Enrichment cellular response to UV-C
negative regulation of mast cell apoptotic
process-positive regulation of tyrosine phosphorylation of Stati protein ovulation cycle-regulation of apoptotic process
regulation of cell growth
cell
adhesion-cell
migration-DNA damage response, p53 + cell cycle arrest
15
i-log(p-value) LUN1 API HEN1 PNFl HNF OLF1 MIFI BACH P531L log(p-value)Figure 3.5: Left: The top nine enriched GO Biological Process gene sets from DAVID using the upregulated probe sets from cluster 1, 2, and 3, defined in Figure 3.1, ranked by p-value. Right: The top nine enriched UCSC Transcription Factor Binding Site gene sets from DAVID using the upregulated probe sets from cluster 1, 2, and 3, ranked by p-value.
Cluster 1 GO BP Gene Set Enrichment
regulation of ubiquitin-protein ligase activity involved inmitotic cell cycle G2/M transition of mitotic cell cycle
positive regulation of ubiquitin protein ligase activity sister chromatid cohesion anaphase-promoting complex-dependent catabolic process mitotic nuclear division cell division
log(p-value)
Figure 3.6: The top seven enriched GO Biological Process gene sets from DAVID using the upregulated probes from cluster 1, ranked by p-value.
addition to its role in apoptosis, it is noteworthy that there is evidence that p53 is involved in repair of crosslinks and lesions [46].
To further delineate the complex interactions in the cellular response to BCNU, we also per-formed GO Ontology enrichment for the probe sets in each of the individual clusters from Figure 3.1. Cluster 1 is enriched for regulation of mitosis (Figure 3.6), and is the only cluster of genes which are negatively regulated when comparing the treatment to control samples in cell line 4 (Figure 3.7). Conversely, the upregulated genes (clusters 2-4) are enriched for p53
3.2. Inference of gene networks and regulatory interactions from transcriptional time course data27
Treated vs. Untreated for Cell Line
4
Cluster 1
4 8 12 24 36 48 72 Cluster3 4 8 12 24 3648 72Hours
b
0.8-016-d
.6 -15 - 0.4-0.3 .2-01 0.0Cluster
2
- utreated -- Treated 4 8 12 24 36 48 72Cluster
4
---urntreated -- Treated 4 8 12 24 36 48 72 HoursFigure 3.7: Quantification of the time-course response of the most sensitive cell line (4) after treatment with DNA damaging agent BCNU. The expression values shown represent averaged behavior over time of the probe sets in each of the four clusters from k-means clustering. Expression values from BCNU treated samples are indicated in red, DMSO treated samples in blue. Standard deviation is indicated by the error bars. Grey bars indicate standard deviation for the untreated samples, black bars for the treated samples.
a
015 0.10 005 000 -0.05 -0.10 -0.15 C 025 020' 0.15-0.10' 0.05' 0.00--0.05 -0.10 C~0
-o) C to U -0 01 -j 00.
Cluster I TFBS Gene Set Enrichment Cluster 2 TFBS Gene Set Enrichment Cluster 4 TFBS Gene Set Enrichment 0.00001- 0.000001- 0.000001-0.0001 0.00001- 0.00001- 0.0001-0.001-
0.001-
0.0001 Transcription Factor Transcription FactorsFigure 3.8: The top enriched UCSC Transcription Factor Binding Site gene sets from DAVID using the differentially regulated probe sets from cluster 1(left), 2(middle), and 4(right). Cluster
1 contains all the significantly downregulated genes.
3.3
Differential gene expression analysis identifies NF-Y
as a common upstream factor
In identifying which genes and/or transcription factors were causal and which were not, we looked at the temporal nature of transcriptional activation. Notably, the timing of up and down regulation do not coincide: downregulation of mitotic cycle genes steadily occurs from the beginning of BCNU treatment (Figure 3.1), whereas upregulation experiences a sharp increase at the 12-24 hour mark (Figure 3.7).
In looking at the transcription factor binding sites of the up and downregulated genes, we aim to identify the regulatory factors that respond to DNA damage, based on the target genes which represent the functional response signature. Both NF-Y and p53 binding sites are over-enriched in the differentially expressed genes (Methods, Figure 3.8). Specifically, NF-Y is over-enriched in the downregulated cluster and p53 is over-enriched in the upregulated clusters. I further confirmed NF-Y association with differentially expressed genes with another transcription factor profiling tool, PANTHER [38]. Both tools utilize the same database of curated gene sets, but have slightly different methods for determining significance and ranking.
Combined with the gene ontology results, we predict that insufficient DNA damage repair mechanisms result in cell cycle arrest leading to more apoptosis in the sensitive cell lines. We propose that this phenotype is a result of a decrease in NF-Y activity, allowing p53 pro-apoptotic
3.3. Differential gene expression analysis identifies NF-Y as a common upstream factor 29
CELL SURVIVAL APOPTOSIS
Pro-apoptotic Anti-apoptotic Pro-apoptotic Anti-apoptotic genes genes genes genes
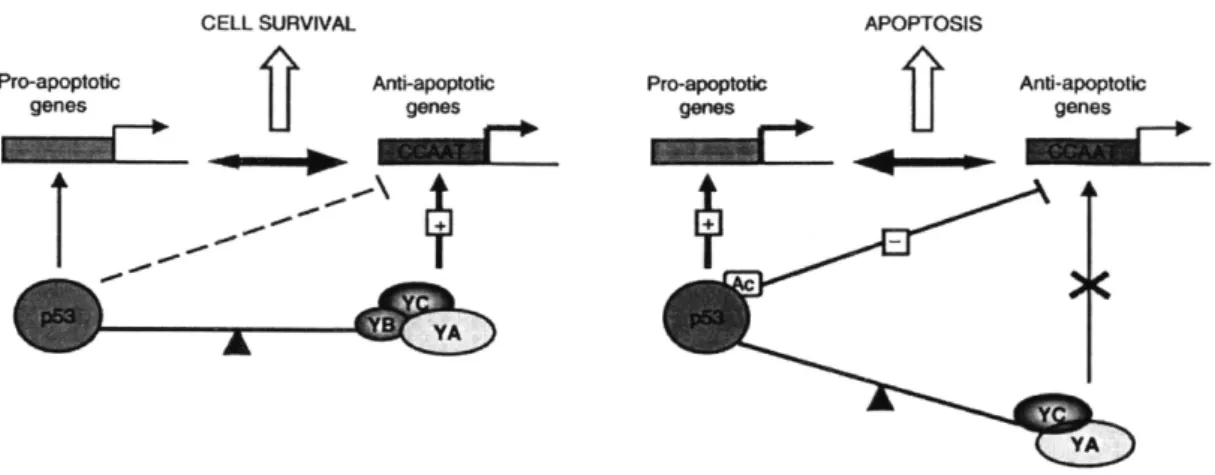
Figure 3.9: Proposed mechanism for NF-Y and p53 interaction in Benatti et al., 2008, Figure
9.
genes to successfully trigger apoptosis and cell cycle arrest genes to prevent progression to G2.
p53 has been hypothesized to interact with NF-Y in a balancing act to tip the cell towards
either repair or apoptosis [42](Figure 3.9, from Benatti et al. 2008). Two of the most highly expressed genes in the p53 network are PLK2 and MDM2, both p53 targets [43]. MDM2 inhibits p53 in a feedback loop that further decreases transcription expression of p53 regulated genes after 24-48 hours. On the basis of our model that downregulated genes are predictive of BCNU-induced changes in gene expression, we identified nuclear transcription factor NF-Y as a vital upstream regulator with differing activity between the sensitive and resistant cell lines. Using known network interactions, we can trace the activation of p53 through the activation and repression of genes in its network (Figure 3.10). We see that putative p53 inhibitor MDM2 is heavily repressed in cell line 4 after treatment. Therefore, we can infer that p53 activity increases. However, we also see that SCP increases in activity, suggesting that factors regulated
by p53 may be repressed. NF-Y can act as both an activator and repressor [52]. With a short
binding motif of CCAAT [53], NF-Y regulates and often co-regulates [54] a large number of genes. Although there is less known about the interaction network of NF-Y, we confirm that putative targets CCNB1 [40] and CCNB2 [41] are significantly transcriptionally downregulated. As CCNB1 and CCNB2 have been shown to be activated by NF-Y, this suggests downregulation of NF-Y activity. To confirm NF-Y occupancy of the downregulated genes in the sensitive
Cell Cycle: G1S Checkpoirt Regulation NS R JFOMDM2 UV Siress Respotm Li1 ABP1 A DP-1 2 ADP mediate p53 ulkylon s &Cycb&-few Rb-ependen refesionof E2Fqmedlaled tranclpkmo
Figure 3.10: Network of proteins and interacting partners associated with the p53 G1/S cell cycle checkpoint, colored by expression in cell line 4 (sensitive) after treatment. Green indicates the gene was upregulated, and red indicates downregulated. Purple circles indicate protein complexes. Nodes with no color indicate that no statistically significant difference was measured between treatment and control. Note that levels of p53 did not change much transcriptionally, so we must infer p53 activity through its related genes.
3.3. Differential gene expression analysis identifies NF-Y as a common upstream factor 31
NFYA
* Cell line 4 ~-Cell line 5
-U- Cell line 13
-- Cell lne 16 NFYC 62 1 0.3- 0.2- 0.1- -0.1- -0.2-
-0.3-I
Figure 3.11: Quantification of the expression values of the probes measuring NF-Y factor expression. Expression values represent the log(fold change) of the NF-Y trimeric factors, where each line in the plot represents one of the four cell lines after treatment with BCNU. Standard deviations are indicated by the error bars. NF-YA and NF-YC were each measured
by four probes, and NF-YB by three probes. There was no significant transcriptional change.
The fold-change and expression pattern over time is not significant (p-value 0.25).
cell line before treatment, ChIP-seq was performed on cell line 4, confirming that NF-Y was significantly bound to 25 of the 54 NF-Y targets among the transcriptionally downregulated genes. This balance of activation due to DNA damage and repression from internal cellular response is in alignment with our hypothesis that NF-Y anti-apoptotic activity stalls in favor of the apoptotic phenotype induced by DNA damage.
When we combine the balance between p53 and NF-Y activity hypothesized in Benatti et al. (2008) [42] and further assay experiments performed by Chandni Valiathan (as detailed in Figure 1.1), we can infer that p53 in the sensitive cell lines drives up apoptotic genes and down-regulates genes responsible for proliferation usually upregulated by NF-Y, and that this would lead to apoptosis. We predict that differences in protein level of the NF-Y complex between
0.2-20 so -0.2-NFYB 0.2-.0 - 40 60 80 -0.2-H U I _i6 8'
sensitive and resistant cell lines play a role in the different sensitivities between individual cell lines to DNA damage. While our data is mostly consistent with the model proposed by Benatti et al., a major regulatory difference is the absence of direct p53 interaction with NF-Y genes in response to DNA damage. Benatti et al. proposes a mechanism of regulation in which p53 and NF-Y regulate the same genes, and the competing regulatory signal is responsible for the cellular response phenotype. However, using Homer's motif finder [29] on ChIP-seq data from cell line 4, we see that there is no enrichment for p53 responsive genes in the genes bound by NF-Y before treatment. Thus, our results identify a mechanistic inaccuracy in the Benatti et al. model of p53 and NF-Y behavior, revealing that the direct targets of NF-Y and p53 are not the same.
3.4
NF-Y binding differs between sensitive and resistant
cell lines
Since transcriptional levels of NF-Y demonstrate no significant change over time (Figure 3.8), we tested for differences in protein level expression in the sensitive and resistant cell lines, as it is possible that post-transcriptional changes, different between sensitive and resistant cell lines, were the primary differential regulatory factor of NF-Y activity as opposed to pre-transcriptional differences between the sensitive and resistant cell lines. Western analysis for
NF-YA demonstrated no significant difference in NF-YA expression between cell lines 4 and 13, treated or untreated over six timepoints (Figure 3.6). We conclude that the patterns of
transcriptional response of the NF-Y factors accurately represent the protein levels as well. In other words, both the mRNA and protein levels of NF-Y also do not change significantly after treatment with BCNU in all four cell lines. Thus, the difference between behavior of NF-Y in the sensitive and resistant cell lines is a result of either protein-level modifications or differential regulation (inhibition or activation) of available transcription factor binding sites in the different cell lines.
3.5. SupplementaryFi~tircs 8~I3 Oh 4h 8h 12h 24h Beta actin NFYA Beta actin NFYA
Figure 3.12: Western analysis for cell lines 4(top) and 13(bottom) at various times after 40 pM
BCNU treatment probed with antibodies against NF-YA and beta actin(loading control).
versus resistant cell lines are in progress.
3.5
Supplementary Figures
- + + - + Cell line 4 (sensitive) Cell line 13 (resistant) 48h + - + 3.5. Supplementary Figures 33Treated vs. untreated for cluster 4 in cell line 5 Untreated 0.20 - -Treated 0150.05 -.C 010 U -0 00 -0 010 4 8 12 24 36 48 72 Hours
Treated vs. untreated for cluster 3 in cell line 5
06-04, 0.0 --0.2, - Uretated - Treated 4 8 12 24 36 48 72 Hours 10 a05 U 1100
o0--005
CM-0.10 -j -015 0-4 0.3 =C 0.2 U 4- 00V-0 -j-0.1Treated vs. untreated for cluster I in cell line 5
- treated
- Treated
4 8 12 24 36 48 72
Hours
Treated vs. untreated for cluster 2 in cell line 5
4 8 12 24 36 48 72
Hours
Figure 3.13: Quantification of the time-course response in cell line 5 after treatment with DNA damaging agent BCNU. The expression values shown represent averaged behavior over time of the probe sets in each of the four clusters from k-means clustering. Expression values from
BCNU treated samples are indicated in red, DMSO treated samples in blue. Standard deviation
is indicated by the error bars. Grey bars indicate standard deviation for the untreated samples, black bars for the treated samples.
'U -0 -J Untreated Treated L
Chapter 4
Conclusion
4.1
Discussion
O(6)-methylguanine-DNA-methyltransferase (MGMT) is a DNA repair protein that repairs
DNA lesions caused by alkylation damage [44]. It was previously shown that MGMT levels
impact BCNU resistance; specifically, resistance to BCNU due to increased activity of MGMT has been characterized in vitro [45]. When MGMT is active, lesions caused by alkylation are repaired before replication, preventing activation of apoptotic pathways due to strand breaks [44]. It has been shown that silencing of MGMT improves tumor treatment by increasing the sensitivity of tumor cells to DNA alkylation by chemotherapeutics [45].
However, transcriptional levels of MGMT go up in the sensitive cell lines after treatment, but not in the resistant cell lines. A plausible explanation is that MGMT expression increases in response to DNA damage in the sensitive cell lines, but does so in a way that does not facilitate cell survival, or is less effective, and the causal factors relevant for the decision between apoptosis and cell cycle arrest happens upstream of the MGMT repair mechanism. Alternatively, it has been shown that the protien and transcript levels of MGMT do not correlated well [47], and that there may exist mechanisms of MGMT post-transcriptional regulation; such a mechanism may mean that the high levels of MGMT mRNA we observe could still mean low MGMT protein activity.
Trimeric factor NF-Y has been shown to regulate a variety of genes and cell functions [48, 49]. The CCAAT binding motif recognized by NF-YA appears in over 30% of human gene promoter regions [51] and NF-Y may play a role in the recognition and transition of target genes from closed chromatin states [50). NF-Y has also been found to play very different roles depending on binding of co-activators [52, 54]. And very recently, NF-Y has been shown to play a critical role in the fidelity of transcription initiation [55], which is aligned with our hypothesis that the general downregulation of NF-Y regulated genes is related to a difference in NF-Y binding between sensitive and resistant cell lines.
The post-transcriptional difference in NF-Y activity between sensitive and resistant cell lines could also be attributed to alternative splicing, which we did not explore. It is possible that alternative splicing of the NF-Y factors affects binding to various degrees in different cell lines. It is also possible that the nucleosome configuration of the CCAAT binding motif in certain individuals greatly change NF-Y's ability to affect the chromatin accessibility. Given that NF-Y regulates specific histone methylation sites, such as H3K4, we can extrapolate that methylation markers can predict interindividual differences in drug response, particularly those drugs which make use of the DNA damage and repair pathways. Indeed, specific studies [56, 57] already demonstrate the role DNA methylation status plays in modulating cellular response, and H3K4 methylation at the site of a gene is strongly correlated with increased gene activity [58]. Another aspect of consideration in our experiment deisgn and results is that while the Coriell cell lines come from ethnically diverse people, it is possible that the process of immortalizing the cells introduces variation. As a result, differences between cell lines may reflect the result of EBV transformation instead of or in addition to differences between individuals.
In order to fully determine if NF-Y activity can be used as a predictor of individual response to DNA alkylation damage, more research is required. Analysis of basal transcriptome data of the 24 cell lines from Fry et al,. 2008 [21] and its correlation to BCNU sensitivity did not demonstrate a connection to the NF-Y pathway or p53 pathway. As such, the transcriptional levels of NF-Y and p53 and their targets are likely not reliably predictive of sensitivity to
NF-Y activity by assaying binding, using ChIP-seq on a wide variety of cell lines for NF-Y binding, accompanied by the proliferation assay described in Valiathan et al., 2011 [19]. We have demonstrated that it could prove clinically valuable to perform this investigation, as it may result in clinically applicable insights on the off-target effects of DNA alkyation damage-based treatments.
We combined broad, multi-variable transcription level data with existing gene regulatory net-work knowledge to construct a genetic model for the phenotypes we observed from different human lymphoblast cell lines. We demonstrated that sensitive cell lines produce a more dra-matic transcriptional response related to differences between the sensitive and resistant lines in apoptotic and cell cycle arrest behavior. Cell lines demonstrated a dramatic response at the 12-24 hour timepoint. We observed that a significant number of NF-Y target genes were down-regulated, and a significant number of p53 target genes were upregulated. Significant differen-tially expressed genes were enriched for cell cycle and apoptotic mechanisms. We hypothesize that the interplay between p53 and NF-Y may be different between different individuals. As such, relative activity of p53 and NF-Y may play a vital part in response to DNA alkylation damage. Our results suggest that NF-Y should be involved in further research in increasing tumor sensitivity to alkylation damage and reducing off-target effects in healthy cell lines.
[1] Clancy, S. (2008) DNA damage repair: mechanisms for maintaining DNA integrity. Nature
Education 1(1):103
[2] Su, Zhenyi et al. Apoptosis, autophagy, necroptosis, and cancer metastasis. Molecular cancer vol. 14 48. 21 Feb. 2015, doi:10.1186/s12943-015-0321-5
[3] Woods, Derek, and John J Turchi. Chemotherapy induced DNA damage response:
con-vergence of drugs and pathways. Cancer biology therapy vol. 14,5 (2013): 379-89.
doi:10.4161/cbt.23761
[4] Nagel, Zachary D et al. Inter-individual variation in DNA repair capacity: a need for multi-pathway functional assays to promote translational DNA repair research. DNA repair vol.
19 (2014): 199-213. doi:10.1016/j.dnarep.2014.03.009.
[5] Slyskova J, Lorenzo Y, Karlsen A, Carlsen MH, Novosadova V, Blomhoff R, Vodicka P,
Collins AR. Both genetic and dietary factors underlie individual differences in DNA damage levels and DNA repair capacity. DNA Repair (Amst) 2014;16:6673.
[6] Beljanski et al. DNA damage-processing pathways involved in the eukaryotic cellular
re-sponse to anticancer DNA cross-linking drugs. Mol Pharmacol. 2004 Jun;65(6):1496-506.
[7] Salehan MR, Morse HR. DNA damage repair and tolerance: a role in chemotherapeutic
drug resistance. Br J Biomed Sci. 2013;70:3140. doi: 10.1080/09674845.2013.11669927.
[8] Lagerwerf S, Vrouwe MG, Overmeer RM, Fousteri MI, Mullenders LH. DNA damage
re-sponse and transcription. DNA Repair (Amst) 2011;10:74350.
BIBLIOGRAPHY
[9] Zhou T, Chou J, Mullen TE, et al. Identification of primary transcriptional regulation of
cell cycle-regulated genes upon DNA damage. Cell Cycle. 2007;6(8):972-81.
[10] Jelinsky, S A, and L D Samson. Global response of Saccharomyces cerevisiae to an
alkylat-ing agent. Proceedalkylat-ings of the National Academy of Sciences of the United States of America vol. 96,4 (1999): 1486-91. doi:10.1073/pnas.96.4.1486
[11] Bandyopadhyay, Sourav et al. Rewiring of genetic networks in response to DNA damage.
Science (New York, N.Y.) vol. 330,6009 (2010): 1385-9. doi:10.1126/science.1195618 [12] Zachary D. Nagel, Gaspar J. Kitange, Shiv K. Gupta, Brian A. Joughin, Isaac A. Chaim,
Patrizia Mazzucato, Douglas A. Lauffenburger, Jann N. Sarkaria and Leona D. Samson.
DNA Repair Capacity in Multiple Pathways Predicts Chemoresistance in Glioblastoma
Multiforme. Cancer Res January 1 2017 (77) (1) 198-206; DOI:
10.1158/0008-5472.CAN-16-1151
[13] Rocha, Clarissa Ribeiro Reily et al. DNA repair pathways and cisplatin resistance: an
intimate relationship. Clinics (Sao Paulo, Brazil) vol. 73,suppl 1 e478s. 6 Sep. 2018, doi:10.6061/cinics/2018/e478s
[14] Tong, W. P.; Ludlum, D. B.Biochem. Pharmacol.1979,28,11751179.
[15] Nagpal S. The role of BCNU polymer wafers (Gliadel) in the treatment of malignant
glioma. Neurosurg Clin N Am. 2012;23(2):289295.
[16] Bota, Daniela A et al. Interstitial chemotherapy with biodegradable BCNU (Gliadel) wafers
in the treatment of malignant gliomas. Therapeutics and clinical risk management vol. 3,5
(2007): 707-15.
[17] Jungk, Christine et al. Chemotherapy with BCNU in recurrent glioma: Analysis of clinical
outcome and side effects in chemotherapy-nave patients. BMC cancer vol. 16 81. 10 Feb.
2016, doi:10.1186/s12885-016-2131-6
[18] Drablos F, Feyzi E, Aas PA, et al. Alkylation damage in DNA and RNA repair mechanisms
and medical significance. DNA Repair Amst. 2004;3:1389407.
[19] Valiathan C, McFaline JL, Samson LD. A rapid survival assay to measure drug-induced
cytotoxicity and cell cycle effects. DNA Repair. 2012;11(1):928.
[20] Valiathan, Chandni. Identifying a transcriptional signature for cell sensitivity to the cancer chemotherapy agent, BCNU. 2011. http://hdl.handle.net/1721.1/65773
[21] Fry RC, Svensson JP, Valiathan C, et al. Genomic predictors of interindividual differences in response to DNA damaging agents. Genes Dev. 2008;22(19):2621-6.
[22] Gautier L, Cope L, Bolstad BM, Irizarry RA (2004). affy - analysis of Affymetrix GeneChip data at the probe level. Bioinformatics, 20(3), 307315. ISSN 1367-4803, doi: 10.1093/bioin-formatics/btg4O5.
[23] John D. Hunter. Matplotlib: A 2D Graphics Environment, Computing in Science and
Engineering, 9, 90-95 (2007), DOI:10.1109/MCSE.2007.55.
[24] Seabold, Skipper, and Josef Perktold. Statsmodels: Econometric and statistical modeling with python. Proceedings of the 9th Python in Science Conference. 2010.
[25] Jones E, Oliphant E, Peterson P, et al. SciPy: Open Source Scientific Tools for Python, 2001-, http://www.scipy.org/ [Online; accessed 2018-12-20].
[26] Pedregosa et al. Scikit-learn: Machine Learning in Python, Journal of Machine Learning
Research, 12, 2825-2830 (2011)
[27] Huang DW, Sherman BT, Lempicki RA. Systematic and integrative analysis of large gene
lists using DAVID Bioinformatics Resources. Nature Protoc. 2009;4(1):44-57.
[28] Huang DW, Sherman BT, Lempicki RA. Bioinformatics enrichment tools: paths toward
the comprehensive functional analysis of large gene lists. Nucleic Acids Res. 2009;37(1):1-13.
[29] Heinz S, Benner C, Spann N, Bertolino E et al. Simple Combinations of
Lineage-Determining Transcription Factors Prime cis-Regulatory Elements Required for Macrophage and B Cell Identities. Mol Cell 2010 May 28;38(4):576-589.
![Figure 1.2: Data from Valiathan et al. [19] showing vastly differential survival responses to BCNU treatment in 24 Coriell cell lines, which come from unique individuals with varied ethnicity](https://thumb-eu.123doks.com/thumbv2/123doknet/14431407.515246/14.917.138.745.248.790/valiathan-differential-survival-responses-treatment-coriell-individuals-ethnicity.webp)