HAL Id: hal-02636994
https://hal.inrae.fr/hal-02636994
Submitted on 27 May 2020
HAL is a multi-disciplinary open access archive for the deposit and dissemination of sci-entific research documents, whether they are pub-lished or not. The documents may come from teaching and research institutions in France or abroad, or from public or private research centers.
L’archive ouverte pluridisciplinaire HAL, est destinée au dépôt et à la diffusion de documents scientifiques de niveau recherche, publiés ou non, émanant des établissements d’enseignement et de recherche français ou étrangers, des laboratoires publics ou privés.
Distributed under a Creative Commons Attribution - NonCommercial| 4.0 International
Weight for gestational age and metabolically healthy
obesity in adults from the Haguenau cohort
Joane Matta, Claire Carette, Claire Levy Marchal, Julien Bertrand, Mélanie
Petera, Marie Zins, Estelle Pujos-Guillot, Blandine Comte, Sébastien
Czernichow
To cite this version:
Joane Matta, Claire Carette, Claire Levy Marchal, Julien Bertrand, Mélanie Petera, et al.. Weight for gestational age and metabolically healthy obesity in adults from the Haguenau cohort. BMJ Open, BMJ Publishing Group, 2016, 6 (8), pp.e011367. �10.1136/bmjopen-2016-011367�. �hal-02636994�
Weight for gestational age and
metabolically healthy obesity in adults
from the Haguenau cohort
Joane Matta,1Claire Carette,2Claire Levy Marchal,3Julien Bertrand,4,5 Mélanie Pétéra,4,5Marie Zins,1,6Estelle Pujos-Guillot,4,5Blandine Comte,4,5 Sébastien Czernichow1,2,6
To cite: Matta J, Carette C, Levy Marchal C,et al. Weight for gestational age and metabolically healthy obesity in adults from the Haguenau cohort.BMJ Open 2016;6: e011367. doi:10.1136/ bmjopen-2016-011367
▸ Prepublication history and additional material is available. To view please visit the journal (http://dx.doi.org/ 10.1136/bmjopen-2016-011367).
Received 1 February 2016 Revised 9 March 2016 Accepted 31 March 2016
For numbered affiliations see end of article. Correspondence to Professor Sébastien Czernichow; sebastien. czernichow@aphp.fr ABSTRACT
Background:An obesity subphenotype, named ‘metabolically healthy obese’ (MHO) has been recently defined to characterise a subgroup of obese individuals with less risk for cardiometabolic abnormalities. To date no data are available on participants born with small weight for gestational age (SGA) and the risk of metabolically unhealthy obesity (MUHO).
Objective:Assess the risk of MUHO in SGA versus appropriate for gestational age (AGA) adult participants.
Methods:129 young obese individuals (body mass index≥30 kg/m²) from data of an 8-year follow-up Haguenau cohort (France), were identified out of 1308 participants and were divided into 2 groups: SGA (n=72) and AGA (n=57). Metabolic characteristics were analysed and compared using unpaired t-test. The HOMA-IR index was determined for the population and divided into quartiles. Obese participants within the first 3 quartiles were considered as MHO and those in the fourth quartile as MUHO. Relative risks (RRs) and 95% CI for being MUHO in SGA versus AGA participants were computed.
Results:The SGA-obese group had a higher risk of MUHO versus the AGA-obese group: RR=1.27 (95% CI 1.10 to 1.6) independently of age and sex.
Conclusions:In case of obesity, SGA might confer a higher risk of MUHO compared with AGA.
INTRODUCTION
Obesity is a condition frequently accompan-ied by adverse metabolic outcomes such as hypertension,1–3insulin resistance (IR), type 2 diabetes4and dyslipidaemia among others.5 6 However, studies have shown that not all obese individuals display such cardiometabolic abnormalities and a metabolically healthy obese (MHO) phenotype versus a metabolic-ally unhealthy obese (MUHO)7–9 phenotype has been described.
Some studies showed that, unlike MUHO people, MHO particiapnts are not at increased risk of metabolic complications
and some studies10–12 but not all,13 14 indi-cate that they do not show evidence of increased risk of type 2 diabetes, of cardiovas-cular diseases or even of mortality when com-pared with metabolically healthy normal weight individuals. The discrepancy in the results seen in different studies might stem from the absence of a precise definition of MHO which varies among studies.9 Why some obese participants can benefit from MHO phenotype is still unclear, but some reasons such as greater metabolic reserve, fitness, increased muscle mass and strength have been proposed.15
Low birth weight and smallness for gesta-tional age (SGA) have both been associated with later higher susceptibility for develop-ment of impaired metabolic phenotype such as obesity, hypertension, IR, as well as type 2 diabetes in adulthood. This has been well documented in several studies, raising pri-marily nutritional inadequacies during fetal and early life.16–20
Data from the Haguenau cohort showed that participants born SGA have a sixfold
Strengths and limitations of this study
▪ Homogeneous population.
▪ High participation rate which reduces selection bias between appropriate for gestational age (AGA) and small weight for gestational age (SGA).
▪ Participants have completed pubertal develop-ment and are not at an advanced age to con-found insulin resistance development.
▪ First study to evaluate risk of metabolically unhealthy obesity in obese young adults born SGA versus those born AGA.
▪ Small subgroup of the population and thus might have not had enough power to detect sig-nificant differences with regard to metabolic variables.
increase in metabolic syndrome development at the age of 22 when compared with individuals born with appro-priate weight for gestational age (AGA).21
To the best of our knowledge, there are no data available comparing metabolic outcomes of obese adults born SGA with obese adults born AGA nor on the risk of a metabolic-ally unhealthy phenotype in the obese SGA population. We hypothesise that since SGA individuals tend to exhibit more unfavourable metabolic outcomes in adulthood, they would also not benefit from a MHO phenotype in case of obesity. On the other hand, obese AGA individuals would have a higher favourable risk of evolution towards MHO in comparison to their SGA counterparts. The objective of this study was to assess the risk of MUHO in obese SGA versus AGA individuals in the French Haguenau cohort. One of the most important interests of the Haguenau cohort is that the recruited participants are young adults who have completed body development. Studying a group of young obese adults could avoid the presence of con-founding metabolic or non-metabolic factors that would be present in the case of obesity at an older age.
METHODS Study population
Data were drawn from the Haguenau cohort, a community-based cohort derived from a maternity regis-try of the metropolitan area of the city of Haguenau (France) with the purpose of investigating the long-term consequences of being born SGA.22 Briefly, the registry included information about all pregnancies and deliver-ies occurring at the Haguenau maternity hospital from 1971 to 1985 with 80% degree of completeness.
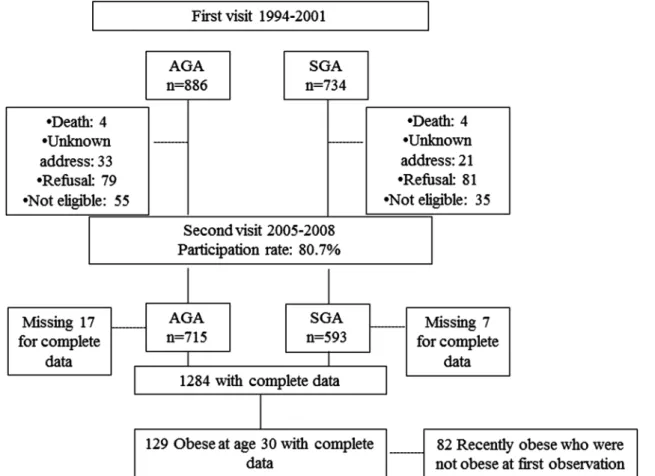
SGA and AGA individuals were all singleton births and born between 32 and 42 weeks of gestation. SGA were individuals born with body weight <10th centile with respect to local standard growth curves, and AGA indivi-duals were born between the 25th and the 75th centiles for sex and gestational age and were selected as the next full-term singleton after the selection of a SGA individ-ual.23 Data in the Haguenau cohort were drawn at two time points. The first visit took place when singletons were on average 22 years of age, and participants who agreed to participate were 886 AGA individuals and 734 SGA.21 The second visit was conducted between April 2005 and December 2008 with a participation rate of 80.7%. A total of 1308 participants thus agreed to partici-pate (593 SGA and 715 AGA) in the cohort. Sensitivity analyses of the missing participants at follow-up (1308 vs 1620) did not disclose any important differences and detailed description about it is available elsewhere.23
For the purpose of this analysis, only obese SGA and AGA individuals at the second visit, when they were on average 30 years old, were included (figure 123).
Measurement strategy: Details about measurements are available in a previous paper.23
Anthropometrics: Weight was measured with a portable scale and height with a wall-mounted stadiometer.
Participants attended two visits at the municipal hospital of Haguenau and the same nurses recorded the height and information. Weight for height was assessed as body mass index (BMI; kg/m2) and categorised using the WHO clas-sification: underweight <18.5 kg/m2; normal weight 18.5– 24.9 kg/m2; overweight 25–29.9 kg/m2and obese≥30 kg/ m2. One hundred and thirty-two obese individuals (74 SGA and 58 AGA) were thus identified and 129 (69 women and 60 men) with complete data set were included in the analyses (figure 1). Data for waist circumference and percentage of body fat mass were available but not included in the analyses for multicollinearity purposes.
MHO phenotype was determined using the HOMA-IR index for the whole population and using the following formula: (insulin (μU/mL)×glucose (mmol)/22.5). The HOMA-IR index relies on fasting glucose and insulin with higher scores signifying greater IR. Participants were classified as MHO if they belonged to the three first lower quartiles of this index and had a BMI≥30.24
Metabolic variables: Data on fasting serum lipids such as total cholesterol, high-density lipoprotein cholesterol (HDL-c), triglyceride and also on plasma glucose and insulin concentration were available and details are included elsewhere.23 Blood samples were collected after an overnight fast for the measurement of serum lipids, plasma glucose and serum insulin concentrations and at the same time of anthropometric measurements. Laboratory procedures, plasma glucose, total cholesterol, HDL-c and triacylglycerol concentrations were measured with enzymatic methods. Serum insulin concentrations were measured using an immunoradiometric method (Bi-insulin IRMA; Cisbio International, Gif-sur-Yvette, France). Cross-reactivity with intact proinsulin and des-31, 32 proinsulin was <1%. The detection limit was 3.0 pmol/L and interassay CV was <6.5%. Blood pressure was measured in the right arm of seated individuals after a 30 min rest, using an automated device (Dinamap; Critikon, Neuilly-Plaisance, France) and a cuff of recom-mended size for the mid-upper arm circumference. Three measurements were made at 1 min intervals and the average of the last two measurements was used in the analysis. All data from blood samples were collected at the same time of anthropometric measurements.
Covariates: Age and sex were determined using the baseline questionnaire. Level of education was used as a proxy for socioeconomic status. Physical activity was assessed as number of hours of physical activity per week.
All participants gave written consent.
Statistical analyses
Descriptive statistics were performed to provide character-istics of the obese SGA-born versus obese AGA-born and are presented as means±SD or percentages as appropriate. A general linear model controlling for age and sex was performed in order to explore the differences in meta-bolic variables of obese SGA versus AGA individuals. Residual distributions were checked for normality. To
determine the relative risk (RR) of MUHO in SGA-obese versus AGA-obese individuals, the SAS Genmod procedure adjusting for age and sex was used. We chose to adjust for age and sex since they were both significant in the models for most of the metabolic variables.
All tests were two-tailed and p<0.05 was considered sig-nificant. All analyses were undertaken using SAS V.9.3 software (SAS, Cary, North Carolina, USA).
RESULTS
Clinical characteristics of the study population at birth were previously described in detail.22 23 Briefly, indivi-duals were all born full term and sex distribution did not differ between the AGA and SGA groups. According to the selection criteria, individuals born SGA were lighter (2627±296 vs 3366±274 g), shorter (47.7±2 vs 50.3±1 cm) and thinner (11.6±1.1 vs 13.3±0.8 kg/m2) at birth than individuals born AGA.
Obese AGA-born and SGA-born were similar with regard to age and sex (table 1). No significant differ-ence was observed for physical activity between obese AGA-born and SGA-born individuals.
Significant differences were seen for fasting HDL-c and insulin levels in obese AGA-born versus obese SGA-born, but they disappeared after adjustment for age and sex. Table 2 presents results as a function of HOMA-IR quartiles for obese AGA-born and SGA-born. Quartiles 1, 2 and 3 (Q1, Q2 and Q3) are considered
metabolically healthy versus quartile 4 (Q4) considered metabolically unhealthy.
A significant difference was observed for Q1–Q3 versus Q4 for fasting insulin, glucose and HOMA-IR in both obese SGA-born and AGA-born (Q4 having a higher fasting insulin and glucose levels vs Q1–Q3). However, when comparing MHO-SGA-born (Q1–Q3) versus MHO-AGA-born (Q1–Q3), no significant differ-ences were observed except for fasting insulin which was higher in MHO-AGA-born (Q1–Q3).
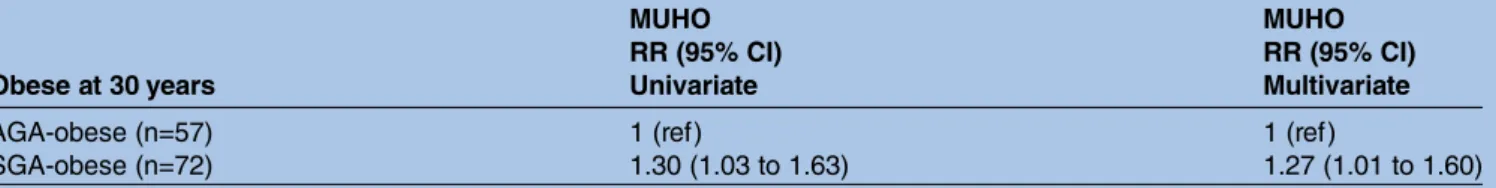
Table 3 presents the univariate-adjusted and multivariate-adjusted RRs for MUHO risk in the SGA-born versus AGA-born category. Independently of sex and age, individuals who were obese at the age of 30 and born SGA had an increased risk of MUHO when compared with obese individuals born AGA (RR=1.27; 95% CI 1.01 to 1.6). In a second set of analyses, we also entered socioeconomic status and physical activity in our model as covariates; we still obtained the same results (significantly higher risk of SGA for MUHO; data shown as online supplementary data).
DISCUSSION
The present study showed that the risk of belonging to the metabolically unhealthy phenotype was highest among young obese adults born SGA compared with their counterparts born AGA.
Table 1 Obese AGA and SGA characteristics
Obese AGA Obese SGA p Value*
N (%) 57 (4.4) 72 (5.6)
Age, years 29.3 (4.3) 30.6 (3.7) 0.10
Male, per cent 45.6 47.2 0.72
Socioeconomic status: high level of education, per cent
31.0 24.3 0.26
Weight, kg 100.6 (15.5) 97.3 (14.7) 0.17
BMI, height/m2 34.4 (4.8) 34.7 (5.0) 0.80
Waist circumference, cm 107.1 (14.2) 108.0 (12.4) 0.73
Body fat, per cent 35.0 (8.7) 34.7 (9.7) 0.73
Physical activity, hours/week 1.0 (1.7) 0.9 (1.9) 0.06
Systolic blood pressure, mm Hg 125.1 (12.4) 125.0 (13.1) 0.99 Diastolic blood pressure, mm Hg 76.4 (8.8) 74.1 (9.5) 0.14
Total cholesterol, mM 5.0 (0.8) 5.2 (1.0) 0.19; 0.40
HDL-cholesterol, mM 1.2 (0.3) 1.0 (0.2) 0.03; 0.07
Triglycerides, Mm 1.4 (1.0) 1.7 (1.5) 0.26; 0.39
Fasting glucose, g/L 0.91 (0.08) 0.91 (0.08) 0.94; 0.65
Fasting insulin, mIU/L 9.4 (3.8) 11.0 (4.5) 0.04; 0.07
HOMA-IR 2.1 (0.9) 2.5 (1.0) 0.05; 0.08
Values are mean (SD) unless otherwise indicated.
*p Values comparing obese AGA versus obese SGA; the second p values are further adjusted for age and sex for comparison of metabolic variables.
AGA, appropriate for gestational age; BMI, body mass index; HDL, high-density lipoprotein; SGA, small for gestational age.
Table 2 Comparison of metabolic variables in quartiles of HOMA-IR in selected obese AGA and SGA participants at the second visit
AGA SGA
Q1–Q3: MHO Q4 p Value Q1–Q3: MHO Q4 p Value p1Value Age (years) 28.7 (4.0) 29.6 (4.5) 0.45 30.4 (4.7) 30.6 (4.0) 0.87 0.26
Male, per cent 33.3 52.7 0.48 38.4 50 0.44 0.76
Fasting glucose, g/L 0.8 (0.08) 0.9 (0.08) <0.0001 0.8 (0.04) 0.9 (0.08) <0.0001 1.0 Fasting insulin, mIU/L 6.2 (1.0) 11.3 (3.5) <0.0001 5.5 (0.8) 12.1 (4.1) <0.0001 0.04 HOMA-IR 1.3 (0.1) 2.6 (0.8) <0.0001 1.2 (0.2) 2.7 (0.9) <0.0001 0.06 Total cholesterol, mM 4.8 (0.8) 5.1 (0.8) 0.17 5.0 (0.8) 5.2 (1.07) 0.52 0.48 HDL-cholesterol, mM 1.2 (0.2) 1.2 (0.3) 1.0 1.2 (0.3) 1.2 (0.2) 1.0 1.0 Triglycerides, mM 1.2 (1.0) 1.5 (1.1) 0.30 1.0 (0.6) 1.8 (1.5) 0.06 0.52 Systolic BP, mm Hg 121.8 (9.5) 127.0 (13.7) 0.13 120.1 (8.8) 126.1 (13.8) 0.13 0.60 Diastolic BP, mm Hg 76.0 (6.4) 76.7 (10.2) 0.77 71.3 (6.8) 74.7 (10.0) 0.24 0.05
Values are mean (SD) unless otherwise indicated.
p Value next to each group corresponds to a t-test of Q1–Q3 versus Q4 in each group: SGA and AGA. p1Value corresponds to t-test for MHO-AGA versus MHO-SGA.
Each p value corresponds to an ANOVA test for each four quartiles.
MHO corresponds to Q1–Q3 in each subgroup (AGA-obese and SGA-obese).
AGA, appropriate for gestational age; ANOVA, analysis of variance; BP, blood pressure; HDL, high-density lipoprotein; MHO, metabolically healthy obese; Q, quartile; SGA, small for gestational age.
Table 3 Univariate-adjusted and multivariate-adjusted RRs for MUHO in obese SGA versus obese AGA categories MUHO
RR (95% CI)
MUHO RR (95% CI)
Obese at 30 years Univariate Multivariate
AGA-obese (n=57) 1 (ref) 1 (ref)
SGA-obese (n=72) 1.30 (1.03 to 1.63) 1.27 (1.01 to 1.60)
Multivariate analyses adjusted for age and sex.
AGA, appropriate for gestational age; MUHO, metabolically unhealthy obesity; RR, relative risk; SGA, small for gestational age.
A total of 66.3% of the population were of normal weight and 10% obese, which is less than the recently reported percentage of obesity (15%) among French adults.25 26
We only found a significant difference in fasting insulin while comparing MHO-SGA versus MHO-AGA showing that MHO-AGA might have a better metabolic health than MHO-SGA. No significant differences were observed for other characteristics. According to the cri-teria we have studied, only risk of belonging to the MUHO phenotype was statistically significant in SGA-obese versus AGA-obese, so more studies are needed to understand and identify this risk difference and complementary studies will better characterise these two phenotypes for a better preventive approach.
Previous results from the Haguenau cohort have shown that being born SGA is a significant contributor to the risk of metabolic syndrome and SGA individuals had higher levels of IR.21 This higher probability of developing the metabolic syndrome for SGA-born indivi-duals, could be related to both an increased weight gain (catch up process), and to fetal programming itself.27 The mechanisms underlying the favourable metabolic profile of MHO versus MUHO remain unclear. Epidemiological studies showed that obese individuals with no metabolic abnormalities and good level of fitness have a very good prognosis in long-term studies, even if MHO individuals sometimes showed a slightly higher risk of morbidities compared with healthy lean normal weight controls.9 26
The idea that some obese individuals develop cardio-metabolic complications but not others has been pro-posed by Vague28 several years ago. Since then, researchers have tried understanding what was differenti-ating the so-called MHO in contrast with metabolically unhealthy participants. A potential pathophysiological hypothesis has been suggested in a recent study29 where MHO individuals had a decreased capacity of adipose tissue to transport glucose. Conversion of carbohydrate precursors was associated with adverse effects on meta-bolic health which would lead to decreased insulin sensi-tivity and metabolic syndrome.29 Adiposity, which is reduced at birth in SGA infants, undergoes a catch-up growth process during infancy and might lead to a dis-proportionately high fat mass in relation to muscle mass which is in turn involved with higher IR. McLaughlin et al30 found that MUHO individuals have higher levels
of small adipose cells and decreased expression of differ-entiation markers, which could contribute in an unfavourable metabolic profile in MUHO individuals compared with MHO.
To the best of our knowledge, there is no published study comparing SGA-born and AGA-born individuals for metabolically healthy or unhealthy obesity. A study carried out on obese adolescents has shown that those who had high birth weight had higher adiponectin levels and increased insulin sensitivity compared with obese adolescents with low birth weight.31 Other data23
in the literature showed differences between SGA versus AGA for cardiovascular abnormalities later in life regard-less of BMI but not on the MUHO phenotype in case of obesity and after 8 years of inclusion. However, since several studies have shown that SGA individuals display unfavourable metabolic profiles when compared with AGA ones;23 the same explanations underlying the favourable metabolic profile in MHO participants from the general population could be used in the obese ones. The percentage of MHO in this study is 26%, which is in the range of what is usually found in other studies using different methods to assess metabolically healthy obesity.26 We are not aware of any study comparing MUHO phenotype in obese individuals by birth weight for gestational age. We used the HOMA-IR index to determine the metabolically unhealthy phenotype. The HOMA-IR index has been shown to be an efficient measure of health status in the obese population.26
The main strengths of the present study include the homogeneous population studied and the high participa-tion rate which reduces the risk of selecparticipa-tion bias between SGA-born and AGA-born adults. Individuals grew up at a time where nutritional conditions were optimal and uniform in the area of Haguenau. Besides, participants have completed their pubertal development and are not at an advanced age to confound IR development and dia-betes with ageing, making it a suitable population to answer our question. Furthermore, to the best of our knowledge, this is thefirst study that evaluated the risk of MUHO with regard to birth weight for gestational age; and the first study to highlight the importance of study-ing different phenotypes of at-risk populations. We adjusted for age and sex in order to minimise confound-ing bias. Moreover, further adjustment for physical activ-ity and socioeconomic status did not change the results.
Our study has however some limitations. We are using a small subgroup of the population and thus might have not had enough power to detect significant differences with regard to metabolic variables; still we were able to find a difference in the risk of MUHO in SGA versus AGA participants. Besides, we have used the HOMA-IR as a definition for the MHO phenotype, because of the lack of a standard definition for MHO, other ways of classifying MHO versus MUHO might lead to different interpretations. In summary, we have shown that young obese SGA-born individuals had a higher risk of belong-ing to the MUHO phenotype defined by the HOMA-IR index. Those findings are specific to this homogeneous population but can however be generalised to other young obese adults born SGA. The results from this study highlight the understanding of the importance of IR as a determinant for metabolically healthy obesity as well as the importance of preventing births that are SGA. In conclusion, SGA might confer a higher risk than AGA with regard to MUHO independently of age, sex, physical activity level and socioeconomic status. Further studies are needed to confirm our findings in different populations.
Author affiliations
1INSERM, UMS 011, Villejuif, France
2Nutrition Department, Hôpital Européen Georges-Pompidou, Paris, France 3INSERM CIE 05 - Unité d’épidémiologie clinique, Hôpital Robert Debré, Paris, France
4INRA, UMR 1019, UNH, CRNH Auvergne, F-63000 CLERMONT-FERRAND, France
5Clermont Université, Université d’Auvergne, Unité de Nutrition Humaine, BP 10448, F-63000 CLERMONT-FERRAND, France
6Paris Descartes University, Paris, France
AcknowledgementsThe authors express their thanks to all the participants of the Haguenau cohort, and all the members of the Haguenau cohort study team. The present study was funded by‘la Fondation Francophone pour la Recherche sur le Diabète’.
Contributors JM performed statistical analyses and drafted the manuscript. SC contributed to interpretation of results and revised the manuscript. CC, CLM, JB, MP, MZ, EP-G and BC edited and reviewed the manuscript. JM is the guarantor of this work and, as such, had full access to all the data in the study and takes responsibility for the integrity of the data and the accuracy of the data analysis.
Funding Fondation Francophone pour la Recherche sur le Diabète.
Competing interests None declared.
Patient consent Obtained.
Ethics approval The study protocol was reviewed and approved by the Ethical Committee of the Saint Louis Medical School at the Paris Diderot, University of Paris.
Provenance and peer review Not commissioned; externally peer reviewed.
Data sharing statement No additional data are available.
Open Access This is an Open Access article distributed in accordance with the Creative Commons Attribution Non Commercial (CC BY-NC 4.0) license, which permits others to distribute, remix, adapt, build upon this work non-commercially, and license their derivative works on different terms, provided the original work is properly cited and the use is non-commercial. See: http:// creativecommons.org/licenses/by-nc/4.0/
REFERENCES
1. Rahmouni K, Correia ML, Haynes WG, et al. Obesity-associated hypertension: new insights into mechanisms.Hypertension
2005;45:9–14.
2. Ying A, Arima H, Czernichow S, et al. Effects of blood pressure lowering on cardiovascular risk according to baseline body-mass index: a meta-analysis of randomised trials.Lancet
2015;385:867–74.
3. Czernichow S, Castetbon K, Salanave B, et al. Determinants of blood pressure treatment and control in obese people: evidence from the general population.J Hypertens2012;30:2338–44.
4. Eckel RH, Kahn R, Robertson RM, et al. Preventing cardiovascular disease and diabetes: a call to action from the American Diabetes Association and the American Heart Association.Circulation
2006;113:2943–6.
5. Adams KF, Schatzkin A, Harris TB, et al. Overweight, obesity, and mortality in a large prospective cohort of persons 50 to 71 years old.
N Engl J Med2006;355:763–78.
6. Hossain P, Kawar B, El Nahas M. Obesity and diabetes in the developing world—a growing challenge.N Engl J Med
2007;356:213–15.
7. Karelis AD, Faraj M, Bastard JP, et al. The metabolically healthy but obese individual presents a favorable inflammation profile.J Clin Endocrinol Metab2005;90:4145–50.
8. Karelis A, Brochu M, Rabasa-Lhoret R. Can we identify metabolically healthy but obese individuals (MHO)?Diabetes Metab2004;30:569–72. 9. Lavie CJ, De Schutter A, Milani RV. Healthy obese versus unhealthy
lean: the obesity paradox.Nat Rev Endocrinol2015;11:55–62. 10. Marini MA, Succurro E, Frontoni S, et al. Metabolically healthy but
obese women have an intermediate cardiovascular risk profile between healthy nonobese women and obese insulin-resistant women.Diabetes Care2007;30:2145–7.
11. Messier V, Karelis AD, Prud’homme D, et al. Identifying metabolically healthy but obese individuals in sedentary postmenopausal women.Obesity2010;18:911–17.
12. Primeau V, Coderre L, Karelis A, et al. Characterizing the profile of obese patients who are metabolically healthy.Int J Obes (Lond)
2011;35:971–81.
13. Hamer M, Stamatakis E. Metabolically healthy obesity and risk of all-cause and cardiovascular disease mortality.J Clin Endocrinol Metab2012;97:2482–8.
14. Calori G, Lattuada G, Piemonti L, et al. Prevalence, metabolic features, and prognosis of metabolically healthy obese Italian individuals the Cremona study.Diabetes Care2011;34:210–15. 15. Lavie CJ, Milani RV, Ventura HO. Disparate effects of metabolically
healthy obesity in coronary heart disease and heart failure.
J Am Coll Cardiol2014;63:1079–81.
16. Levy-Marchal C, Jaquet D. Long-term metabolic consequences of being born small for gestational age.Pediatr Diabetes
2004;5:147–53.
17. Levy-Marchal C, Czernichow P. Small for gestational age and the metabolic syndrome: which mechanism is suggested by
epidemiological and clinical studies?Hormone Res2005;65:123–30. 18. Barker DJ. The fetal and infant origins of disease.Eur J Clin Invest
1995;25:457–63.
19. Hales CN, Barker DJ. The thrifty phenotype hypothesis.Br Med Bull
2001;60:5–20.
20. de Arriba A, Domínguez M, Labarta J, et al. Metabolic syndrome and endothelial dysfunction in a population born small for gestational age relationship to growth and Gh therapy. Pediatr Endocrinol Rev 2012;10:297–307.
21. Jaquet D, Deghmoun S, Chevenne D, et al. Dynamic change in adiposity from fetal to postnatal life is involved in the metabolic syndrome associated with reduced fetal growth.Diabetologia
2005;48:849–55.
22. Papiernik E, Bouyer J, Dreyfus J, et al. Prevention of preterm births: a perinatal study in Haguenau, France. Pediatrics 1985;76:154–8.
23. Meas T, Deghmoun S, Alberti C, et al. Independent effects of weight gain and fetal programming on metabolic complications in adults born small for gestational age.Diabetologia2010;53:907–13. 24. Meigs JB, Wilson PW, Fox CS, et al. Body mass index, metabolic
syndrome, and risk of type 2 diabetes or cardiovascular disease.
J Clin Endocrinol Metab2006;91:2906–12.
25. Hinnouho G-M, Czernichow S, Dugravot A, et al. Metabolically healthy obesity and the risk of cardiovascular disease and type 2 diabetes: the Whitehall II cohort study.Eur Heart J2015;36:551–9. 26. Hinnouho GM, Czernichow S, Dugravot A, et al. Metabolically
healthy obesity and risk of mortality does the definition of metabolic health matter?Diabetes Care2013;36:2294–300.
27. Neel JV. Diabetes mellitus: a“thrifty” genotype rendered detrimental by“progress”? Am J Hum Genet 1962;14:353.
28. Vague J. The degree of masculine differentiation of obesities: a factor determining predisposition to diabetes, atherosclerosis, gout, and uric calculous disease. 1956.Obes Res1996;4:204–12. 29. Fabbrini E, Yoshino J, Yoshino M, et al. Metabolically normal obese
people are protected from adverse effects following weight gain.
J Clin Invest2015;125:787–95.
30. McLaughlin T, Sherman A, Tsao P, et al. Enhanced proportion of small adipose cells in insulin-resistant vs insulin-sensitive obese individuals implicates impaired adipogenesis.Diabetologia
2007;50:1707–15.
31. Bouhours-Nouet N, Dufresne S, de Casson FB, et al. High birth weight and early postnatal weight gain protect obese children and adolescents from truncal adiposity and insulin resistance metabolically healthy but obese subjects?Diabetes Care2008;31:1031–6.
cohort
healthy obesity in adults from the Haguenau
Weight for gestational age and metabolically
Sébastien Czernichow
Mélanie Pétéra, Marie Zins, Estelle Pujos-Guillot, Blandine Comte and Joane Matta, Claire Carette, Claire Levy Marchal, Julien Bertrand,
doi: 10.1136/bmjopen-2016-011367
2016 6:BMJ Open
http://bmjopen.bmj.com/content/6/8/e011367
Updated information and services can be found at:
These include:
References
#BIBL http://bmjopen.bmj.com/content/6/8/e011367
This article cites 31 articles, 9 of which you can access for free at:
Open Access
http://creativecommons.org/licenses/by-nc/4.0/
non-commercial. See:
provided the original work is properly cited and the use is
non-commercially, and license their derivative works on different terms, permits others to distribute, remix, adapt, build upon this work
Commons Attribution Non Commercial (CC BY-NC 4.0) license, which This is an Open Access article distributed in accordance with the Creative
service
Email alerting
box at the top right corner of the online article.
Receive free email alerts when new articles cite this article. Sign up in the
Collections
Topic
Articles on similar topics can be found in the following collections(1710)
Public health
(253)
Nutrition and metabolism
(1662)
Epidemiology
Notes
http://group.bmj.com/group/rights-licensing/permissions
To request permissions go to:
http://journals.bmj.com/cgi/reprintform
To order reprints go to:
http://group.bmj.com/subscribe/