HAL Id: hal-02462496
https://hal-mines-paristech.archives-ouvertes.fr/hal-02462496
Submitted on 7 Feb 2020
HAL is a multi-disciplinary open access
archive for the deposit and dissemination of
sci-entific research documents, whether they are
pub-lished or not. The documents may come from
teaching and research institutions in France or
abroad, or from public or private research centers.
L’archive ouverte pluridisciplinaire HAL, est
destinée au dépôt et à la diffusion de documents
scientifiques de niveau recherche, publiés ou non,
émanant des établissements d’enseignement et de
recherche français ou étrangers, des laboratoires
publics ou privés.
powder bed fusion
Yaasin Mayi, Morgan Dal, Patrice Peyre, Michel Bellet, C Metton, C.
Moriconi, Rémy Fabbro
To cite this version:
Yaasin Mayi, Morgan Dal, Patrice Peyre, Michel Bellet, C Metton, et al.. Laser-induced plume
investi-gated by finite element modelling and scaling of particle entrainment in laser powder bed fusion.
Jour-nal of Physics D: Applied Physics, IOP Publishing, 2019, 53, pp.075306. �10.1088/1361-6463/ab5900�.
�hal-02462496�
Journal XX (XXXX) XXXXXX
https://doi.org/XXXX/XXXX
Laser-induced plume investigated by finite
ele-ment modelling and scaling of particle
entrain-ment in Laser Powder Bed Fusion (LPBF)
Y. A. Mayi
1,2, M. Dal
2, P. Peyre
2, M. Bellet
3, C. Metton
1, C. Moriconi
1and R. Fabbro
21 Safran Additive Manufacturing, a technology platform of Safran Tech, Rue des Jeunes Bois,
Chateau-fort, 78114 Magny-Les-Hameaux, France
2 PIMM, Arts et Metiers Institute of Technology, CNRS, Cnam, HESAM University, 151 boulevard de
l’Hopital 75013 Paris, France
3 CEMEF, UMR 7635 PSL Research University MINES ParisTech, 06904 Sophia Antipolis, France
E-mail: yaasin.mayi@ensam.eu Received xxxxxx
Accepted for publication xxxxxx Published xxxxxx
Abstract
Although metal vaporisation has been observed in several laser processes such as drilling or welding, vapour plume expansion and its induced side effects are not fully understood. Espe-cially, this phenomenon is garnering scientific and industrial interest since recent investiga-tions in Laser Powder Bed Fusion (LPBF) have designated metal vaporisation as main source of denudation and powder spattering. The present study aims to provide a new insight on the dynamics of laser-induced vaporisation and to assess the potential of different gases for parti-cle entrainment. A self-consistent finite element model of laser-induced keyhole and plume is thus presented for this purpose, built from a comprehensive literature review. The model is validated with dedicated experimental diagnostics, involving high-speed imaging to measure the ascent velocity of the vapour plume. The transient dynamics of vapour plume is thus quantified for different laser incident intensities and gas flow patterns such as the mushroom-like structure of the vapour plume are analysed. Finally, the model is used as a tool to quan-tify the entrainment flow expected in LPBF and an analytical model is derived to define a velocity threshold for particle entrainment, expressed in term of background gas properties. Doing so it is possible to predict how denudation evolves when the gaseous atmosphere is changed.
Keywords: metal vapour plume, laser beam melting (LBM), finite element modelling (FEM), high-speed imaging
1. Introduction
There are number of laser processes, for instance drilling, welding or Laser Powder Bed Fusion (LPBF), where the input intensities involved are high enough (I ≳ 1 MW/cm²) to va-porise metal alloys. When the material surface temperature reaches its boiling point, metal vapour suddenly expands from
action-reaction principle, a recoil pressure – sometimes called back pressure [1], evaporation or ablation pressure [2] – is applied onto the melted surface, thus increasing its penetration in the solid and creating a cavity filled with gas or plasma [3] commonly referred to as “keyhole” (Figure 1). The Knudsen layer generated at the liquid/vapour interface is a non-equilib-rium zone which can be seen, at the macroscopic scale, as a
3 4 5 6 7 8 9 10 11 12 13 14 15 16 17 18 19 20 21 22 23 24 25 26 27 28 29 30 31 32 33 34 35 36 37 38 39 40 41 42 43 44 45 46 47 48 49 50 51 52 53 54 55 56 57 58 59
conditions [4].
Theoretical investigations on laser-induced vaporisation have been conducted notably by Anisimov (1968) [5] and Knight (1979) [1], based on gas kinetics and assuming a one-dimensional vapour flow. In his model of vaporisation into vacuum, Anisimov found that the maximum ablation rate de-pends only on the intrinsic properties of the irradiated surface and on its temperature – in accordance with pioneering works conducted by Hertz (1882) [6], Knudsen (1909) [7] and Lang-muir (1913) [8]. Knight extended the approach by including a stagnant atmosphere and assuming a purely convective evap-oration mode. By that, it is assumed that vapour flow is negli-gible when local pressure is inferior to the saturated vapour pressure. He revealed that for subsonic plumes, the steady as-cent velocity increases linearly with the melt surface temper-ature. For instance, applied to pure aluminium at atmospheric pressure, U = 120 m/s at 2950 K (Ma = 0.1) and U = 990 m/s at 4110 K (Ma = 0.8) [1].
In a more process-oriented perspective, Semak and Matsunawa (1997) [9] used Anisimov’s model to assess the role of recoil pressure on mass and energy balance in laser processes. Their so-called “piston model” investigates the equilibrium of a cylindrical liquid cell which progresses in its solid counterpart, driven by the recoil pressure. They found that at lower laser intensities (I ≈ 1 MW/cm²), typical to laser welding or LPBF, laser processes are thermally limited, at steady state, by melt pool convection driven by the recoil pres-sure, while in more intense conditions (I ≥ 20 MW/cm²), laser processes are primarily affected by vaporisation losses.
In the same prospect, gas kinetics results and empirical laws are extensively used in numerical computations of laser ablation [10,11], laser drilling [12], laser (spot [13–17]) weld-ing [18–23], LPBF [24–27] and Electron Beam Meltweld-ing (EBM) [28]. To date, one of the most self-consistent numeri-cal model has probably been proposed by Pang and co-work-ers [20–22]. Developed in the context of deep-penetration welding, their model investigates melt pool hydrodynamics and its interaction with the vapour plume. Comparable models have been developed by Otto et al. (2010) [29] and Courtois et al (2016) [23]. All these authors proposed fully coupled nu-merical models, but they are generally focused on the conse-quences of vaporisation on the melt pool hydrodynamics and its potential defects rather than on the plume aerodynamics it-self.
However, new issues regarding laser-induced vaporisation have arisen with the emergence of LPBF. This relatively new additive manufacturing process is very close to laser welding considering the physical phenomena involved (material melt-ing, thermocapillary convection, vaporization, rapid solidifi-cation) as the same laser input intensities are required, in the MW/cm² range. Vaporization should hence be regarded on the melt pool angle as well as on the gas phase side. Recent works [30,31] demonstrated that entrained gas streams generated on
the side of the vapour jet are strong enough to drag the sur-rounding powder grains into the melt pool or upward, causing denudation and powder spattering. Furthermore, gas streams generated in the LPBF build chamber are of importance nota-bly to anticipate and reduce pollution of optical systems due to nanoparticles clusters and fumes. Gas environment should hence be regarded as a key factor for process optimisation.
Some authors as Masmoudi et al. (2015) [24] and Bidare et al. (2017) [26] gave a first numerical insight on plume dynam-ics involved in LPBF. Particularly, Bidare et al. quantified the steady-state ejection velocity of the vapour plume and the in-duced denudating flow for different incident laser conditions. Their numerical predictions are in relative accordance with the state-of-the-art and their own experiments, but their model do not rely on gas kinetics results and melt pool hydrodynamics is not solved. However, by completely taking into account the melt pool hydrodynamics, their model would guarantee com-putation of realistic thermal field in the melt pool, necessary for predicting self-consistent vapour plume dynamics. Fur-thermore, even if the denudating flow is computed, they did not propose any physical criterion that defines whether this flow is strong enough to drag a particle or not. Consequently, it is not currently possible to predict how a change of back-ground atmosphere would affect denudation or spattering be-haviour.
To fill this gap, the authors propose a self-consistent ax-isymmetric model of laser-induced vaporisation, which tack-les both melt pool hydrodynamics and vapour plume dynam-ics. Heat transfer and fluid dynamics are solved in both the metal and the gas phases, and equation of conservation of chemical species is computed to describe gas environment as
Figure 1 Schematic of physical phenomena involved during
laser-induced metal vaporisation.
3 4 5 6 7 8 9 10 11 12 13 14 15 16 17 18 19 20 21 22 23 24 25 26 27 28 29 30 31 32 33 34 35 36 37 38 39 40 41 42 43 44 45 46 47 48 49 50 51 52 53 54 55 56 57 58 59
a compressible two-component phase. Additionally, an Arbi-trary Lagrangian Eulerian (ALE) scheme is used to track the transient evolution of the keyhole wall. The model is then val-idated with dedicated experiments, including high-speed im-aging to measure the ascent velocity of the vapour plume. Do-ing so, the predicted transient dynamics of the vapour plume is validated for different incident laser intensities. Finally, the numerical model is used to quantify the entrainment flow ex-pected in LBM. An analytical model of powder bed denuda-tion inspired by sediment transport science [32,33] is derived, to define a velocity threshold for particle entrainment, scaled with the fluid properties of the background gas.
2. Computational model
2.1 Geometrical configuration
The computational model is built in laser spot welding con-figuration. Vaporisation induced by static laser shot on dense substrate is studied as a first step, as the objective is to model and validate the vaporisation process only, independently of the powder bed aspect. A metallic target is irradiated by a static laser pulse and metal vapour expands vertically in an initially quiescent surrounding gas. Consequently, the process is assumed to have a cylindrical symmetry and the physical problems are thus computed in a 2D-axisymmetrical domain (Figure 2).
2.2 Heat transfer
The thermal field is computed by solving the transient heat conservation equation in both the gas and substrate domains:
ρicp,i∂T∂t + ρicp,i(u⃗ · ∇⃗⃗ T) = ∇⃗⃗ · (ki⃗⃗ T) ∇ (1) where cp,i, ki, and ρi are respectively the specific heat, the
ther-mal conductivity and the density of the different phases i.
In the substrate (sub), the enthalpy of fusion Lm is
intro-duced through an equivalent specific heat [34]: cp,subeq = cp+
Lm
√π∆T2exp [−
(T − Tm)2
∆T2 ] (2) where ΔT = (Tliq - Tsol)/2 is the solidification interval and Tm
= (Tliq + Tsol)/2 is the “melting” temperature.
The laser heat flux, counterbalanced by vaporisation losses, is imposed on the substrate upper surface FC:
ksub∇⃗⃗ T · (−n⃗ ) = φlaser− φvap
= (1 − Rλ)cos(θ)
P πR20
f(r)g(t) − ṁLv
(3)
where Rλ is the reflectivity of the substrate, θ is the laser
inci-dent angle relative to the substrate/gas interface, P and R0 are
the laser power and radius respectively, LV is the latent heat
of vaporisation and 𝑚̇ is the ablation rate.
The laser pulse has a hyper-Gaussian (top-hat) spatial dis-tribution f(r):
f(r) = exp (−16r16 R160
) (4)
It also follows an exponential temporal profile g(t): g(t) = 1 − exp (− t
τp)
(5)
where the rise time τp = 150 µs, so that transition from 10 %
to 90 % of g(t) is made in about 300 µs, accordingly to the laser source used.
Radiation losses are neglected compared to vaporisation losses and note that convection losses are naturally included in the modelling, since gas flow is solved in the vicinity of the material/gas interface. In addition, thermal continuity is as-sumed across the liquid/gas interface:
Tgas= Tsubstrate (6)
The ablation rate, derived by writing mass, momentum and energy conservation across the Knudsen layer, is commonly
Figure 2 Computational domain.
3 4 5 6 7 8 9 10 11 12 13 14 15 16 17 18 19 20 21 22 23 24 25 26 27 28 29 30 31 32 33 34 35 36 37 38 39 40 41 42 43 44 45 46 47 48 49 50 51 52 53 54 55 56 57 58 59
expressed by the Hertz-Langmuir relation [4]:
𝑚̇H−L= (1 − βR)√
M
2πRTPsat(T) (7) where βR is the retro-diffusion coefficient (i.e. the fraction of
vaporized particles which re-condensate when they interact with the surrounding particles), M is the molar mass of the vaporised species and Psat is the saturated vapour pressure.
Psat is calculated with the Clausius-Clapeyron law:
Psat(T) = Patmexp [
MLv
RTV(1 −
TV
T)] (8)
where Patm is the atmospheric pressure and TV is the boiling
point at atmospheric pressure.
βR characterizes the intensity of vaporization process [4].
At low vaporisation intensities (when T ≈ TV) the
surround-ing ambient gas confines the evaporatsurround-ing particles. Conse-quently, all the particles re-condensates and:
- βR = 1,
- ṁ = 0, - Ma = 0,
- Ps = Patm, where Ps is the pressure at the liquid/gas
interface.
At high vaporisation intensities (when T ≫ TV or in
vac-uum), vaporised matter carries enough energy to expel the sur-rounding ambient gas [2]. Consequently, Hertz-Langmuir equation applies and:
- βR → 0.18,
- m ̇ = ṁH-L,
- Ma → 1,
- Ps = Prec, where Prec is the recoil pressure, usually
de-duced from the Hertz-Langmuir equation [4]: Prec=
1
2(1 + βR)Psat(T) (9) At intermediate vaporisation intensities (T > TV), vaporized matter is more or less confined by the ambient gas and βR, ṁ
and Ps evolve with the temperature and with the local Mach
number. However, Hertz-Langmuir equation is not valid any-more, so the authors apply Pang’s method [20] – also proposed by Girardot et al. (2015) [12] – which consists in bridging the two evaporation regimes by a smoothed third-order polyno-mial: ṁ = { 0 ; 0 ≤ T < TL a1T3+ b1T2+ c1T + d1 ; TL≤ T < TH (1 − βR)√ M 2πRTPsat(T) ; TH≤ T < +∞ (10)
The temperature threshold TL and TH, respectively standing
for low and high vaporisation intensity regimes, are set fol-lowing Pang’s recommendations [20]. This is a pragmatic op-tion, which avoids adding another numerical coupling be-tween the global gas flow and the local vaporization condi-tions. Finally, external boundaries of computational domain
AB, BD and DE are set adiabatic as they are sufficiently far
from the heat source.
2.3 Fluid dynamics
Transient mass (11) and momentum (12) conservation laws are solved in both the metal and gas domains:
∂ρi
∂t + ∇⃗⃗ · (ρiu⃗ ) = 0 (11) ρi
∂u⃗
∂t+ ρi(u⃗ · ∇⃗⃗ )u⃗
= ∇⃗⃗ · {−pI + µi[∇⃗⃗ u⃗ + (∇⃗⃗ u⃗ ) T
] −2
3µi(∇⃗⃗ · u⃗ )I} + f vi (12)
where μi is the viscosity of each phase I and 𝑓 𝑣𝑖 is a volumetric force term that will be specified for each phase i.
Firstly, the substrate is treated as an incompressible New-tonian fluid. Hence, mass conservation law reduces to ∇⃗⃗ ·u⃗ = 0 and the term 2 3⁄ µi(∇⃗⃗ ·u⃗ )I vanishes in the momentum
conser-vation law. Furthermore, the solid/liquid transition is mod-elled thanks to a Darcy’s penalization term [35]:
f vsub= −K1u⃗ = −C1
(1 − fliq) 2
fliq3 + C2 u⃗
(13)
where fliq is the liquid fraction, C1 and C2 are numerical
con-stants tailored to penalized velocity in the solid.
In the liquid (i.e. fliq = 1), K = 0 and one finds the
non-penalized Navier-Stokes equations. Conversely in the solid (i.e. fliq = 0), K → ∞ and thus the velocity field tends toward
zero. Buoyancy effect is not included in the volumetric force term as its impact on velocity field is negligible compared to that of thermocapillary convection [36].
Secondly, gas phase is treated as a two-component ideal gas:
ρgas=
pM̃
RT (14)
where R is the universal gas constant and M̃ is the averaged molar mass that depends on the local metal vapour concen-tration.
Furthermore, in the gas phase, the volumetric force term is simply the gravity:
f vgas= ρgasg⃗ (15)
Stress balance at the liquid/gas interface FC gives the
3 4 5 6 7 8 9 10 11 12 13 14 15 16 17 18 19 20 21 22 23 24 25 26 27 28 29 30 31 32 33 34 35 36 37 38 39 40 41 42 43 44 45 46 47 48 49 50 51 52 53 54 55 56 57 58 59
boundary conditions [37]: (−pI + µ [∇⃗⃗ u⃗ + (∇⃗⃗ u⃗ )T] −2
3𝜇(∇⃗⃗ · u⃗ )I) · n⃗
= −(Ps− Patm ) · n⃗ + σκn⃗ + 𝛾∇⃗⃗ ST
(16)
where σ is the surface tension coefficient, κ is the interface curvature and γ = ∂σ ∂T⁄ is the thermocapillary coefficient.
As for the ablation rate, Pang’s recommendations is fol-lowed to account for the atmospheric pressure effects on the recoil pressure [20]: Ps= { Patm ; 0 ≤ T < TL a2T3+ b2T2+ c2T + d2 ; TL≤ T < TH 1 2(1 + βR)Psat(T) ; TH≤ T < +∞ (17)
Also, mass conservation at the interface FC gives [37]: ρL(u⃗ L· n⃗ − VI) = ρV(u⃗ V· n⃗ − VI) = ṁ (18) where VI is the normal velocity of the interface.
The term ṁ ρ⁄ represents the velocity at which the ablated L front progresses in the liquid. This quantity is negligible com-pared to the liquid recession speed u⃗ L·n⃗ [9]. Consequently:
VI = u⃗ L·n⃗ (19)
Similarly, ṁ ρ⁄ represents the mean velocity at which the V vaporized particles leave the Knudsen layer (i.e. the ejection velocity). The surface recession speed is negligible compared to the ejection velocity, thus:
Vin = u⃗ V·n⃗ = ṁ ρ⁄ V (20)
Therefore, to generate vapour flow in the model, Dirichlet boundary condition Vin (20) is imposed on FC.
Complemen-tary, ambient pressure is imposed on the fluid outlets CD and
DE. Finally, no slip condition is set on the external boundaries AB and BC.
2.4 Transport of metal vapour
A conservation equation of metal vapour concentration is coupled to the equation of momentum conservation (12):
∂Cvap
∂t + ∇⃗⃗ · (−D∇⃗⃗ Cvap) + u⃗ · ∇⃗⃗ Cvap = 0 (21)
where D is the diffusion coefficient.
Molar fraction of metal vapour xvap is used to compute the
averaged gas molar mass:
M̃ = xvapMvap+ (1 − xvap)Mamb (22) where Mvap and Mamb are the molar concentration of metal
va-pour and ambient gas respectively.
Vapour molar fraction xvap is fixed to 1 at the liquid/vapour
interface where T ≥ TV. In addition, regarding the expected
ejection velocity (U > 100 m/s), it is assumed that transport of metal vapour is more sensible to convection than to diffusion. D is thus treated as a numerical stabilization term, fixed to 2x10⁻⁵ m²/s. In these conditions, the mass Péclet number Pe =
R0U/D > 250 ≫ 1. Finally, vapour outflow is set on the
exter-nal boundaries CD and DE.
2.5 Numerical considerations
2.5.1 Liquid/gas interface tracking
. The ArbitraryLa-grangian Eulerian (ALE) method is used to track the liquid/gas interface. With this method, interface vertices follow the fluid movement through equation (19). Interface displacement is then propagated throughout the domain following an arbitrary prescribed way, to get a smooth mesh deformation. In the pre-sent work, the so-called Yeoh smoothing method is used. In-spired by neo-Hookean materials it looks for the minimum mesh deformation energy [38].
2.5.2 Materials properties and numerical constants
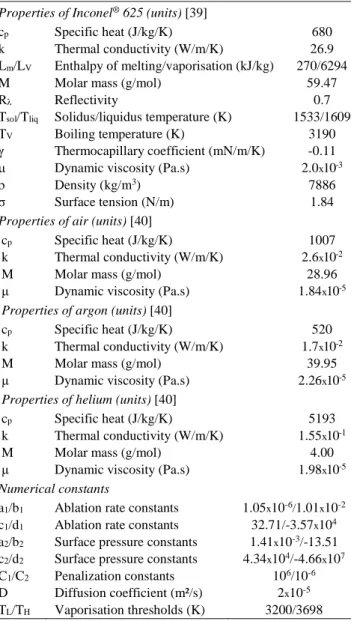
.Simulations are performed using the properties of Inconel®
al-loy 625 (IN625). Thermophysical properties of IN625 are con-sidered at T = Tliq/2, except the fluid properties which are
taken near the liquidus. In addition, properties of gaseous at-mospheres are considered at 298 K. Corresponding thermo-physical properties and numerical constants are summarized in Table 1.
2.5.3 Numerical setup
. The physical problem is solved byfinite element modelling, using the direct PARDISO solver in-tegrated in COMSOL Multiphysics® 5.4. The mesh is
com-posed of triangular elements, locally refined on boundaries AE and FC (down to 2 µm), where a relatively fine discretisation is needed to compute thermal gradients and fluid flow accu-rately. In addition, a linear interpolation is adopted. With such configuration, about 400,000 degrees of freedom are to be solved. Finally, time step is set to 1 µs, using a Backward Eu-ler temporal scheme and the pre-implemented adaptive time stepping algorithm is enabled, so that the software automati-cally adjusts the time step if necessary.
3. Model validation
3.1 Validation of the melt pool dimensions
As explained in the Introduction, vaporisation is primarily determined by the melt surface temperature, which in turn, is deeply related to the melt pool hydrodynamics. Consequently, prior to discuss about vapour plume characteristics, melt pool hydrodynamics should be validated with dedicated experi-ments. 3 4 5 6 7 8 9 10 11 12 13 14 15 16 17 18 19 20 21 22 23 24 25 26 27 28 29 30 31 32 33 34 35 36 37 38 39 40 41 42 43 44 45 46 47 48 49 50 51 52 53 54 55 56 57 58 59
3.1.1 Experimental setup
.To validate the predicted shape and dimensions of the melt pool, laser spot welding experiments are carried out in a Direct Observation of Drilled hOle (DODO) setup. The DODO method consists of drilling on the joint of two plates in butt configuration (Figure 3), which allows analysing dozens of fused zone macrographs in a single procedure [41]. To limit any joint effect on the fused zone, the plates are pre-polished (to maximise contact between them) and a spot size two times larger than that commonly used in LPBF is used (Table 2).
Table 2 Process parameters.
Laser power Spot diameter Pulse time
320-500-700 W 205 µm 3 ms
3.1.2 Results
. Figure 4 gives a typical example ofsimu-lated melt pool obtained with a laser spot diameter of 205 µm, an incident laser power of 700 W (I = 2.1 MW/cm²) and a pulse duration of 3 ms. When compared to the fused zone ob-tained in the same conditions, it appears that our finite element model reproduces with a relatively good agreement the fused zone morphology. In addition, Figure 5 shows that, in the se-lected laser intensity range, our finite element model predicts relatively well the fused zone width and depth, despite a sys-tematic overestimation of the melt pool depth of about 7%.
Thermal field and velocity streamlines in the melt pool de-picted on Figure 4b, outline how the different physical phe-nomena shape the resulting fused zone. On the centre of the melt pool free surface, on a width equivalent to the laser spot diameter, temperature reaches about 3500 K. This is superior to the boiling point at atmospheric pressure, as the local pres-sure (≈ Patm + Prec) is actually superior to the atmospheric one.
Conversely, on the rim of the melt pool, temperature is inferior to the boiling point, so pressure equals to atmospheric pressure according to equation (17). Hence, the pressure difference
be-Table 1 Thermophysical properties and numerical constants.
Properties of Inconel® 625 (units) [39]
cp Specific heat (J/kg/K) 680
k Thermal conductivity (W/m/K) 26.9 Lm/LV Enthalpy of melting/vaporisation (kJ/kg) 270/6294
M Molar mass (g/mol) 59.47 Rλ Reflectivity 0.7 Tsol/Tliq Solidus/liquidus temperature (K) 1533/1609
TV Boiling temperature (K) 3190
γ Thermocapillary coefficient (mN/m/K) -0.11 μ Dynamic viscosity (Pa.s) 2.0x10⁻³
ρ Density (kg/m3) 7886
σ Surface tension (N/m) 1.84
Properties of air (units) [40]
cp Specific heat (J/kg/K) 1007
k Thermal conductivity (W/m/K) 2.6x10⁻²
M Molar mass (g/mol) 28.96 μ Dynamic viscosity (Pa.s) 1.84x10⁻⁵
Properties of argon (units) [40]
cp Specific heat (J/kg/K) 520
k Thermal conductivity (W/m/K) 1.7x10⁻²
M Molar mass (g/mol) 39.95 μ Dynamic viscosity (Pa.s) 2.26x10⁻⁵
Properties of helium (units) [40]
cp Specific heat (J/kg/K) 5193
k Thermal conductivity (W/m/K) 1.55x10⁻¹
M Molar mass (g/mol) 4.00 μ Dynamic viscosity (Pa.s) 1.98x10⁻⁵
Numerical constants
a1/b1 Ablation rate constants 1.05x10⁻⁶/1.01x10-2
c1/d1 Ablation rate constants 32.71/-3.57x104
a2/b2 Surface pressure constants 1.41x10⁻³/-13.51
c2/d2 Surface pressure constants 4.34x10⁴/-4.66x107
C1/C2 Penalization constants 106/10-6
D Diffusion coefficient (m²/s) 2x10⁻⁵
TL/TH Vaporisation thresholds (K) 3200/3698
Figure 4 (a) Macrograph of a fused zone obtained by DODO method. (b) Comparison of the experimental fused zone shape with the
simu-lated melt pool just before the laser switch off (t = 3 ms). Parameters: P = 700 W, R0 = 102.5 µm.
Figure 3 Schematic of the DODO method. The laser source used is
a TRUMPF TruDisk 10002 operating at 1030 nm (Yb-YAG) and the plates are made of IN625.
3 4 5 6 7 8 9 10 11 12 13 14 15 16 17 18 19 20 21 22 23 24 25 26 27 28 29 30 31 32 33 34 35 36 37 38 39 40 41 42 43 44 45 46 47 48 49 50 51 52 53 54 55 56 57 58 59
tween the centre and the rim of the melt pool induces a depres-sion zone (keyhole), which primarily controls the depth of the fused zone [2]. As the recoil pressure drills the fused zone, melt is ejected from the centre of the interaction zone toward the rim of the melt pool. Consequently, a small melt volume in the bottom centre of the interaction zone is sheared by this ejected liquid metal, generating a small recirculation zone. Furthermore, from where the laser spot ends to the rim of the melt pool, temperature sharply decreases. Consequently, ther-mocapillary shear stress increases proportionally to the tem-perature gradient according to equation (16). A second recir-culation zone is thus generated at the vicinity of the liq-uid/solid boundary, increasing the local penetration of the melt pool in the solid.
Despite these encouraging results, the readers should note that the current modelling approach is valid only for keyhole with moderate aspect ratio (depth/width < 1). Heat flux ap-plied via equation (3) is distributed according to the cosine of the laser incident angle relative to the substrate/gas interface. Actually, the laser beam is reflected several times by the key-hole wall, resulting in a different laser source distribution and in an increase of the total absorbed energy. To take into ac-count these effects, the model should either integrate a classi-cal ray-tracing algorithm or compute the laser electromagnetic field as in ref. [14]. However, as the present study is mainly on the early stages of vaporisation, it was not considered nec-essary to integrate this effect in the model. Nevertheless, de-spite the simplifying assumptions adopted in our modelling, the presented results are quite satisfactory.
It is finally pointed out that simulation of the melt pool hy-drodynamics is today relatively well treated in the laser spot welding state-of-the-art – a recent example is given by Sharma et al. (2019) [17] – as the physics behind the process is quite well known. Hence, although not surprising, these preliminary
results were a good starting point for tackling with more con-fidence vapour dynamics, which is less discussed in the liter-ature.
3.2 Validation of the plume ascent velocity
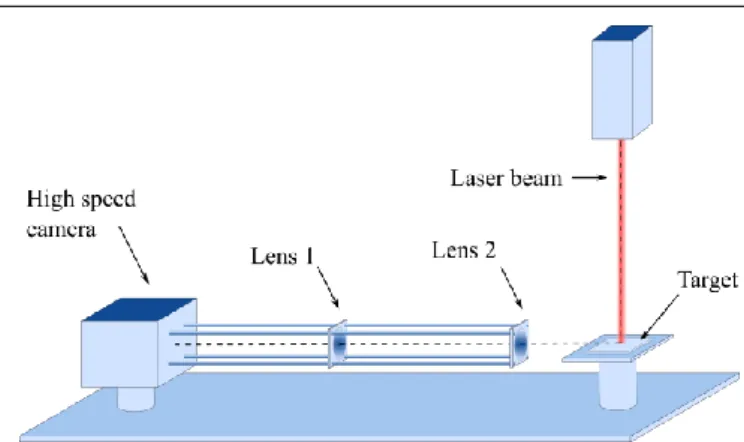
3.2.1 Experimental setup
. Vapour plumes induced byYAG lasers are thermally excited gases, which emit radiation in the visible spectrum at preferred spectral lines [3,42]. Con-trary to CO2 laser-induced plumes, they exhibit a relatively
low degree of ionisation (a few percent), even at very high la-ser intensities [43]. It is thus possible to capture their dynamic behaviour simply by observing their successive height with sufficient temporal resolution. Therefore, to validate the plume ascent velocity, laser spot welding experiments in air environment are conducted using the setup schematically de-picted in Figure 6. This setup is composed of a Yb-YAG laser source, a high-speed camera in transversal configuration with a low-pass filter (which cuts the laser wavelength off) and a pair of lenses to get the desired magnification.
Several constraints are associated with this configuration. Firstly, only the early unidirectional stage of plume growth is of interest, considering that above a certain height, the plume is diluted in the background gas. For this reason and for being able to reproduce the experiments numerically, optical magni-fication is set to capture the first three millimetres of plume growth only. Consequently, if an ascent velocity of the order of ~ 100 m/s is assumed, frame rate should be of the order of 330,000 fps to get 10 photographs per experiment, enough to estimate the plume ascent velocity. However, with our high-speed camera, image resolution decreases as the acquisition frequency increases. Consequently, a compromise is found to a frame rate of 256,000 fps, which imposes an image resolu-tion of 1,280 x 16 pixels (1,280 pixels corresponds to 3 milli-metres high). This gives a vertical narrow band that should be placed on the centre of the vapour plume (Figure 7). Secondly, to position the acquisition band relatively to the plume, it was
Figure 5 Comparison of the dimensions of the fused zone given by
experiments and FEM. Each experimental value is the average of fif-teen measurements and the error bars are the standard deviations cor-rected by the Student’s t-coefficient (90% of confidence interval).
Figure 6 Experimental setup. The laser used is a TRUMPF TruDisk
10002 operating at 1030 nm (Yb-YAG), the high-speed camera is a Photron FASTCAM UX 100 operating at 256,000 fps and the target is made of IN625. The experiments are carried out in air.
3 4 5 6 7 8 9 10 11 12 13 14 15 16 17 18 19 20 21 22 23 24 25 26 27 28 29 30 31 32 33 34 35 36 37 38 39 40 41 42 43 44 45 46 47 48 49 50 51 52 53 54 55 56 57 58 59
found to be more convenient to have a plume several times larger than the band. Therefore, as for the DODO experiments, laser spot size larger than that typically used in LPBF was used and laser power was adjusted to work in the vaporisation re-gime (Table 3).
Table 3 Process parameters
Power Spot diameter Pulse time
1.5-2.0-2.5-3.0 kW 580 µm 3 ms
3.2.2 Results
. Figure 8 gives a typical example ofsucces-sive frame photographs of plume induced by laser spot weld-ing with an incident power of 2.5 kW and a laser spot diameter of 580 µm (I = 0.95 MW/cm²). Each narrow band consists of pixels with grey levels, proportional to the intensity emitted by the plume. The bands are compared to their numerical counterparts, approximated by σT4 – except the last one where
the plume front is out of the band.
On the numerical results (labelled “FEM”), the vertical bands appears almost homogeneously white. This indicates that the temperature of the vapour plume is homogeneous on the first millimetres high and equals to temperature of the melt pool free surface, here T = 3360 K. This result agrees with work presented by Matsunawa et al. (1995) [42]. By spectros-copy analyses, they estimated the temperature of the plume induced by laser spot welding at 1 MW/cm² to be slightly above the alloy boiling point, just like the melt pool free sur-face. However, on the experimental photograph (labelled “XP”) two zones are visible. The bright zone in the bottom of the photographs corresponds to the melt pool and the vapour plume is above and appears darker. This feature is also clearly
visible on Figure 7, and it takes a conical shape that looks like the potential core that forms at the outlet of gas nozzles [44]. The reason why the plume appears darker on its inferior part remains unclear, but this apparent conical shape suggests that it comes from chemical composition gradient inside the va-pour plume. The conical core of the plume is certainly com-posed of pure metal vapour, which emits on a wavelength that does not match the spectral response of the optical system (high-speed camera + lenses), unlike the upper regions of the plume where mixing between metal vapour and ambient gas occurs. Complementary investigation including spectroscopic analysis could help understanding this apparent change of plume emission wavelength.
Nevertheless, regarding our primary concern that is the as-cent velocity, Figure 8 illustrates that the plume growth trends predicted by our model agrees quite well with the experiments. For each parameter tested, it is found both experimentally and numerically that after a short transient stage of 10-20 µs where the plume velocity increases (the two first bands), the plume grows linearly, i.e. the plume ascent velocity stabilizes around a constant value. This trend was also clearly observed by Matsunawa et al. (2001) [45] by means of high-speed streak imaging. He found similar linear trend as long as the melt pool does not experience any hydrodynamic instability, which is true in our case of vaporisation with low-penetration keyholes.
The measured steady ascent velocities are thus reported in Figure 9 and confronted to numerical estimations. Despite a systematic overestimation of about 10 %, the predicted ascent velocities agree well with the measured values. The plume as-cent velocity increases with the incident laser intensity, from 38 m/s for I = 0.57 MW/cm2 to 97 m/s for I = 1.14 MW/cm2.
These values should vary with the material properties. Note that variability on the plume growth rate increases with the laser incident intensity. As the number of position captured by
Figure 8 Bands at the left-hand side of the vertical red lines (labelled
“XP”): plume growth captured by high-speed imaging at 256,000 fps with a resolution of 1,280x16 pixels. Bands at the left-hand side (la-belled “FEM”): numerical counterparts of the experimental results. Note that at the latest captured instant, the plume front is out of the band. Parameters: P = 2.5 kW, R0 = 290 µm, background gas: air.
Figure 7 Example of plume induced by laser spot welding in air,
cap-tured by high-speed imaging at 5,000 fps with a resolution of 1,280x1,000 pixels. The central band of 16 pixels wide is not at the right scale. 3 4 5 6 7 8 9 10 11 12 13 14 15 16 17 18 19 20 21 22 23 24 25 26 27 28 29 30 31 32 33 34 35 36 37 38 39 40 41 42 43 44 45 46 47 48 49 50 51 52 53 54 55 56 57 58 59
the high-speed camera reduces when the ascent plume velocity increases, the calculated average ascent velocity is thus more sensitive to any variation at higher intensities. Nevertheless, the presented results are very satisfactory as very few authors presented similar comparative studies.
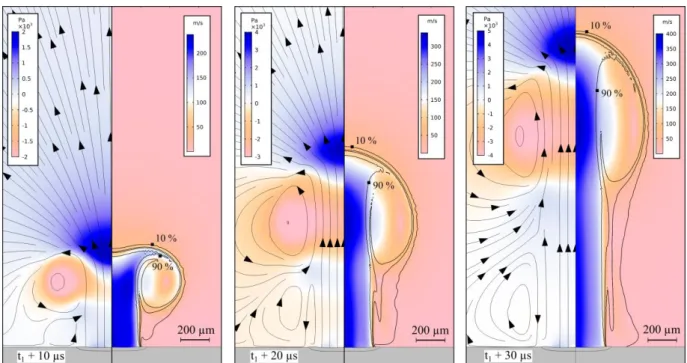
In addition, Figure 10 gives a larger picture of the simulated vapour plume. The plume, qualitatively represented by the va-pour molar fraction isocontours, exhibits a mushroom-like shape characteristic to Rayleigh-Taylor instability [46]. If our
simulations indicate that this structure forms during the early vaporisation stages, recent Schlieren images produced by Bi-dare et al. [26,47] in LPBF conditions show that the mushroom head develops on several tens of millimetres wide during mil-liseconds after the beginning of vaporisation. This mushroom shape is due to the structure of gas flow generated by the va-pour plume. Vava-pour is ejected upward at a relatively high ve-locity, here up to ~ 400 m/s, in an initial quiescent background gas. Due to viscous shearing between the vapour plume and the ambient gas, the latter is drawn vertically but slower than the plume core. According to Bernoulli’s principle, local pres-sure drops (due to the acceleration) and the background gas is drawn inward (t1 + 10 µs). As depicted by the images
se-quence, the zone of minimum pressure progresses vertically with the plume front (Figure 10). Additionally, ambient gas resists to the vertical plume growth, resulting in an increase of static pressure at the plume front – the increase is of the order of the local dynamic pressure. Gas located in the shear layers is consequently pushed down aside the vapour plume, creating a toroidal vortex that shapes the vapour plume head – the to-roidal vortex is illustrated by the circular velocity streamlines. When this low-pressure vortex is close enough to the substrate (here about a laser spot diameter high), ambient gas at the vi-cinity of the substrate is mainly drawn inward (t1 + 10 µs).
Contrariwise, when the toroidal vortex is sufficiently far from the substrate, a second counter-rotating vortex eventually forms, sheared by the first (t1 + 20 µs and t1 + 30 µs). Gas flow
is thus locally inverted and ambient gas at the vicinity of the substrate is ejected outward.
Figure 9 Comparison of the plume ascent velocities in air estimated
by FEM and measured by high-speed imaging. Each experimental value is the average of ten measurements and the error bars are the standard deviations corrected by the Student’s t-coefficient (90% of confidence interval).
Figure 10 (Left column) Reduced pressure field (i.e. Δp = p - Patm) and velocity field (right column) of the vapour plume during laser-induced
vaporisation of an IN625 plate (grey part on the bottom). The time t1 = 317 µs corresponds to the beginning of vaporisation. The arrow lines
on the left column are the velocity streamlines, the black curves on the right column are the vapour molar fraction isocontours (0.1, 0.5, 0.7 and 0.9) and the black contour on the plate is the liquidus contour. Parameters: P = 2.5 kW, R0 = 290 µm, background gas: air.
3 4 5 6 7 8 9 10 11 12 13 14 15 16 17 18 19 20 21 22 23 24 25 26 27 28 29 30 31 32 33 34 35 36 37 38 39 40 41 42 43 44 45 46 47 48 49 50 51 52 53 54 55 56 57 58 59
However, the central structure of the jet found in this con-figuration does not match the conical core observed experi-mentally. The central region of high metal concentration (> 90 %) seems disturbed by the recirculation pattern. On one hand, this difference may be attributed to the simplifying assump-tions made on the properties of the vapour plume. Particularly, the viscosity of the vapour plume must depend on local tem-perature, local vapour concentration and on local pressure whereas it is assumed constant and equals to that of the back-ground gas in the present work. These hypotheses certainly constitute the physical limits of the present work. One the other hand, complementary investigation on flow regimes en-countered at turbulence limit should contribute to deepen the understanding of the observed differences – in the present con-figuration, the vapour plume is quasi-turbulent as its Reynolds number Re = 2ρvapUR0/μ equals to 2320. This question should
be subjected to a dedicated work, which is out of the scope of the present study since in LPBF configuration (with smaller typical laser spots) this case is less susceptible to occur.
Finally, it should be important to put an emphasis on the difference between the ejection velocity and the ascent veloc-ity, because the latter is sometimes confused with the first. The ejection velocity is an image of the intensity of the vaporisa-tion process via ṁ , whereas the ascent velocity results to the first order, from the equilibrium between the dynamic pressure of the ejected vapour (∝ 1/2ρvapVin²) and inertia of the
sur-rounding background gas. This explains the factor five be-tween the ejection velocity near the substrate (~ 400 m/s) and the steady plume ascent velocity (~ 80 m/s). This is also the reason why on LBM videos such that produced by Bidare et al. [26], the powder particle visibly travel faster than the plume front. The powder particles are accelerated by the plume core, which ejects them at several meters per second, whereas in the meantime, metal vapour particles are slowed down by the am-bient gas.
4. Application to LPBF: scaling of particle
entrain-ment
Since the numerical model has been validated with dedi-cated experiments performed on a dense substrate, it can be used as a tool to estimate denudation flow encountered in LPBF. In LBM conditions, the inward flow exhibited and an-alysed in the previous paragraph is reported to be strong enough to drag the particles of the powder bed, causing denu-dation and powder spattering. However, to the best of the au-thor’s knowledge, there is to date no work dedicated to scale the minimum velocity necessary to entrain a powder particle in LPBF configuration and no criterion that would allow pre-dicting how this entrainment evolves when the background gas is changed. The objective of the following is to propose such analysis.
The model is adapted to a LBM configuration as depicted in Figure 11. The laser spot diameter is equal to 100 µm, the
laser power is set to 150 W (the resulting incident intensity is 1.9 MW/cm²) and a powder bed domain is added on the sides of the vapour plume. In this domain, gas flow is damped ac-cording to the Kozeny-Carman equation:
f vpowder= − µ K2u⃗ = −µ (1 − ε)2 ε3 π2k Kτ2 Dp u⃗ (23)
where ε is the porosity of the powder bed, Dp is the particle
diameter, kK is the Kozeny constant and τ is the tortuosity of
the powder bed.
This new term is similar to equation (13), except that K2
represents the permeability of the powder bed. For the study, it is assumed that Dp = 25 µm and ε = 0.5. In addition, for a
packed bed of equal spheres, τ = 6/π and kK = 5 [48]. Finally,
the powder domain is half the typical powder bed thickness, to make sure vaporisation starts 50% below the usual powder bed upper surface (assuming a 50 µm-thick powder bed of 50% porosity, when vaporisation starts, the melt pool free sur-face is 25 µm below the powder bed upper sursur-face due to pow-der densification).
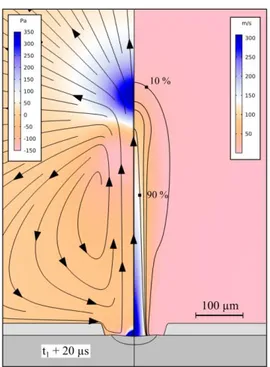
On Figure 11, the simulated vapour plume exhibits the same overall structure as analysed previously. The mushroom-like shape is much narrower than previously, but it is associ-ated to the same toroidal vortex formation on the sides of the vapour plume. In this configuration with smaller laser spot than previously, the characteristic conical shape of the plume core is found. This result tends to corroborate the idea that the
Figure 11 Vapour plume in LPBF configuration, 20 µs after the
beginning of vaporisation (t1 = 189 µs). Parameters: P = 150 W, R0 =
50 µm, background gas: argon.
3 4 5 6 7 8 9 10 11 12 13 14 15 16 17 18 19 20 21 22 23 24 25 26 27 28 29 30 31 32 33 34 35 36 37 38 39 40 41 42 43 44 45 46 47 48 49 50 51 52 53 54 55 56 57 58 59
current model is particularly suitable for vapour plume en-countered in LPBF configurations – here Re = 400.
Near the substrate, ejection velocity of similar order of magnitude is found (~ 300 m/s). However, the pressure in-crease at the plume front and the pressure drop on the plume sides are one order of magnitude less than in the previous case, because the local vertical velocity is much more damped. In addition, although the lower pressure zone is relatively far from the substrate (here about four times the laser spot diam-eter), only a single toroidal vortex is formed. This result may certainly be correlated to the fact that the vapour jet is here laminar. Regarding the LPBF process, formation of a single recirculation pattern means that the eventual surrounding par-ticles would be dragged mainly inward (toward the melt pool), which is consistent with in-situ observations.
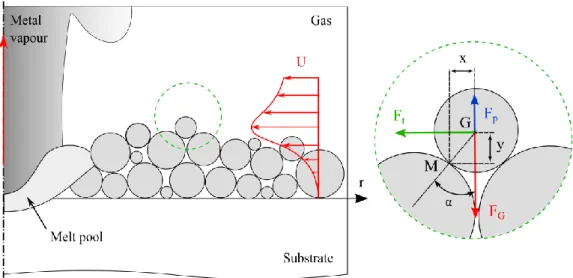
The steady state vertical profile of the radial velocity is re-ported on Figure 12 for different radial distances from the la-ser axis. The first 25 µm in height corresponds to the powder bed thickness in which the radial velocity is set to zero. The inward velocity then increases (in absolute value) above the powder bed, reaching a maximum value 15 µm above the powder bed (z = 40 µm). The observed spinning motion of the particles when they are entrained tend to corroborate the pres-ence of a high velocity gradient just above the powder bed [26]. The inward velocity reaches its maximum value at the vicinity of the plume shear layers (here, up to 7 m/s) and de-creases with the radial distance. This result suggests that the entrainment flow is acting over a relatively large width of ~ 6 to 7 times the laser spot radius, in accordance with Bidare’s, who estimated the denudating flow to act over about ten times the laser spot radius [26].
However, on the 6 to 7 laser spot radius where the entrain-ment flow acts, it would be interesting to estimate the distance over which the powder particles would be effectively en-trained. To do so, the problem is schematically parametrized as on Figure 13. Let us consider a spherical particle on the top of a powder bed, which is submitted a radial velocity field. The particle is thus subjected to the following forces:
- FG = ρpVpg: weight of the particle, where ρp and Vp
are the particle density and volume respectively; - Ft = 0.5ρgasCxSU²: drag force, where Cx is the drag
coefficient, S is the projected area of the particle and U is a characteristic velocity;
- Fp = 0.5ρgasCLSU²: lift due to vertical velocity
gra-dient, where CL is the lift coefficient.
These forces are assumed to apply on the centre of gravity G
Figure 13 Schematic of particle entrainment model induced by background gas flow in static configuration. The radial velocity field U is
damped in the powder bed, reaches a maximum just over the powder bed and then decreases.
Figure 12 Steady state vertical profile of the radial velocity for
dif-ferent radial distance from the laser axis. Parameters: P = 150 W, R0
= 50 µm, background gas: argon.
3 4 5 6 7 8 9 10 11 12 13 14 15 16 17 18 19 20 21 22 23 24 25 26 27 28 29 30 31 32 33 34 35 36 37 38 39 40 41 42 43 44 45 46 47 48 49 50 51 52 53 54 55 56 57 58 59
of the particle. Other forces could be considered, such as the van der Waals force, friction between the particles or cohesive force linked to the bed moisture. However, it is assumed that to the first order, particle motion is primarily determined by the intensity of the drag force. Consequently, if the particle is entrained by rolling mode (i.e. the particle rolls around its con-tact point M with another particle [32]), then particle equilib-rium verifies:
Ft· y −
F
G· x = 0 (24) When written in terms of ratio Θt of destabilizing force (drag)over stabilizing force (weight), equation (24) gives: Θt= [
Ft
F
G]threshold= tan (α) (25)
where α is the contact angle between two particles, relative to the vertical axis.
Equation (25) defines a simple criterion of particle entrain-ment, which is nothing else but the Shields number [32]. In a straightforward manner, it states that the minimum shear force necessary to initiate the particle movement scales with the par-ticle weight and its contact angle with the other parpar-ticles. The greater the Shields number, the more difficult is particle en-trainment.
The contact angle between the particles is not a convenient parameter as it is not possible to define it at the scale of the powder bed. Nevertheless, when expressed in terms of veloc-ity threshold Ut, this criterion gives useful information on how
particle entrainment might evolve with the properties of the background gas. To do so, drag coefficient Cx is written as a
function of the particle Reynolds number Rep:
Rep=
ρgasDpUth
µ (26)
If Rep lies between 0.3 and 1,000 as expected here, then Cx is
evaluated by [49]: Cx=
18.5
Re0.6 (27)
Therefore, after a bit of manipulation, one finds:
Θt∝ µ0.6ρgas0.4Ut1.4 (28)
Ut∝ µ−3/7ρgas−2/7 (29)
Equations (28) states that for given powder bed character-istics (particle diameter, spatial distribution of the particles) and a given background gas, powder bed wear increases with the shear velocity, which is consistent. Equation (29), deduced from equation (28), gives a relationship between the entrain-ment velocity threshold and the fluid properties of the gaseous atmosphere. As gases commonly used in welding have their viscosity of the order of 10-5 Pa.s, equation (29) teaches that it
may be efficient to reduce particle entrainment by acting on
the density of the background gas (rather than on the viscos-ity), which might vary by an order of magnitude. This might be done by changing the gas or acting on its pressure.
To illustrate the effect of a change of density on powder entrainment, a comparative study in carried out between argon and helium. This example is relevant as these two gases have similar viscosities (~ 2x10⁻⁵ Pa.s) but argon is ten times denser
than helium (Table 1). To scale the model (29), experimental work done by Guo et al. (2018) [50] is used. They measured the velocity of a particle (Dp = 40 µm and ρp = 7980 kg/m3)
drawn by lateral argon flow to be of the order of ~ 0.39 m/s during static shooting on powder bed. With the current model, the same radial velocity is obtained when the contact angle α is set to π/4, i.e. when the drag force has the same magnitude as the weight of the particle (Θt = 1). However, the velocity of
the particle probably constitutes a lower estimation of the en-trainment velocity. Therefore, the velocity threshold for argon in this configuration is fixed to 1 m/s and Ut is thus plotted as
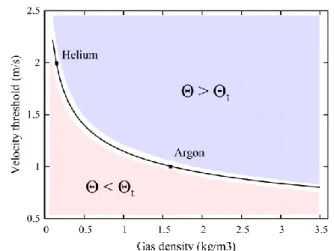
a function of the density of the background gas on Figure 14. So according to our criterion, the entrainment velocity threshold for the same particle in helium atmosphere is Ut = 2
m/s. However, according to the simulation presented in Figure 11, the maximum radial velocity induced by vaporisation is multiplied by six in helium atmosphere (Figure 15). In other words, the decrease of background gas density that should re-sults in a decrease of the entrainment efficiency is more than compensated by a large increase of the induced radial velocity. Consequently, reporting the velocity threshold for both gases on Figure 15, the entrainment width found in helium atmos-phere is larger than that obtained in argon atmosatmos-phere, 3.3 against 2.5 times the laser spot radius respectively. Experi-mentally, this result is confirmed by Bidare et al. (2018) [47]. They compared the widths of the denudation zones obtained in argon and helium atmospheres for different background
Figure 14 Velocity threshold versus gas density. In the superior part
of the graph, condition for particle motion is fulfilled (U > Ut). On
the contrary, in the inferior part of the graph, shear velocity is not sufficient to drag the particle. Parameters: Dp = 40 µm, ρp = 7980
kg/m3, μ = 2.0x10⁻⁵ Pa.s. 3 4 5 6 7 8 9 10 11 12 13 14 15 16 17 18 19 20 21 22 23 24 25 26 27 28 29 30 31 32 33 34 35 36 37 38 39 40 41 42 43 44 45 46 47 48 49 50 51 52 53 54 55 56 57 58 59
pressures and different laser parameters and revealed that the denudation zone generated in helium where systematically larger than that generated in argon atmosphere.
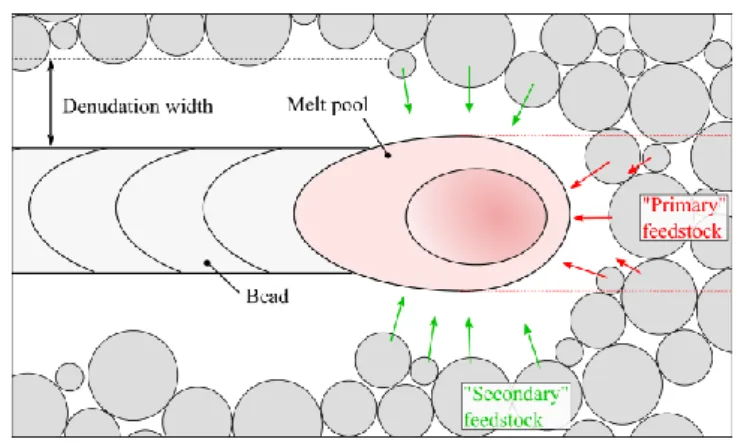
So at last, our computational model coupled with a rela-tively simple analytical model of powder entrainment, allows understanding how powder entrainment evolves according to the working atmosphere. Doing so, we have been able to ver-ify that denudation increases as the density of the ambient gas decreases, since the latter is compensated by a significant in-crease in entrainment velocity. However, it should be empha-sized that only the case of particle entrainment induced by re-circulation in vertical plume configuration at atmospheric pressure has been investigated. Denudations due to widening of the vapour plume observed at low pressure as well as that due to plume inclination at high laser velocity have not been considered here. However, it would not be difficult to com-plete the present computational model to deal with these cases. More broadly, it should be notified that lateral particle entrain-ment constitutes a “secondary” material feedstock that poten-tially contributes to the local mass balance – the “primary” material feedstock being the powder particles in the laser path (Figure 16). This indirect contribution tends to destabilize the process during both the fusion stage, feeding the melt pool and generating solid spatters, and the recoating stage where coater hindering is possible if the resulting bead is higher than the powder level. The latter phenomenon happens particularly during the first tracks when the beads are surrounded by the powder bed. Reducing particle entrainment (denudation and solid spatter at the same time) thus helps stabilizing the pro-cess by limiting it to its direct contribution. In this respect, current work is a promising approach as it should provide a useful basis for further reflection about how the working at-mosphere might be modified in order to optimise the LPBF process.
5. Conclusion
A multi-physical finite element model of laser-induced va-porisation is presented to give a deeper insight on the vapour plume dynamics and its induced side effects. Built from a comprehensive literature survey, the computational model successfully makes the bridge between the melt pool hydrody-namics and vapour ejection. By taking into account the melt pool hydrodynamics, the model guarantees computation of re-alistic thermal field in the melt pool, necessary for predicting self-consistent vapour plume dynamics. Computation of hy-drodynamics in the gas phase outlined the linear growth of the vapour plume after a very short transient of few microseconds, in agreement with the state-of-the-art and with our dedicated high-speed imaging diagnostics. Since the gas phase is treated as a two-component compressible environment, the model ex-hibited transient formation of the mushroom-like shape of the vapour plume, observed in the most recent schlieren works. This particular shape reveals the flow structure induced by va-porisation, especially radial flow above the substrate that is due to local pressure drop located in the jet shear layers. Since this so-called “Bernoulli effect” is reported in the LBM litera-ture to cause denudation and powder spattering, the model is used, coupled to a simple analytical model of powder bed ero-sion, to scale particle entrainment in LPBF configuration. More precisely, the numerical model is used to estimate the induced radial flow in typical LBM vaporisation conditions and the analytical model allow defining a criterion for the par-ticle onset of movement. From this work, one learns that: 1) The radial velocity threshold for particle entrainment
scales with µ−3/7ρ gas −2/7
. Therefore, for a given inward ve-locity induced by vaporisation, denudation is reduced by decreasing the viscosity and the density of the back-ground gas.
2) For a given laser incident intensity, while vapour ejection
Figure 15 Maximum steady inward flow in argon and helium
atmos-pheres (z = 40 µm). The x-axis starts at r = R0 as under the laser beam
(r < R0) the powder is fully melted. Parameters: P = 150 W, R0 = 50
µm.
Figure 16 Schematic of the LPBF process (top-view) with a
distinc-tion between the “primary” feedstock (particles in the path of the la-ser beam) and the “secondary” feedstock (lateral particles entrained toward the melt pool).
3 4 5 6 7 8 9 10 11 12 13 14 15 16 17 18 19 20 21 22 23 24 25 26 27 28 29 30 31 32 33 34 35 36 37 38 39 40 41 42 43 44 45 46 47 48 49 50 51 52 53 54 55 56 57 58 59
velocity remains unchanged in argon and helium atmos-pheres, the induced recirculation flow is faster in helium atmosphere (up to six times faster in the present case) as helium is ten times lighter than argon. The effect of den-sity drop on the drag force is thus compensated by an increase of the inward velocity.
3) Consequently for a given laser incident intensity, denu-dation is more important in helium atmosphere than in argon atmosphere, in accordance with recent experi-mental observation.
Complementary work should be conducted to deepen the understanding of laser-induced plume. Apart from spectro-scopic analysis and investigation on flow regimes observed at turbulence limit as suggested previously, a first step could be to extend the present work by computing vaporisation with a wider range of process conditions (different substrates, back-ground gases, and backback-ground pressure and laser intensities) in order to understand more systematically how the vapour plume dynamics and entrainment flow scale with the process parameters. In addition, the model should be transposed in a 3D configuration, to investigate to what extent the conclusions of the present work are modified under laser displacement re-gime.
Acknowledgements
The authors are grateful to the laser team at PIMM labora-tory, particularly to Frederic COSTE, Cyril GORNY and Pierre LAPOUGE for their guidance on the experimental fa-cilities and to Olivier ANDREAU for his help with processing of the high-speed images.
References
[1] Knight C J 1979 Theoretical Modeling of Rapid Surface Vaporization with Back Pressure AIAA J. 17 519–23 [2] Hirano K, Fabbro R and Muller M 2011 Experimental
determination of temperature threshold for melt surface deformation during laser interaction on iron at atmospheric pressure J. Phys. D. Appl. Phys. 44 435402
[3] Greses J, Hilton P A, Barlow C Y, Steen W M, Park G and Group L 2001 Spectroscopic studies of plume/plasma in different gas environments ICALEO 2001
[4] Samokhin A A 1990 Effect of Laser Radiation on
Absorbing Condensed Matter ed V B Fedorov (New York:
Nova Science Publishers)
[5] Anisimov S I 1968 Vaporization of metal absorbing laser radiation Sov. Phys. JETP 27 182–3
[6] Hertz H 1882 Ueber die Verdunstung der Flüssigkeiten, insbesondere des Quecksilbers, im luftleeren Raume Ann.
Phys. 253 177–93
[7] Knudsen M 1909 Experimentelle Bestimmung des Druckes gesättigter Quecksilberdämpfe bei 0° und höheren Temperaturen Ann. Phys. 334 179–93
[8] Langmuir I 1913 The effect of space charge and residual gases on thermionic currents in high vacuum Phys. Rev. 2 450–86
[9] Semak V and Matsunawa A 1997 The role of recoil
pressure in energy balance during laser materials processing J. Phys. D. Appl. Phys. 30 2541–52
[10] Harilal S S, Miloshevsky G V., Diwakar P K, Lahaye N L and Hassanein A 2012 Experimental and computational study of complex shockwave dynamics in laser ablation plumes in argon atmosphere Phys. Plasmas 19 1–11 [11] Palya A, Ranjbar O A, Lin Z and Volkov A N 2019
Kinetic simulations of laser-induced plume expansion into a background gas under conditions of spatial confinement
Int. J. Heat Mass Transf. 132 1029–52
[12] Girardot J, Lorong P, Illoul L, Ranc N, Schneider M and Favier V 2015 Modeling laser drilling in percussion regime using constraint natural element method Int. J. Mater.
Form. 10 205–19
[13] Lee J Y, Ko S H, Farson D F and Yoo C D 2002
Mechanism of keyhole formation and stability in stationary laser welding J. Phys. D. Appl. Phys. 35 1570–6
[14] Courtois M, Carin M, Masson P Le, Gaied S and Balabane M 2013 A new approach to compute multi-reflections of laser beam in a keyhole for heat transfer and fluid flow modelling in laser welding J. Phys. D. Appl. Phys. 46 505305
[15] Tan W, Bailey N S and Shin Y C 2013 Investigation of keyhole plume and molten pool based on a three-dimensional dynamic model with sharp interface formulation J. Phys. D. Appl. Phys. 46 055501 [16] Bruyere V, Touvrey C, Namy P and Authier N 2017
Multiphysics modeling of pulsed laser welding J. Laser
Appl. 29 022403
[17] Sharma S, Mandal V, Ramakrishna S A and Ramkumar J 2019 Numerical simulation of melt pool oscillations and protuberance in pulsed laser micro melting of SS304 for surface texturing applications J. Manuf. Process. 39 282– 94
[18] Ki H, Mohanty P S and Mazumder J 2005 A numerical method for multiphase incompressible thermal flows with solid-liquid and liquid-vapor phase transformations Numer.
Heat Transf. Part B Fundam. 48 125–45
[19] Otto A and Schmidt M 2010 Towards a universal numerical simulation model for laser material processing
Phys. Procedia 5 35–46
[20] Pang S, Hirano K, Fabbro R and Jiang T 2015 Explanation of penetration depth variation during laser welding under variable ambient pressure J. Laser Appl. 27 022007 [21] Pang S, Chen X, Zhou J, Shao X and Wang C 2015 3D
transient multiphase model for keyhole, vapor plume, and weld pool dynamics in laser welding including the ambient pressure effect Opt. Lasers Eng. 74 47–58
[22] Pang S, Chen X, Shao X, Gong S and Xiao J 2016 Dynamics of vapor plume in transient keyhole during laser welding of stainless steel: Local evaporation, plume swing and gas entrapment into porosity Opt. Lasers Eng. 82 28– 40
[23] Courtois M, Carin M, Le Masson P, Gaied S and Balabane M 2016 Guidelines in the experimental validation of a 3D heat and fluid flow model of keyhole laser welding J. Phys.
D. Appl. Phys. 49 155503
[24] Masmoudi A, Bolot R and Coddet C 2015 Investigation of the laser-powder-atmosphere interaction zone during the selective laser melting process J. Mater. Process. Technol.
225 122–32
[25] Khairallah S A, Anderson A T, Rubenchik A and King W E 2016 Laser powder-bed fusion additive manufacturing: Physics of complex melt flow and formation mechanisms
3 4 5 6 7 8 9 10 11 12 13 14 15 16 17 18 19 20 21 22 23 24 25 26 27 28 29 30 31 32 33 34 35 36 37 38 39 40 41 42 43 44 45 46 47 48 49 50 51 52 53 54 55 56 57 58 59
of pores, spatter, and denudation zones Acta Mater. 108 36–45
[26] Bidare P, Bitharas I, Ward R M, Attallah M M and Moore A J 2017 Fluid and particle dynamics in laser powder bed fusion Acta Mater. 142 107–20
[27] Tang M, Pistorius P C and Beuth J L 2017 Prediction of lack-of-fusion porosity for powder bed fusion Addit.
Manuf. 14 39–48
[28] Klassen A, Scharowsky T and Körner C 2014 Evaporation model for beam based additive manufacturing using free surface lattice Boltzmann methods J. Phys. D. Appl. Phys.
47
[29] Otto A and Schmidt M 2010 Towards a universal numerical simulation model for laser material processing
Phys. Procedia 5 35–46
[30] Matthews M J, Guss G, Khairallah S A, Rubenchik A M, Depond P J and King W E 2016 Denudation of metal powder layers in laser powder bed fusion processes Acta
Mater. 114 33–42
[31] Gunenthiram V, Peyre P, Schneider M, Dal M, Coste F and Fabbro R 2017 Experimental analysis of spatter generation and melt-pool behavior during the powder bed laser beam melting process J. Mater. Process. Technol.
251 376–86
[32] Dey S and Papanicolaou A 2008 Sediment threshold under stream flow: A state-of-the-art review KSCE J. Civ. Eng.
12 45–60
[33] Clark A H, Shattuck M D, Ouellette N T and O’Hern C S 2015 Onset and cessation of motion in hydrodynamically sheared granular beds Phys. Rev. E - Stat. Nonlinear, Soft
Matter Phys. 92 1–7
[34] Bonacina C, Comini G, Fasano A and Primicerio M 1973 Numerical solution of phase-change problems Int. J. Heat
Mass Transf. 16 1825–32
[35] Voller V R and Prakash C 1987 A fixed grid numerical modelling methodology for convection-diffusion mushy region phase-change problems Int. J. Heat Mass Transf. 30 1709–19
[36] Ladani L, Romano J, Brindley W and Burlatsky S 2017 Effective liquid conductivity for improved simulation of thermal transport in laser beam melting powder bed technology Addit. Manuf. 14 13–23
[37] Tryggvason G, Esmaeeli A, Lu J and Biswas S 2009 Direct numerical simulations of gas/liquid multiphase flows Fluid Dyn. Res. 38 660–81
[38] COMSOL 2018 Comsol Multiphysics® Reference Manual (Version 5.4)
[39] Mills K C 2002 Recommended values of thermophysical
properties for selected commercial alloys (Cambridge:
Woodhead Publishing Limited) [40] Air Liquide 2019 Gas Encyclopedia
[41] Schneider M, Berthe L, Muller M and Fabbro R 2010 A fast method for morphological analysis of laser drilling holes J. Laser Appl. 22 127–31
[42] Matsunawa A, Kim J-D, Takemoto T and Katayama S 1995 Spectroscopic studies on laser induced plume of aluminum alloys ICALEO 1995 vol 719
[43] Kawahito Y, Matsumoto N, Mizutani M and Katayama S 2008 Characterisation of plasma induced during high power fibre laser welding of stainless steel Sci. Technol.
Weld. Join. 13 744–8
[44] Dubois J 2010 Étude expérimentale de jets libres,
compressibles ou en présence d’un obstacle.
(Aix-Marseille Université)
[45] Matsunawa A, Seto N, Kim J-D, Mizutani M and Katayama S 2001 Observation of Keyhole and Molten Pool Behaviour Trans. Join. Weld. Res. Inst. 30 13–27 [46] Kull H J 1991 Theory of the Rayleigh-Taylor Instability
Phys. Rep. 206 197–325
[47] Bidare P, Bitharas I, Ward R M, Attallah M M and Moore A J 2018 Laser powder bed fusion in high-pressure atmospheres Int. J. Adv. Manuf. Technol. 99 543–55 [48] Založnik M and Combeau H 2010 An operator splitting
scheme for coupling macroscopic transport and grain growth in a two-phase multiscale solidification model: Part I - Model and solution scheme Comput. Mater. Sci. 48 1– 10
[49] Flemmer R L C and Banks C L 1986 On the drag coefficient of a sphere Powder Technol. 48 217–21 [50] Guo Q, Zhao C, Escano L I, Young Z, Xiong L, Fezzaa K,
Everhart W, Brown B, Sun T and Chen L 2018 Transient dynamics of powder spattering in laser powder bed fusion additive manufacturing process revealed by in-situ high-speed high-energy x-ray imaging Acta Mater. 151 169–80
3 4 5 6 7 8 9 10 11 12 13 14 15 16 17 18 19 20 21 22 23 24 25 26 27 28 29 30 31 32 33 34 35 36 37 38 39 40 41 42 43 44 45 46 47 48 49 50 51 52 53 54 55 56 57 58 59