UNCORRECTED
PROOF
Contents lists available at ScienceDirectEcological Modelling
journal homepage: http://ees.elsevier.comEcological niche distribution along soil toxicity gradients: Bridging theoretical
expectations and metallophyte conservation
Sylvain Boisson
a,⁎, Arnaud Monty
a, Maxime Séleck
a, Mylor Ngoy Shutcha
b, Michel-Pierre Faucon
c,
Grégory Mahy
aaBiodiversity and Landscape, TERRA, Gembloux Agro-Bio Tech, University of Liege. 2 Passage des Déportés, Gembloux 5030, Belgium
bEcology, Restoration Ecology and Landscape Research Unit, Faculty of Agronomy, University of Lubumbashi, Route Kasapa. Campus Universitaire, Lubumbashi 1825, Congo cHydrogeochimical Interactions Soil-Environment (HydrISE) Unit, Polytechnic Institute LaSalle Beauvais (ISAB-IGAL), 15 rue Pierre Waguet, Beauvais 60026, France
A R T I C L E I N F O
Keywords Micronutrient GAM
Species response curve Threatened oldgrowth grassland Plant tolerance
A B S T R A C T
Ecological niche modelling helps us to understand the spatial assembly of species in heterogeneous environments. Three patterns have been widely reported in the research literature regarding the relationship between realised niches and macronutrient concentration gradients: (1) species’ optima are unevenly distributed, with a higher frequency in mesic conditions; (2) species’ response curves are narrower when optima density is higher; and (3) species with optima at the extremes of the gradients have skewed response curves with a longer tail toward mesic conditions. This study aims to test the existence of these patterns on a vegetation model occurring in metallif-erous soils comprising copper and cobalt along a toxicity gradient in south-eastern D.R. Congo. Realised niches of 80 taxa were modelled using generalised additive models. The niche optima and the niche widths were deter-mined for each taxon. Results highlighted three groups which differ according to the niche optima location along the soil metal concentration gradients. The patterns found along macronutrient concentration gradients were, to some extent, transposable along micronutrient concentration gradients. Our findings on the diversity and assem-bly of realised niches has consequences for plant conservation strategies.
1. Introduction
The field of vegetation ecology has long been concerned with de-scribing the distributions of species along edaphic gradients (Austin, 2007, 1987, 1985). Ecological niche theory and modelling help us to understand the spatial assembly of species in heterogeneous envi-ronments (Chase and Leibold, 2003; Higgins et al., 2012). Since Hutchinson’s definition (1957), ecological niches of species distributed along one or several environmental factor gradients has been addressed using statistical and mathematical tools (Austin, 2007; Guisan et al., 2002; Yee and Mitchell, 1991). A fundamental ecological niche is re-lated to the physiological tolerance of species, whereas a realised eco-logical niche is the range of conditions and resources where the species is actually found given the presence of biotic interactions (Hutchinson, 1957). At a species level, the response curve along one environmental factor gradient, obtained from field occurrence or abundance data, is the classical representation of the one-dimensional realised niche (Austin, 2007; Austin and Meyers, 1996; Coudun and Gégout, 2006; Ryd-gren et al., 2003).
Along edaphic macronutrient soil concentration gradients, the com-bination of species tolerance and interspecific competition leads to three characteristic patterns in species response curves: (1) species’ optima are unevenly distributed, with a higher frequency in mesic conditions (e.g. Minchin, 1989; Lawesson and Oksanen, 2002); (2) a species response curve tends to be narrower when optima density is higher (e.g., Minchin, 1989; Lawesson and Oksanen, 2002); and (3) species with optima at the extremes of the gradient present skewed response curves with a longer tail toward mesic conditions (e.g., Austin and Gaywood, 1994; Chase, 2011). These patterns were observed for distinct vegeta-tion types with components such as calcium (Hájková et al., 2008), magnesium (Wright et al., 2006), phosphorus (Austin and Mey-ers, 1996) or carbon-nitrogen ratio (Heikkinen and Mäkipää, 2010). However, the existence of such distribution patterns along micronutri-ent soil concmicronutri-entration gradimicronutri-ents has not been addressed so far, although soils in some areas of the world do present unbalanced micronutrients concentrations that constrain vegetation type and species distributions (Baker et al., 2010; Bizoux et al., 2004; Brady et al., 2005; Duvi-gneaud and Denaeyer-De Smet, 1963; Kruckeberg, 1992; Whiting et al., 2002).
⁎Corresponding author.
E-mail address: sylvain.boisson@uliege.be (S. Boisson)
https://doi.org/10.1016/j.ecolmodel.2019.108861
Received 2 July 2019; Received in revised form 29 October 2019; Accepted 30 October 2019 Available online xxx
UNCORRECTED
PROOF
S. Boisson et al. Ecological Modelling xxx (xxxx) xxx-xxx
As micronutrients and beneficial elements (i.e. elements that can en-hance physiological mechanisms but are not considered nutrients) are needed in small to very small quantities by plants, the range of their available concentrations in soil may considerably differ from that of macronutrient concentrations. The first of these differences is that a defi-ciency in micronutrients, which is uncommon and generally observed on a very small range of concentrations (Pilon-Smits et al., 2009), could lead to the absence of skewed species response curves at the lowest mi-cronutrient concentrations. Secondly, many mimi-cronutrients are toxic at a lower concentration threshold than macronutrients (Ernst, 2006; Pi-lon-Smits et al., 2009) and can profoundly affect the distribution of species, implying the presence of truncated curves at the highest values of micronutrient gradients. Additionally, at high micronutrient concen-tration levels species’ capacity to tolerate or accumulate those micronu-trients can be a determinant for the occurrence of a particular species, which may in turn lead to very low density of realised niche optima.
Metalliferous soils and related vegetation offer favourable conditions as a model to test the three identified patterns of realised species re-sponse curves along a micronutrient soil concentration gradient. These ecosystems are characterised by variety of taxa with distinct tolerance thresholds to metals; these plants are called metallophytes. Vegetation hosting metallophytes is associated with the presence of particular met-als in soil worldwide (Antonovics et al., 1971; Boyd, 2004; Ernst, 2006; Hall, 2002; Macnair, 1987; Pollard, 2000). Metallophyte taxa can be defined as ‘absolute’ if all individuals occur on metalliferous soils and ‘facultative’ if more than 25% of individuals occur on nor-mal soils. Vegetation composed of both absolute and facultative metal-lophyte taxa, accompanied with other non-tolerant taxa, is expected to present a high diversity of species response curves (in terms of distrib-ution shape) and a heterogeneous density of optima along metal gradi-ents.
Copper (Cu) and Cobalt (Co) are trace metal elements in soils, and their presence depends on their parent materials (Hough, 2010; Ma and Hooda, 2010). Average total content in soil is around 30mgkg−1 dry weight for Cu and 8mgkg−1 for Co with slight differences be-tween Geographical Zones (Alloway, 1995; Aubert and Pinta, 1980; Hough, 2010; Lopes, 1980; McLean and Bledsoe, 1992). Depend-ing on the soil properties, a proportion of total metal concentration is available for plants and microbes (Degryse et al., 2009). Cu is known as an essential redox-active micronutrient for plants; the role of Co is still being identified, but it could be considered as a beneficial element (Pilon-Smits et al., 2009; Yruela, 2005). They are both found at less than 10mgkg−1dry weight in plant tissues (Palit et al., 1994; Yru-ela, 2005). Toxicity or deficiency thresholds of metal are species- or population-dependent. Elevated concentrations of these metals induce toxic effects such as inhibition of various processes in plant metabolism (Prasad and Hagemeyer, 1999) while deficiency is uncommon (Foy et al., 1978; Pilon-Smits et al., 2009; Yruela, 2005).
The metalliferous grasslands of the south-eastern D.R. Congo repre-sent highly unusual vegetation where community types are dependent on copper and cobalt concentrations in soils (Duvigneaud and De-naeyer-De Smet, 1963; Malaisse et al., 2016). Available metal con-centrations here reach approximately 300 times those in the predomi
nant soils of the region, creating unique edaphic conditions and, thus, a succession of plant communities along metal soil concentration gradi-ents (Delhaye et al., 2016; Saad et al., 2012; Séleck et al., 2013). These plant communities host more than 550 species including 56 en-demic taxa which are absolute or facultative metallophytes (Faucon et al., 2010; Leteinturier, 2002; Malaisse et al., 2016). The economic value of Cu and Co encourages mining activities in the region, and this has consequences on the vegetation. More than 75% of endemic taxa are threatened (VU, EN, CR) according to IUCN criteria (Faucon et al., 2010). Restoration efforts are currently being implemented, but their success is highly dependent on a good understanding of vegetation-soil patterns. Although some recent studies have been implemented at a community (Delhaye et al., 2016; Ilunga wa Ilunga et al., 2015, 2013) or species scale (Boisson et al., 2017, Boisson et al., 2016, 2016b; Chipeng et al., 2010; Lange et al., 2014), no one has ad-dressed a quantitative overview of flora distribution along the gradients of selective edaphic factors: i.e. copper and cobalt soil concentrations.
Considering this as an opportunity to make a theoretical and prac-tical contribution to science, the present study aims to characterise the patterns of one-dimensional realised niche distribution of plant species along two micronutrient soil concentration gradients. We tested the exis-tence of three patterns along copper and cobalt soil concentration gradi-ents: (1) the uneven distribution of optima along the gradients; (2) neg-ative correlation between the niche optima density and the niche width; and (3) negative correlation between the skewness coefficient and metal soil concentration. Finally, we discussed how patterns of niche distribu-tion can inform ecological restoradistribu-tion strategies.
2. Method
2.1. Study area and vegetation
This study was performed in the Katangan Copperbelt (D.R. Congo). The annual average precipitation of about 1174mm is concentrated in the wet season (November – March). The average daily temperature during the wet season is 20.2°C, and the temperature ranges between 15-17℃ at the beginning of the dry season (Kazadi and Kaoru, 1996). 2.2. Vegetation sampling and soil analysis
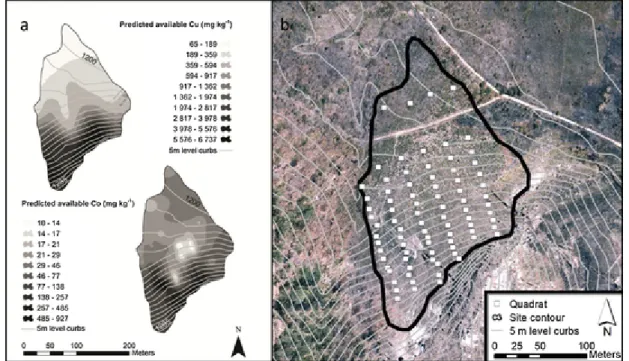
In two separate trips undertaken in March 2008 and 2009, 172 square meter plots (1m2) were established on three natural sites in the area between Tenke and Fungurume towns, on the Fungurume V, Kav-ifwafwaulu [1] and Kazinyanga outcrops (Table 1). For each site, sam-pling was performed according to a systematic grid following six to eight parallel transects stretched from the bottom to the top of the hill. Plots were located at nodes between transects and level curbs, every 5m in altitude (Fig. 1b).
In each plot, all present plant taxa were identified at the botanic species or variety level. Identification of specimens was based on the African Plant Database (Conservatoire et Jardin Botanique de la ville de Genève and South African National Biodiversity Institute – Pretoria 2013). Due to the lack of recent taxonomic revision, some individuals
Table 1
Site, hill, geographical coordinates (utm), sampled area (ha), number of sampling plots and minimum and maximum copper and cobalt concentrations (mg kg−1) of three hills of Katangan copper belt (Fungurume V, Kavifwafwaulu and Kazinyanga) measured by flame atomic absorption spectroscopy after EDTA extraction. Each concentration is an average of measured concentration of 4 quadrat soil samples.
Site Geographical coordinates (utm) Sampled area (ha) Number of plots [Cu] (mg kg−1) [Co] (mg kg− 1)
X Y Min Max Min Max
Fungurume V 422276 8826409 25.9 83 92 6737 6 927
Kavifwafwaulu [1] 407436 8830457 11.9 37 29 7559 2 65
UNCORRECTED
PROOF
Fig. 1. Predicted value of copper and cobalt concentrations on one copper hill, Fungurume V (a) and the location of the performed sampling plots (b).could not be identified at the species level; these were instead individu-alised at putative species level.
One composite soil sample was made from four soil subsamples col-lected at the four corners of each plot at a depth of 15cm. Each compos-ite sample soil was air-dried and sieved to 2mm prior to physio-chem-ical analyses. Soil extractable concentrations of Cu and Co were mea-sured using 0.5N ammonium acetate-EDTA (CH3COONH4–EDTA ; (Lakanen and Erviö, 1971). The extraction soil/solution ratio was fixed to 1:5 using a buffer at pH 4.65 (Kucak and Blanuša, 1998). Finally, metal concentrations were measured in the filtrate (the filter used was S&S-595-½) via flame atomic absorption spectroscopy (VAR-IAN 220), after which the solution was stirred for 30min.
Taxa present in a minimum of 7 plots were selected, and their species response curves modelled. Many statistical methods provide models for one or more environmental variables (Austin, 2007; Austin and Mey-ers, 1996; Guisan et al., 2002; Guisan and Zimmermann, 2000; Meynard and Quinn, 2007; Oksanen and Minchin, 2002) but the generalised additive model (GAM, Hastie and Tibshirani, 1990;; Yee and Mitchell, 1991) does not require any assumption regarding the shape of the response curves to environmental factors (Oksanen and Minchin, 2002). For this reason, we selected this model with bino-mial likelihood to model the probability of occurrence for each selected species along the two gradients: available Cu and Co soil concentrations. For each taxon, the best fitted model from three degrees of smoothing (3, 4 or 5) was selected with the Aikaike Information Criterion (AIC), choosing the model with the lowest AIC value.
The niche optimum for each species along the two soil concentra-tion gradients was estimated using the projected value of the highest probability of occurrence on the x-axis. The borders of niche width (am-plitude) were determined by projecting the lower and upper limits (LL and UL respectively) of 80% of the area under the curve centred on the optimum on the x-axis (Gégout and Pierrat, 1998). Niche width was calculated via the difference between UL and LL. Statistical mod-elling and values extraction were performed via a function GAM.sum-mary (Appendix E) operating with ‘mgcv’ library (Wood, 2006) in the R statistical software to model response curves with GAMs. This func-tion is able to generate response curves using the parameters of the model and append the curve of each factor included in the dataset. The existence of the three above-mentioned patterns was experimentally
demonstrated the following ways: (1) to test an uneven distribution of niche optima along the Cu-Co gradient, we used a kernel density func-tion (density funcfunc-tion uses the Fourier transformafunc-tion and applies a lin-ear approximation to model a curve of optima density (y-axis) along gra-dients (x-axis)); (2) to test the relationship between the optima density and the niche width a Pearson’s correlation was performed; and (3) to test the relationship between the skewness and the optima location, the skewness of species response curves was determined using Fisher’s coef-ficient (Fisher, 1930):
where is the third central moment and is the standard deviation. Each response curve can be assimilated to probability density function with an area under the curve (A) higher than 1. Mathematical expecta-tions were thus defined as
where m is the number of rectangles, is , is the proba-bility of occurrence of species , and is the sum of rectangles areas. For the calculation: m=1000 and = maximum measured value of copper or cobalt. Mathematical expectations were used to estimate V(x), the variance (second central moment) of each response curve and the nthcentral moment. Finally, linear regressions were respectively used to quantify the relationship of the niche optima of taxa between Cu and Co gradients and to determinate the relationship between skewness coeffi-cients and optima values along gradients. All statistical analyses were executed under R Statistical Software (R Development Core Team, 2010).
3. Results
3.1. Data ranges and metal concentration gradients
Across the three studied sites, Cu concentrations ranged from 29mgkg−1to 10 136mgkg−1 and Co from 2mgkg−1 to 927mgkg−1 (Table 1). The Spearman’s rank correlation coefficient between copper and cobalt concentrations was 0.61 (p–value < 0.05).
UNCORRECTED
PROOF
S. Boisson et al. Ecological Modelling xxx (xxxx) xxx-xxx
3.2. Species distribution overview
Out of 184 taxa in the dataset, 80 occurred in at least seven plots (Appendix A, Taxa list: Appendix B, models: Appendix C). Along Cu and Co concentration gradients, three types of distributions showed similar patterns based on the niche optima position and the response curves. More than half of taxa yielded truncated response curves with tails to-ward the highest concentrations or, inversely, with tails toto-ward the low-est concentrations. The remaining taxa displayed clearly defined niche optima (i.e. being unequal to LL or UL) along the gradients.
Along the copper soil concentration gradient, 40 taxa presented niche optima at the lowest value (29mgkg−1 Cu, Fig. 2), 31 taxa had optima ranging from 453 to 7 467mgkg−1Cu (Fig. 2), and nine taxa had their niche optima at the highest value of the gradient (10,136mgkg−1 Cu, Fig. 2, Appendix C). Along the cobalt soil con-centration gradient, 45 taxa positioned their niche optima at the low-est value (i.e. 2mgkg−1Co, Fig. 3, Appendix D), 27 taxa with niche optima ranging from 26 to 664mgkg−1Co were identified, and seven taxa had niche optima at the highest value of the concentration gra-dient (927mgkg-1Co, Fig. 3). The Pearson correlation coefficient be-tween the copper and the cobalt optimum values was 0.38 (p–value < 0.001). 61% of total taxa (49 taxa) displayed similar niche optima posi-tions along both the copper and cobalt concentration gradients. 3.3. Pattern 1: Uneven distribution of optima along the gradients
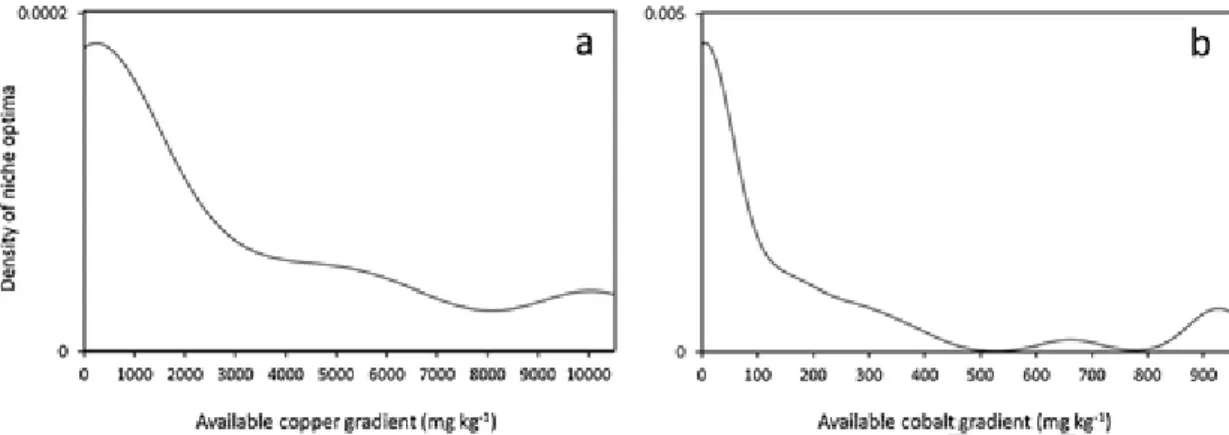
The distribution of optima was uneven along the concentration gra-dients of both metals, with a high variation recorded for cobalt. In general, the density of optima was the highest in low metal concen-trations (43 taxa between 0–1 000mgkg−1 Cu and 49 taxa between 0–100mgkg-1Co) and decreased with increasing metals concentrations (Fig. 4). For the cobalt concentration gradient only, density of niche op-tima approached zero (lower than 5.10-5) at concentrations from 530 to 780mgkg-1(Fig. 4b).
3.4. Pattern 2: Negative correlation between niche optima density and niche width
The niche width of taxa was negatively correlated with the density of their niche optima along the copper and the cobalt concentration gra-dients. For the copper gradient, the niche widths of taxa decreased with increasing density of niche optima for all taxa (r = -0.75; p–value < 0.001) and also for Group 2 (r = -0.68; p–value < 0.001). For the cobalt gradient, a similar relationship was observed for all taxa (r = -0.61; p–value < 0.001) and also for taxa with clearly defined niche optima (r = -0.69; p–value < 0.001). The niche widths of taxa were the nar-rowest in the lowest concentrations along both metal soil concentration gradients.
3.5. Pattern 3: Negative correlation between the skewness coefficient and niche optima
The skewness coefficient of niches was significantly negatively cor-related with copper optima locations for all taxa (r = -0.81; p–value < 0.001) and for taxa with clearly defined niche optima (r = -0.72; p–value < 0.001). One-dimensional realised niches were more sym-metric when optima ranged between 4 000 and 6 000mgkg−1 (Fig. 5a). Along the cobalt gradient, skewness coefficients had similar re-lationships with the niche widths for all taxa (r = -0.69; p–value < 0.001) and for taxa with clearly defined niche optima (r= -0.54; p–value < 0.001). Symmetry of species response curves was encoun-tered at 150mgkg-1for taxa with clearly defined niche optima and at 500mgkg-1for all taxa (Fig. 5b). Along these two metal soil concen-tration gradients, the taxa whose niche optima were located at the low-est metal concentrations had response curves with tails towards the
highest concentrations, while the taxa whose niche optima were located in the highest metal concentrations displayed curves with tails towards the lowest concentrations.
4. Discussion
4.1. General patterns of realised niche distribution along the metal concentration gradients
The niche concept is complex and species response curves along con-centration gradients of available soil metals depend on several edaphic factors (Austin, 2007; Soberón and Nakamura, 2009; Whittaker et al., 1973). However, this study has highlighted that the pattern of realised niche distributions identified along macronutrient soil con-centration gradients is in some ways similar to those along the mi-cronutrient gradients of copper and cobalt. Most taxa displayed realised niche optima in metal concentrations lower than 2 500mgkg−1 Cu and 100mgkg−1Co, and presented the narrowest realised niche width. These results suggest that mesic conditions exist at the lowest concen-trations of the copper and cobalt gradients up to values of respectively 2 500mgkg−1Cu and 100mgkg−1Co. Close to the limits of these soil concentration gradients, the response curves were skewed with a longer tail into the centre of the gradients.
Although the correlation between copper and cobalt realised niche optima was significant, the correlation coefficient was relatively low. This clearly indicates that a particular taxon does not necessarily oc-cur in the same range of concentrations along each gradient (defined by Groups 1, 2 and 3). For example, the taxon Crotalaria cobalticola (Fabaceae) was located in Group 3 for copper, signifying that the species optimum occurred in the highest concentrations, while its optimum (realised niche) occurred in the lowest concentrations in Group 1 for cobalt.
4.2. Origins and consequences of observed patterns
The highest optima density being identified at the lowest metal con-centrations suggests that competition should be a determinant factor leading to narrow niche width by the competitive exclusion principle (Grime, 1973; Hardin, 1960). This has consequences for the plant-soil relationship as highlighted by previous studies on metalliferous veg-etation (Saad et al., 2012; Séleck et al., 2013), which has been shown to be more common in the steppic savannah (0–3 500mgkg−1 Cu; 0–100mgkg−1Co) than in the steppe (3 500 – 10 000mgkg−1Cu; 100 – 1 000mgkg−1Co). Séleck et al (2013) highlighted 7 vegetation parts in those plant communities in which 6 are structured as a contin-uum along the copper and the cobalt gradient. Competition has recently been identified by Delhaye et al. (2016) as being higher in the lowest copper-cobalt concentration, confirming the uneven distribution of op-tima found in this study.
Variation of niche width has previously been highlighted along the copper soil concentration gradient for taxa occurring on a another site near Lubumbashi (Ilunga wa Ilunga et al., 2013) and for endemic species (Boisson et al., 2016c). However, some exceptions could be observed for some taxa such as the grass Loudetia simplex, which dis-played a niche optimum equal to the lowest copper-cobalt gradient limit (LL) but nevertheless was shown to have a broad niche width. This ob-servation corroborated previous occurrence obob-servations for the same species in two plant communities, steppes and steppic savannah (Bois-son et al., 2016a; Duvigneaud and Denaeyer-De Smet, 1963), and suggests that the species has a wide range of tolerance to soil concen-trations of metals compared to taxa with narrow realised niches in the same group, for example, Aeschynomene pygmaea.
The broad realised niches of some taxa could result from the high population variations between different realised niches, considering that soil metal concentrations exert a strong selective pressure on plants (Antonovics et al., 1971; Baker et al., 2010; Shaw, 1990; Whit-ing et al., 2002), and that the metal concentrations varied be
UNCORRECTED
PROOF
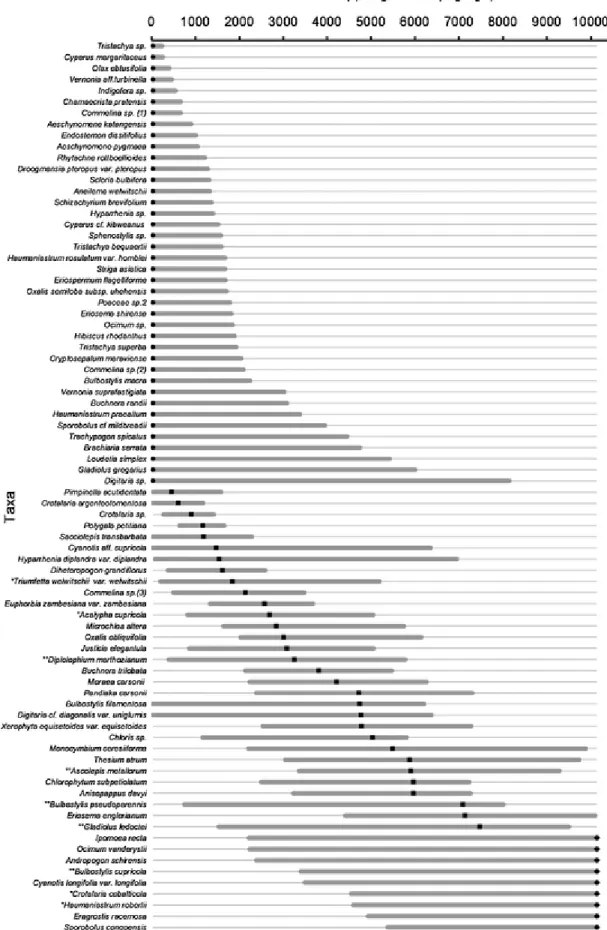
Fig. 2. Modelled realised niches sorted by niche optima along available copper gradient (29 to 10 136mgkg−1) by generalised additive models (GAMs) for 80 metallophyte taxa in the Katanga Copperbelt. Plain dots, squares and diamonds are the niche optima of taxa determined by the gradient value of the highest probability of occurrence for Group 1, 2 and 3, respec-tively. Straight lines are the niche widths calculated by the difference between the borders of area of 80% under GAM-curve.
UNCORRECTED
PROOF
S. Boisson et al. Ecological Modelling xxx (xxxx) xxx-xxx
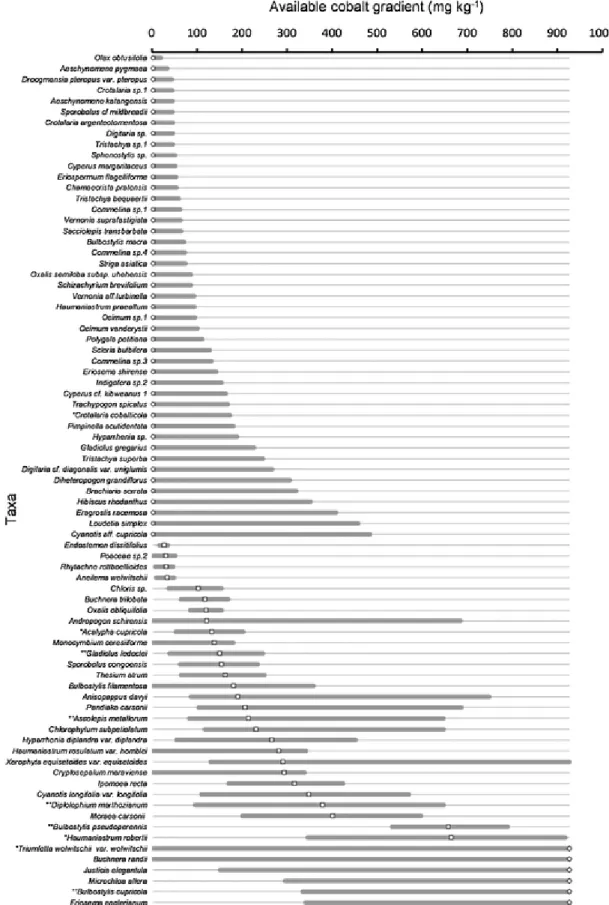
Fig. 3. Modelled realised niches sorted by niche optima along available cobalt gradient (2–927mgkg−1) by generalised additive models (GAMs) for 80 metallophyte taxa in the Katanga Copperbelt. Empty dots, squares and diamonds are the niche optima of taxa determined by the gradient value of the highest probability of occurrence for Group 1, 2 and 3, respectively. Straight lines are the niche widths calculated by the difference between the borders of area of 80% under GAM-curve.
UNCORRECTED
PROOF
Fig. 4. Kernel density estimations of taxa optima distribution along copper and cobalt gradient (mg kg−1).Fig. 5. Skewness coefficients relationship with the copper and cobalt optima positions for the 80 identified taxa from the three groups. Plain or empty dots, squares and diamonds are
the niche optima for respectively Group 1, 2 and 3 along copper/cobalt gradient. (a) Linear regression of skewness coefficients along copper niche optima. (b) Linear regression of the skewness coefficients along cobalt niche optima.
tween and across sites. Adaptation and differentiation are also promoted by extreme dispersal limitations (Ackerly, 2003), which can occur in the plant taxa of the copper hills. The taxa could also show differences in realised niches between individuals; individuals could be specialised to distinct ranges of concentrations along the soil metal gradients (Bol-nick et al., 2007). Determination of the fundamental niche of distinct individuals from a single population of a taxon could us help to under-stand the origin of the broad realised niches (Boisson et al., 2017). Another study on one tolerant species from metalliferous soils suggested that niches may evolve relatively quickly in serpentines soils between ecotypes of Collinisia sparsiflora (Wright et al., 2006).
The skewed curves of the realised niches could be due to a pro-gressive decrease in physiological advantages for an extreme-adapting species until it is outperformed by more productive species (Austin and Smith, 1989; Austin and Gaywood, 1994), in accordance with the species coexistence theory. The relationship between the skewness and the optima location was not identical for both metals; this was as ex-pected because copper and cobalt do not have the same physiological role in plants. Copper is known as an essential redox-active micronu-trient while cobalt is identified as a beneficial element (Pilon-Smits et al., 2009; Yruela, 2005). Cobalt is expected to induce toxicity stress at lower concentrations than copper. In the context of our study, based on metalliferous outcrops, mesic conditions were expected to be 0–65mgkg−1 and 0–6mgkg−1of available copper and cobalt, respec-tively (Anderson et al., 1973; Colinet, 2013; Faucon et al., 2011; Ma and Hooda, 2010; McLean and Bledsoe, 1992).
Many factors are constantly in interaction and have an effect on metal bioavailability, including the total metal present in the soil, pH, clay and hydrous oxide content, organic matter and redox conditions (Reichman, 2002). Also, the bioavailability of nutrients and the met
als in the rhizosphere could change over an area according to local vari-ations in pH and the acidification ability of the plants (Marschner et al., 1986). By changing the availability of metal, these factors and re-lated interaction are subject to change the realised niche parameters (optimum, width, skewness) of the species by having distinct toxicity or resource effect.
4.3. Implications for ecological restoration
The three patterns identified in the realised niches of plant taxa along large copper and cobalt soil concentration gradients have con-sequences for ecological restoration strategies (Boisson et al., 2017; Young et al., 2005). Strategies for soil restoration and revegetation traditionally focus on the transfer of plant communities, with attempts to maintain populations of the main species (Society for Ecological Restoration, 2004). For metallophyte communities, reproduction of the natural realised niche patterns is required; this can be achieved by recreating the initial soil conditions. Changes in edaphic conditions com-pared with those found in the natural site in terms of Cu or Co soil con-centration gradients could drastically change plant-soil relationships and consequently plant-plant interaction. The non-simultaneous existence of any of these three patterns in a restored plant community pool could create vacant niche space and promote the colonisation of undesirable plants with broad niche widths (i.e. weeds).
The skewed curves of realised niches in combination with the niche optima-width relationship are complex to convert into practical restora-tive actions. This primarily suggests that the assemblage of taxa gradu-ally changes along the metal concentration gradient, and thus commu-nities of multiple taxa are associated with interdependent dominance in plant communities for any given metal concentration. When the taxa
UNCORRECTED
PROOF
S. Boisson et al. Ecological Modelling xxx (xxxx) xxx-xxx
are transferred to a restoration site, the assemblage should be repro-duced to respect the original pattern of the natural ecosystem and thereby ensure long term stability of the plant communities.
Species with narrow realised niche widths in the highest metal con-centrations are likely to be highly dependent on metals in the soil. For example, the absolute metallophyte Haumaniastrum robertii, with a nar-row realised niche in high metal concentrations, is recognised as the ‘copper flower’ and is not able to grow in low Cu and Co soil concen-trations (Ilunga Kabeya et al., 2018). The taxa with broad realised niches in low Cu and Co soil concentrations are associated with a com-munity of taxa producing a large biomass (Delhaye et al., 2016) and high competition for light and nutrients.
To better ensure the success of restoration strategies at taxa scale, study of the fundamental niches (as suggested to understand population variations) could help us to understand the relationship between these taxa and the presence of metals in the soil. The species with niche op-tima in the highest metal concentrations and a broad niche width pro-vide an opportunity to test these plants’ efficacy in rehabilitation strate-gies, such as Crepidorhopalon perennis and Andropogon shirensis (metal tolerant grass), in the Katangan Copperbelt (Boisson et al., 2016a; Faucon et al., 2011).
Identifying the distribution pattern of realised niches along micronu-trient soil concentration gradients helps significantly in disentangling ecosystem interactions. While the concept of the ecological niche has been somewhat neglected over the last decade, this multidisciplinary ap-proach is useful in linking together a range of theoretical concepts in plant ecology. In this context, the further study of the distribution of realised niches along other soil micronutrient or element concentration gradients appears to be scientifically relevant and could provide practi-cal solutions for restoration purposes.
5. Conclusion
The model-based studies about the realised niche of metallophyte are rare. In this study, the usage of model considerably helps to iden-tify the realised niche of metallophyte along copper and cobalt gradi-ent. The results in term of optimum and width (i.e. positive correla-tion) match with field observation and other scientific papers about the same flora. Even if the skewness is a parameter that is difficult to inter-pret, we find that the pattern skewness-optimum corresponds with other studies about realised niche. Expected patterns along macronutrient are confirmed along micronutrient excepted for the skewness-optimum rela-tionship with slight differences between copper and cobalt.
Acknowledgments
The authors gratefully thank Soizig Le Stradic, Julie Lebrun, Ezana Semerab, David Zeleny and Arielle Guillaume for the field study. This study was made possible thanks to the financial support of theFonds de la Recherche dans l’Industrie et dans l’Agriculture (FRIA) of the FNRS (Fonds National de la Recherche Scientifique), Belgium. Tenke Fungurume Mining SARL. provided all logistic support necessary to conduct this study.
Appendix A. Supplementary data
Supplementary material related to this article can be found, in the online version, at doi:https://doi.org/10.1016/j.ecolmodel.2019. 108861.
References
Ackerly, D., 2003. Community assembly, niche conservatism, and adaptive evolution in changing environments. Int. J. Plant Sci. 164, 164–184.
Alloway, B.J., 1995. Heavy Metals in Soils. Academic & Professional, Blackie.
Anderson, A.J., Meyer, D.R., Mayer, F.K., 1973. Heavy metal toxicities: levels of nickel, cobalt and chromium in the soil and plants associated with visual symptoms and vari-ation in growth of an oat crop. Aust. J. Agric. Res. 24, 557–571.
Antonovics, J., Bradshaw, A.D., Turner, R.G., 1971. Heavy metal tolerance in plants. Adv. Ecol. Res. 7, 1–85.
Aubert, H., Pinta, M., 1980. Trace elements in soils. In: Developments in Soil Science. El-sevier Science.
Austin, M., 2007. Species distribution models and ecological theory: a critical assess-ment and some possible new approaches. Ecol. Modell. 200, 1–19. doi:10.1016/ j.ecolmodel.2006.07.005.
Austin, M., 1987. Models for the analysis of species’ response to environmental gradients. Vegetatio 69, 35–45.
Austin, M., 1985. Continuum concept, ordination methods, and niche theory. Annu. Rev. Ecol. Syst. 16, 39–61.
Austin, M., Smith, T., 1989. A new model for the continuum concept. Vegetatio 83, 35–47. Austin, M.P., Gaywood, M.J., 1994. Current problems of environmental gradients and species response curves in relation to continuum theory. J. Veg. Sci. 5, 473–482. doi:10.2307/3235973.
Austin, M.P., Meyers, J., 1996. Current approaches to modelling the environmental niche of eucalypts: implication for management of forest biodiversity. For. Ecol. Manage. 85, 95–106. doi:10.1016/S0378-1127(96)03753-X.
Baker, A.J.M., Ernst, W.H.O., Van der Ent, A., Malaisse, F., Ginocchio, R., 2010. Metal-lophytes: the unique biological resource, its ecology and conservational status in Eu-rope, central Africa and latin America. In: Batty, L., Hallberg, K. (Eds.), Ecology of Industrial Pollution.. Cambridge University Press, Cambridge (UK), pp. 7–40. Bizoux, J., Brevers, F., Meerts, P., Graitson, E., Mahy, G., 2004. Ecology and
conserva-tion of Belgian populaconserva-tions of Viola calaminaria, a metallophyte with a restricted ge-ographic distribution. Belg. J. Bot. 137, 91–104.
Boisson, S., Faucon, M.-P.M.-P., Le Stradic, S., Lange, B., Verbruggen, N., Garin, O., Tshomba Wetshy, A., Séleck, M., Masengo Kalengo, W., Ngoy Shutcha, M., Mahy, G., Masengo Kalenga, W., Shutcha, M.N., Mahy, G., 2017. Specialized edaphic niches of threatened copper endemic plant species in the D.R. Congo: implications for ex situ conservation. Plant Soil 413, 261–273. doi:10.1007/s11104-016-3095-7.
Boisson, S., Le Stradic, S., Collignon, J., Séleck, M., Malaisse, F., Ngoy Shutcha, M., Fau-con, M.-P.M.P., Mahy, G., 2016. Potential of copper-tolerant grasses to implement phytostabilisation strategies on polluted soils in South D. R. Congo: poaceae candi-dates for phytostabilisation. Environ. Sci. Pollut. Res. 23, 13693–13705. doi:10.1007/ s11356-015-5442-2.
Boisson, S., Le Stradic, S., Commans, M., Dumont, A., Leclerc, N., Thomas, C., Mahy, G., 2016. Copper tolerance of three Crotalaria species from southeastern D. R. Congo at the early development stage. Biotechnol. Agron. Soc. Environ. 20, 151–160. Boisson, S., Monty, A., Lebrun, J., Séleck, M., Mahy, G., 2016. Edaphic niches of
metallo-phytes from southeastern Democratic Republic of Congo: implications for post-mining restoration. J. Nat. Conserv. 33, 18–24. doi:10.1016/j.jnc.2016.06.002.
Boisson, S., Ortmans, W., Maréchal, J., Majerus, M., Mahy, G., Monty, A., 2016. No copper required for germination of an endangered endemic species from the Katangan Cop-perbelt (Katanga, DR Congo): diplolophium marthozianum. Trop. Ecol. 57. Bolnick, D.I., Svanbäck, R., Araújo, M.S., Persson, L., 2007. Comparative support for
the niche variation hypothesis that more generalized populations also are more heterogeneous. Proc. Natl. Acad. Sci. U. S. A. 104, 10075–10079. doi:10.1073/ pnas.0703743104.
Boyd, R., 2004. Ecology of metal hyperaccumulation. New Phytol. 162, 563–567. Brady, K.U., Kruckeberg, A.R., Bradshaw, H.D., Jr., 2005. Evolutionary ecology of plant
adaptation to serpentine soils. Annu. Rev. Ecol. Evol. Syst. 36, 243–266. doi:10.1146/ annurev.ecolsys.35.021103.105730.
Chase, J., 2011. Ecological niche theory. In: Scheiner, S.M., Willig, M.R. (Eds.), The The-ory of Ecology.. University of Chicago Press, Chicago. p. 404.
Chase, J.M., Leibold, M.A., 2003. Ecological niches: linking classical and contemporary ap-proaches. In: Biodiversity & Conservation, Interspecific Interactions. University of Chicago Press. doi:10.1111/j.1442-9993.2004.01354.x.
Chipeng, F.K., Hermans, C., Colinet, G., Faucon, M.-P., Ngongo, M., Meerts, P., Ver-bruggen, N., 2010. Copper tolerance in the cuprophyte Haumaniastrum katangense (S.. Moore) P.A. Duvign. & Plancke. Plant Soil 328, 235–244. doi:10.1007/ s11104-009-0105-z.
Colinet, G., 2013. Average Available Copper and Cobalt Concentrations in Katanga. Coudun, C., Gégout, J.-C., 2006. The derivation of species response curves with Gaussian
logistic regression is sensitive to sampling intensity and curve characteristics. Ecol. Modell. 199, 164–175. doi:10.1016/j.ecolmodel.2006.05.024.
Degryse, F., Smolders, E., Parker, D.R., 2009. Partitioning of metals (Cd, Co, Cu, Ni, Pb, Zn) in soils: concepts, methodologies, prediction and applications - a review. Eur. J. Soil Sci. 60, 590–612. doi:10.1111/j.1365-2389.2009.01142.x.
Delhaye, G., Violle, C., Séleck, M., Ilunga wa Ilunga, E., Daubie, I., Mahy, G., Meerts, P., 2016. Plant traits variation along a copper-cobalt contamination gradient: a commu-nity-level perspective exploring the relative importance of species turnover and within species variation.. J. Veg. Sci..
Duvigneaud, P., Denaeyer-De Smet, S., 1963. Cuivre et végétation au Katanga [Copper and vegetation in Katanga]. Bull. la Société R. Bot. Belgique, Travaux du Centre scien-tifique et médical de l’Université libre de Bruxelles en Afrique centrale 96, 93–224. Ernst, W.H.O., 2006. Evolution of metal tolerance in higher plants. For. Snow Landsc. Res.
UNCORRECTED
PROOF
Faucon, M.-P., Meersseman, A., Shutcha, M.N., Mahy, G., Luhembwe, M.N., Malaisse, F.,Meerts, P., 2010. Copper endemism in the Congolese flora: a database of copper affin-ity and conservational value of cuprophytes. Plant Ecol. Evol. 143, 5–18. doi:10.5091/ plecevo.2010.411.
Faucon, M.-P., Parmentier, I., Colinet, G., Mahy, G., Ngongo Luhembwe, M., Meerts, P., 2011. May rare metallophytes benefit from disturbed soils following mining activ-ity? The case of the Crepidorhopalon tenuis in Katanga (D. R. Congo). Restor. Ecol. 19, 333–343. doi:10.1111/j.1526-100X.2009.00585.x.
Fisher, R., 1930. The moments of the distribution for normal samples of measures of de-parture from normality. Proc. R. Soc..
Foy, C., Chaney, R., White, M., 1978. The physiology of metal toxicity in plants. Annu. Rev. Plant Physiol. 29, 511–566.
Gégout, J.-C., Pierrat, J.-C., 1998. L’autécologie des espèces végétales: une approche par régression non paramétrique. Ecologie 29, 473–482.
Grime, J.P., 1973. Competitive exclusion in herbaceous vegetation. Nature 242, 344–347. doi:10.1038/242344a0.
Guisan, A., Edwards, T.C., Hastie, T., 2002. Generalized linear and generalized additive models in studies of species distributions: setting the scene. Ecol. Modell. 157, 89–100. doi:10.1016/S0304-3800(02)00204-1.
Guisan, A., Zimmermann, N.E., 2000. Predictive habitat distribution models in ecology. Ecol. Modell. 135, 147–186. doi:10.1016/S0304-3800(00)00354-9.
Hájková, P., Hájek, M., Apostolova, I., Zelený, D., Dítě, D., 2008. Shifts in the eco-logical behaviour of plant species between two distant regions: evidence from the base richness gradient in mires. J. Biogeogr. 35, 282–294. doi:10.1111/ j.1365-2699.2007.01793.x.
Hall, J.L., 2002. Cellular mechanisms for heavy metal detoxification and tolerance. J. Exp. Bot. 53, 1–11.
Hardin, G., 1960. The competitive exclusion principle. Science (80-. ) 131, 1292–1297. Hastie, T.J., Tibshirani, R.J., 1990. Generalized additive models. In: Chapman and Hall/
CRC Monographs on Statistics and Applied Probability Series. Chapman & Hall. Heikkinen, J., Mäkipää, R., 2010. Testing hypotheses on shape and distribution of
eco-logical response curves. Ecol. Modell. 221, 388–399. doi:10.1016/ j.ecolmodel.2009.10.030.
Higgins, S.I., O’Hara, R.B., Römermann, C., 2012. A niche for biology in species distribu-tion models. J. Biogeogr. 39, 2091–2095. doi:10.1111/jbi.12029.
Hough, R.L., 2010. Copper and lead. In: Trace Elements in Soils. John Wiley & Sons, Ltd, pp. 441–460. doi:10.1002/9781444319477.ch18.
Hutchinson, G., 1957. Concluding remarks. Cold Spring Harb. Symp. Quant. Biol. 22, 415–427.
Ilunga Kabeya, F., Pongrac, P., Lange, B., Faucon, M.-P., van Elteren, J.T., Šala, M., Šelih, V.S., Vanden Eeckhoudt, E., Verbruggen, N., 2018. Tolerance and accumulation of cobalt in three species of Haumaniastrum and the influence of copper. Environ. Exp. Bot. 149, 27–33. doi:10.1016/J.ENVEXPBOT.2018.01.018.
Ilunga wa Ilunga, E., Mahy, G., Piqueray, J., Séleck, M., Shutcha, M.N., Meerts, P., Faucon, M.-P., 2015. Plant functional traits as a promising tool for the ecological restoration of degraded tropical metal-rich habitats and revegetation of metal-rich bare soils: a case study in copper vegetation of Katanga. DRC. Ecol. Eng. 82, 214–221. doi:10.1016/ j.ecoleng.2015.04.084.
Ilunga wa Ilunga, E., Séleck, M., Colinet, G., Meerts, P., Mahy, G., 2013. Small-scale di-versity of plant communities and distribution of species niches on a copper rock out-crop in Upper Katanga, DR Congo. Plant Ecol. Evol. 146, 173–182. doi:10.5091/ plecevo.2013.816.
Kazadi, S., Kaoru, F., 1996. Interannual and long-term climate variability over the Zaire River Basin during the last 30 years. J. Geophys. Res. 101, 351–360.
Kruckeberg, A.R., 1992. Plant life of western North American ultramafics. In: Roberts, B.A., Proctor, J. (Eds.), (Eds.), The Ecology of Areas With Serpentinized Rocks: A World View.. Kluwer Academic Publishers, Dordrecht, pp. 31–73.
Kucak, A., Blanuša, M., 1998. Comparison of two extraction procedures for determination of trace metals in soil by atomic absorption spectrometry. Arh. Hig. Rada Toksikol. 49, 327–334.
Lakanen, E., Erviö, R., 1971. A comparison of eight extractants for the determination of plant available micronutrients in soil. Acta Agral. Fenn. 123, 223–232.
Lange, B., Faucon, M.-P., Meerts, P., Shutcha, M., Mahy, G., Pourret, O., 2014. Predic-tion of the edaphic factors influence upon the copper and cobalt accumulaPredic-tion in two
metallophytes using copper and cobalt speciation in soils. Plant Soil 379, 275–287. doi:10.1007/s11104-014-2068-y.
Lawesson, J., Oksanen, J., 2002. Niche characteristics of Danish woody species as derived from coenoclines. J. Veg. Sci. 279–290.
Leteinturier, B., 2002. Evaluation du potential phytocénotique des gisements cupriferes d’Afrique centro-australe en vue de la phytoremédiation de sites pollués par l’activité. Fac. des Sci. Agron. Gembloux..
Lopes, A.S., 1980. Micronutrients in soils of the tropics as constraints to food production. In: Priorities for Alleviating Soil-Related Constraints to Food Production in the Trop-ics. p. 468.
Ma, Y., Hooda, P.S., 2010. Chromium, nickel and cobalt. In: Trace Elements in Soils. John Wiley & Sons, Ltd, pp. 461–479.
Macnair, M., 1987. Heavy metal tolerance in plants: a model evolutionary system. Trends Ecol. Evol. (Amst.) 2, 354–359.
Malaisse, F., Schaijes, M., D’Outreligne, C., 2016. Copper-cobalt Flora of Upper Katanga and Copperbelt: field guide. Les Presses agronomiques de Gembloux.
Marschner, H., Römheld, V., Horst, W.J., Martin, P., 1986. Root-induced changes in the rhizosphere: importance for the mineral nutrition of plants. Zeitschrift für Pflanzen-ernährung und Bodenkd. 149, 441–456. doi:10.1002/jpln.19861490408.
McLean, J., Bledsoe, B.E., 1992. Behavior of metals in soils. Gr. Water Issue.
Meynard, C.N., Quinn, J.F., 2007. Predicting species distributions: a critical compari-son of the most common statistical models using artificial species. J. Biogeogr. 34, 1455–1469. doi:10.1111/j.1365-2699.2007.01720.x.
Minchin, P.R., 1989. Montane vegetation of the Mt. Field massif, Tasmania: a test of some hypotheses about properties of community patterns. Vegetatio 83, 97–110. doi:10.1007/BF00031683.
Oksanen, J., Minchin, P.R., 2002. Continuum theory revisited: what shape are species responses along ecological gradients? Ecol. Modell. 157, 119–129. doi:10.1016/ S0304-3800(02)00190-4.
Palit, S., Sharma, A., Talukder, G., 1994. Effects of cobalt on plants. Bot. Rev. 60, 149–181. doi:10.1007/BF02856575.
Pilon-Smits, E.A.H., Quinn, C.F., Tapken, W., Malagoli, M., Schiavon, M., 2009. Physiologi-cal functions of beneficial elements. Curr. Opin. Plant Biol. 12, 267–274. doi:10.1016/ j.pbi.2009.04.009.
Pollard, A., 2000. Metal hyperaccumulation: a model system for coevolutionary studies. New Phytol. 146, 179–181.
Prasad, M.V., Hagemeyer, J., 1999. Heavy Metal Stress in Plants: From Molecules to Ecosystems, Heavy Metal Stress in Plants: From Molecules to Ecosystems.
R Development Core Team, 2010. A Language and Environment for Statistical Computing. Vienna (Austria).
Reichman, S., 2002. The Responses of Plants to Metal Toxicity: A Review Focusing on Cop-per, Manganese & Zinc. Australian Minerals & Energy Environment Foundation. Rydgren, K., Økland, R.H., Økland, T., 2003. Species response curves along environmental
gradients. A case study from SE Norwegian swamp forests. J. Veg. Sci. 14, 869–880. doi:10.1111/j.1654-1103.2003.tb02220.x.
Saad, L., Parmentier, I., Colinet, G., Malaisse, F., Faucon, M.-P., Meerts, P., Mahy, G., 2012. Investigating the vegetation-soil relationships on the copper-cobalt rock outcrops of Katanga (D. R. Congo), an essential step in a biodiversity conservation plan. Restor. Ecol. 20, 405–415. doi:10.1111/j.1526-100X.2011.00786.x.
Séleck, M., Bizoux, J.-P., Colinet, G., Faucon, M.-P., Guillaume, A., Meerts, P., Piqueray, J., Mahy, G., 2013. Chemical soil factors influencing plant assemblages along cop-per-cobalt gradients: implications for conservation and restoration. Plant Soil 373, 455–469. doi:10.1007/s11104-013-1819-5.
Shaw, J., 1990. Heavy Metal Tolerance in Plants: Evolutionary Aspects. CRC Press Inc, New York.
Soberón, J., Nakamura, M., 2009. Niches and distributional areas: concepts, methods, and assumptions. Proc. Natl. Acad. Sci. 106, 19644–19650.
Society for Ecological Restoration, 2004. The SER International Primer on Ecological Restoration 2 https://doi.org/S34.
Whiting, S.N., Reeves, R.D., Baker, A.J.M., 2002. Conserving biodiversity: mining, metal-lophytes and land reclamation. Min. Environ. Manag. 10, 11–16.
Whittaker, R., Levin, S., Root, R., 1973. Niche, habitat, and ecotope. Am. Nat. 107, 321–338.
Wood, S., 2006. Generalized Additive Models: an Introduction With R. Chapman and Hall/ CRC Press.
UNCORRECTED
PROOF
S. Boisson et al. Ecological Modelling xxx (xxxx) xxx-xxx
Wright, J., Davies, K., Lau, J., McCall, A., McKay, J., 2006. Experimental verification of ecological niche modeling in a heterogeneous environment. Ecology 87, 2433–2439. Yee, T.W., Mitchell, N.D., 1991. Generalized additive models in plant ecology. J. Veg. Sci.
2, 587–602.
Young, T.P., Petersen, D., Clary, J.J., 2005. The ecology of restoration: historical links, emerging issues and unexplored realms. Ecol. Lett. 8, 662–673. doi:10.1111/ j.1461-0248.2005.00764.x.