HAL Id: hal-03217440
https://hal.archives-ouvertes.fr/hal-03217440
Submitted on 5 May 2021
HAL is a multi-disciplinary open access
archive for the deposit and dissemination of
sci-entific research documents, whether they are
pub-lished or not. The documents may come from
teaching and research institutions in France or
abroad, or from public or private research centers.
L’archive ouverte pluridisciplinaire HAL, est
destinée au dépôt et à la diffusion de documents
scientifiques de niveau recherche, publiés ou non,
émanant des établissements d’enseignement et de
recherche français ou étrangers, des laboratoires
publics ou privés.
Distributed under a Creative Commons Attribution| 4.0 International License
Levantine Sea (Eastern Mediterranean)
Fabrizio d’Ortenzio, V. Taillandier, H. Claustre, L. Coppola, P. Conan, F.
Dumas, X. Durrieu Du Madron, M. Fourrier, A. Gogou, A. Karageorgis, et al.
To cite this version:
Fabrizio d’Ortenzio, V. Taillandier, H. Claustre, L. Coppola, P. Conan, et al.. BGC-Argo Floats
Observe Nitrate Injection and Spring Phytoplankton Increase in the Surface Layer of Levantine Sea
(Eastern Mediterranean). Geophysical Research Letters, American Geophysical Union, 2021, 48 (8),
�10.1029/2020GL091649�. �hal-03217440�
1. Introduction
The Levantine Sea, the Mediterranean Sea's easternmost area, is considered as one of the most oligotroph-ic regions of the global ocean (Krom, Groom, & Zohary, 2003; Siokou-Frangou, Christaki, et al., 2010). In the Levantine, low-to-very-low values of phytoplankton primary production and chlorophyll-a (CHL) concentration have been obtained from both satellite (Bosc et al., 2004) and in situ (Manca et al., 2004)
Abstract
In the eastern Mediterranean Sea, satellites have observed events of spring surface-chlorophyll increase in the Rhodes Gyre region recurring intermittently. Few in situ biogeochemical data, however, exist to confirm their consistency, elucidate their seasonal characteristics, or discriminate among the possible drivers. During the year 2018, an array of BGC-Argo floats was deployed in the region, collecting the first-ever annual time series of in situ profiles of biogeochemical parameters in this area. Their observations demonstrated that nitrates, driven by mixed-layer dynamics, were available at surface from December 2018 onwards and could have sustained phytoplankton growth. Phytoplankton accumulation at the surface was observed by satellite only in March 2019 when the mixed-layer depth shoaled. These findings confirm that blooms occurring before the start of seasonal stratification are not easily recorded by satellite observations and reaffirm the need to consolidate the BGC-Argo network to establish time series of the evolution of biogeochemical processes.Plain Language Summary
The Levantine Sea, the easternmost area of Mediterranean Sea, is considered one of the poorest oceans on the Earth in terms of abundance of phytoplankton, the microscopic organisms that fuel the marine food web. However, historical data and satellite maps of chlorophyll (the pigment that reveals phytoplankton presence in the water) show episodic increases in the concentration of this pigment in the area near the island of Rhodes. To elucidate the characteristics of these events, a set of six robotic instruments (i.e. the BGC-Argo floats) was deployed in the Levantine Sea in 2018. A BGC-Argo float is an autonomous, free-floating instrument that makes oceanic observations over the first 2,000 m of the water column on a regular basis. This article presents an analysis of the data collected by these six robots. They provided the very first annual time series of biogeochemical observations in area, including during winter, when ship and satellite data are hard to collect. Our results reveal the increase in phytoplankton occurring before the start of seasonal stratification, increase that is not easily recorded by satellite observations and reaffirm the need to consolidate the BGC-Argo network to establish time series of the evolution of biogeochemical processes.© 2021.The Authors.
This is an open access article under the terms of the Creative Commons Attribution-NonCommercial-NoDerivs License, which permits use and distribution in any medium, provided the original work is properly cited, the use is non-commercial and no modifications or adaptations are made.
National Institute of Oceanography and Applied Geophysics - OGS, Sgonico (TS), Italy, Stazione Zoologica Anton Dohrn, SZN, Napoli, Italy, 11OSU Ecce Terra, UMS 3455, CNRS, Université Pierre et Marie Curie, Paris, France, 12 ACRI-ST, Sophia Antipolis, France
Correspondence to:
F. D'Ortenzio, dortenzio@obs-vflr.fr
Citation:
D'Ortenzio, F., Taillandier, V., Claustre, H., Coppola, L., Conan, P., Dumas, F., et al. (2021). BGC-Argo floats observe nitrate injection and spring phytoplankton increase in the surface layer of Levantine Sea (Eastern Mediterranean). Geophysical Research
Letters, 48, e2020GL091649. https://doi. org/10.1029/2020GL091649
Received 12 NOV 2020 Accepted 5 MAR 2021
observations. Surface nutrient availability in the region is generally deemed insufficient to sustain signifi-cant phytoplankton biomass (Siokou-Frangou, Christaki, et al., 2010). However, biogeographical analysis of time series of available Mediterranean ocean-color observations (D'Ortenzio & Ribera d'Alcalà, 2009; Mayot et al., 2016) slightly moderates this picture of a highly oligotrophic Levantine Sea. It has been shown that episodic but recurrent events of surface CHL increase occur during the winter-to-spring transition period in an area of the Levantine Sea located southeast of Rhodes Island known as the Rhodes region, as already mentioned by Antoine et al. (1995), using satellite data and by Vidussi et al. (2001), using in situ obser-vations. Nevertheless, these events of increased surface phytoplankton biomass in the Rhodes region are generally considered as having a feeble impact on the basin's widespread oligotrophic nature: Not only are they sporadic (out of the 16 years analyzed, they were observed 7 times, Mayot et al. [2016]), their absolute maximum concentrations also rarely exceed 1 mg m−3. Occasionally (as in D'Ortenzio, Ragni, et al. [2003],
Mayot et al. [2016], and in 2012, Pedrosa-Pàmies et al. [2016]), they are observed over a large surface area but they are generally short-lived. The accepted explanation for these events pertains to the prevailing physical conditions, characterized by a large-scale permanent cyclonic feature, generally referred to as the Rhodes Gyre (RG; Robinson et al., 2001). In the RG, nutrient stocks are permanently uplifted at shallow depths, and under cold and windy conditions, winter convection induces significant injection of nutrients in the sunlit layers, which, in turn, sustains moderate phytoplankton growth (Ediger & Yilmaz, 1996; Sali-hoǧlu et al., 1990; Souvermezoglou & Krasakopoulou, 1999). Accordingly, Ediger et al. (2005) showed that the upper layer of the RG and its peripheries reveal great temporal variations in both the abundance and composition of particulate matter, more plentiful during late winter–early spring when it reaches values comparable to those of the more productive NW Mediterranean basin. Similarly, Karageorgis et al. (2008) reported elevated values of beam attenuation coefficient due to particles (cp up to 0.5 m−1) during spring in
this sector of the Levantine Sea, pinpointing relatively enhanced particle concentrations presumably related to higher productivity and abundance of biogenic particles in the upper water column. Overall, then, the RG area seems to be the unique “oasis” within the desert-like Levantine area of the Eastern Mediterranean (Siokou-Frangou, Gotsis-Skreta, et al., 1999).
Although the RG is a privileged area for dense water formation events (Malanotte-Rizzoli, Manca, d'Alcala, et al., 1999), in particular by producing the Levantine Intermediate Water, a key water mass for the general circulation of the Mediterranean Sea (Robinson et al., 2001), the vertical distribution and the temporal evo-lution of nutrient stocks are predominantly driven by the mixed layer depth (MLD; Lascaratos et al., 1993). The MLD dynamics are therefore likely to be the primary factor in controlling the uptake and the availabil-ity of nutrients in the upper layers, and then, ultimately, of phytoplankton growth (Napolitano et al., 2000; Pedrosa-Pàmies et al., 2016; Varkitzi et al., 2020).
This overall picture, which emerged from a series of intense in situ surveys of the area performed in the 1990s (Malanotte-Rizzoli, Manca, Marullo, et al., 2003 and references therein), is, however, still not com-pletely satisfactory. First, the MLD evolution, its interplay with the subsurface nutrient stock and the result-ing phytoplankton response, are still not fully characterized, mainly because high-frequency and spatially resolved in situ data are largely insufficient. In particular, in situ data of CHL and nutrient concentrations are dramatically scarce in the RG and practically non-existent during the winter-to-spring period when CHL increase events are episodically recorded by satellite. Second, the generally rapid and intermittent na-ture of these CHL increase events (Mayot et al., 2016) is still largely unresolved. Furthermore, ocean-color observations are subject to several limitations (e.g. cloud cover, atmospheric correction and chlorophyll algorithm failures), especially in the Mediterranean Sea (Volpe et al., 2007), hence raising the question of the capability of remote sensing to satisfactorily gauge phytoplankton increase.
For these reasons, the available observations are, as a whole, presently inadequate for confirming the pre-sumed biogeochemical dynamics of the RG. Specifically, the lack of comprehensive year-long in situ mon-itoring of the area has hindered the establishing of a full understanding of the physical/biogeochemical interplay.
To mitigate this chronic scarcity of data, and with the explicit objective of better characterizing the bio-geochemical dynamics of the area and its main forcing factors, an array of BGC-Argo floats was deployed widely during the 2018–2019 period. Floats operations were carried out within the broader framework of an intense in situ survey of the Levantine Sea, the Pelagic Ecosystem Response to deep water formation in
the Levantine Experiment (PERLE): Six BGC-Argo floats (Leymarie et al., 2013) from French Novel Argo Ocean observing System (NAOS; D'Ortenzio, Taillandier, et al., 2020) and from Argo-Italy projects were deployed.
Among the main macronutrients relevant for phytoplankton growth, BGC-Argo floats can presently meas-ure only nitrate (NO3) concentration. In particular, floats are not able to measure phosphates, which are
considered the main limiting macronutrient in the Eastern Mediterranean (Krom, Emeis, & Van Cappel-len, 2010 and references therein). The recurrent observation of phytoplankton growth in the RG, howev-er, indicates that phosphorus limitation is episodically mitigated and that environmental abiotic condi-tions temporally change to induce phytoplankton growth. Taking into account the observational limits of BGC-Argo, we hence focus this study on analysis of the interplay between MLD and NO3 distribution, with
the ultimate goal of evaluating their influence on phytoplankton growth. Further analyses dedicated to bio-geochemical processes and based on the PERLE cruise strategy are ongoing and will not be presented here. This study consequently presents an analysis of the BGC-Argo float observations, combined with the avail-able satellite data (sea surface temperature and ocean color). In situ data of PERLE surveys are also referred to, in particular for the calibration of the floats' bio-optical sensors to support the autonomously obtained data.
2. Data and Methods
2.1. PERLE Cruises
Three large-scale cruises were conducted in the Levantine Sea during the period 2018–2019: PERLE-0 (May 2018), PERLE-1 (October 2018) and PERLE-2 (March to April 2019). CTD (conductivity, temperature, depth) casts were performed at all the stations. NO3 concentrations were also evaluated at every station by
sampling water at fixed depths and further analyzing with a colorimetric method using an Auto-Analyz-er continuous flow analysis system (Aminot & Kérouel, 2007). Water-column CHL (through High Perfor-mance Liquid Chromatography (HPLC) analysis, Ras et al., 2008) was assessed through discrete sampling at approximately one-third of the PERLE stations. Two groups of PERLE stations are used here: A first group (referred in the next as CAL in situ stations), which is composed of the stations of deployment and recovery of floats, is used for sensor calibration (for NO3) and data quality control (for both NO3 and CHL) of the
BGC-Argo sensors; a second group (referred in the next as VAL in situ stations) is used to qualitatively assess the BGC-Argo and satellite observations in the area (the positions of the two groups of stations are shown in Figure S1; Figure 1 shows the positions of the VAL stations).
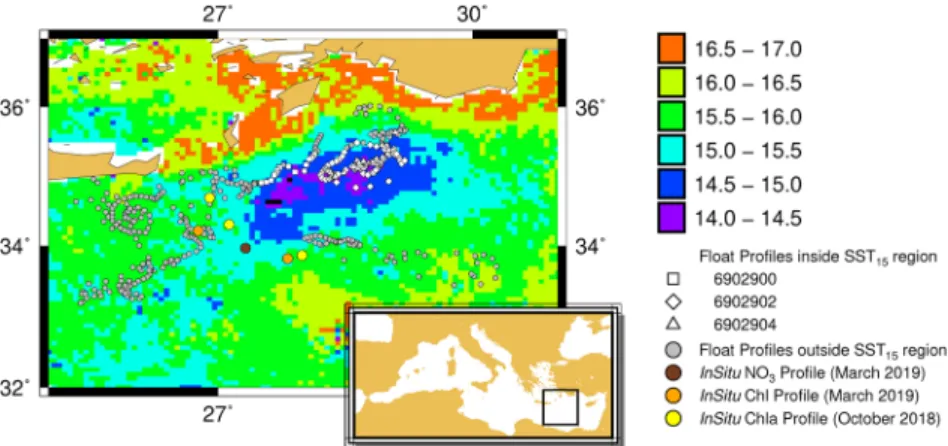
Figure 1. Map of sea surface temperature (SST) annual absolute minima, with the locations of all BGC-Argo profiles
(each point represents a profile). White marks indicate the location of BGC-Argo profiles within the SST15 region
(squares for float 6902900, diamonds for float 6902902, triangles for float 6902904), whereas gray dots indicate the location of profiles outside the SST15 region, independently of the float. The locations of ship-based profiles of VAL
stations used for qualitative comparison with floats are also plotted: CHL profiles in October 2018 (yellow dots), CHL profiles in March 2019 (orange dots), NO3 profiles in October 2019 (dark-brown dots).
2.2. BGC-Argo Floats
Six BGC-Argo floats were deployed in the Levantine basin (see Figure S1 map of BGC-Argo deployment points) over the 2018–2019 period. All the floats were equipped with temperature, salinity and PAR (Photo-synthetically Active Radiation) sensors, a fluorometer for CHL and a backscattering sensor used to measure the volume scattering coefficient measured at an angle of 124° at 700 nm and subsequently converted to a particulate backscattering coefficient (bbp, in m−1, following Schmechtig, Poteau, Claustre, D'Ortenzio,
Dall'Olmo, and Boss [2018]), which is considered a proxy for particulate organic carbon concentration (Boss & Pegau, 2001). Four floats were additionally equipped with NO3 concentration sensors (Suna™
Satlan-tic). Two floats have been recovered and four were still operational in October 2020. BGC-Argo data were obtained from the Coriolis Data Assembly Center. Considering that some floats are not yet validated in Delayed Mode as they are still operational at the time of writing (October 2020), values for CHL, bbp, and
NO3 were derived from the available raw data. We followed precisely the standard BGC-Argo algorithms as
indicated by Johnson et al. (2018) and by Schmechtig, Poteau, Claustre, D'Ortenzio, and Boss (2015) and Schmechtig, Poteau, Claustre, D'Ortenzio, Dall'Olmo, and Boss (2018). For NO3 data, an additional
adjust-ment of the standard calibration was performed, by using ancillary measureadjust-ments obtained on the CAL in
situ stations. Details of the processing of NO3 and CHL profiles are presented in the supporting information
(Text S1, Figures S2 and S3).
2.3. Satellite Observations
Sea surface temperature (SST) and ocean-color surface CHL observations were provided by the Copernicus Marine Service and CNR-ISAC Rome, respectively. Mediterranean daily products at 1/6° spatial resolution for SST and at 1 km for surface CHL were downloaded and remapped on the Levantine region. For each pixel in the interest area, a time series of SST values was extracted for the fall 2018-summer 2019 period. For each time series, the annual absolute minimum value was identified (i.e. the lowest SST values during the period fall 2018-summer 2019). The obtained values were then mapped (Figure 1). Almost all the SST minima values were recorded in February 2019 (data not shown).
2.4. Selection of Float Profiles and Reconstruction of Time Series
The positions of the BGC-Argo profiles in the Levantine area for the period from October 2018 to May 2019 are indicated in Figure 1, superimposed on the map of the annual satellite SST minima. From the SST min-ima map, all pixels having values lower than 15°C were further used to identify the region where the mixed layer cooled the most (Marullo et al., 2003). The resulting region (hereafter referred to as SST15) marks a
large area south of Rhodes and east of Crete (Figure 1), which comprises the coldest SST of the Levantine Sea. We considered that these values delineate the area where mixing was likely to have occurred and where nutrient injection may have been subsequently favored (Marullo et al., 2003; Napolitano et al., 2000; Vidussi et al., 2001).
Choosing to focus on the BGC-Argo profiles within the SST15 area (white marks in Figure 1), we
recon-structed time series over the period October 2018–May 2019 (Figure 2, panel a) for MLD (using the density threshold value of 0.03 kg m-3 as in D'Ortenzio, Iudicone, et al. [2005]), for the depth of the lower limit of
the nitrate depleted layer (NDL; Omand & Mahadevan, 2015), the depth of the isoline 5 µmol L-1 of nitrate
(used as an indicator of the deep stock of nitrate) and the depth of the isoline 0.415 mole photons m−2 day−1
(indicating the minimum light level above which phytoplankton growth potentially occurs, Mignot, Claus-tre, et al., 2014). For each profile, NDL depth is computed as following: if the nitrate concentration is not null in the mixed layer, the NDL depth is set to the surface (0 m). If not, the NDL depth is estimated by the depth of the nitrate depletion density, which is the deepest isopycnal at which nitrate concentration is zero (Omand & Mahadevan, 2015). The nitrate depletion density is estimated by the intercept of the regression line reported in a nitrate-density diagram. From the same subset of profiles, surface time series were gener-ated for NO3 concentrations averaged over the mixed layer (NO3MLD), and for CHL and bbp averaged over the
first 10 m, if at least 9 records at 1 m resolution were available (Figure 2, panels b–d, respectively).
The time series inside the SST15 region were generated by the sampling of the three floats 6902900, 6902902,
NO3MLD and in Figure S4 for the other parameters. Finally, a time series of daily satellite surface CHL
concentration was also derived, by averaging all available satellite ocean-color pixels over the region SST15.
Surface CHL and NO3MLD were also calculated from discrete in situ profiles collected at VAL stations during
the PERLE-1 and the PERLE-2 surveys. We used the in situ samples collected in the 0–10 m layer (only one observation per profile available). The VAL stations selected were those most adjacent to the SST15 region
Figure 2. Time series derived from subsets of BGC-Argo floats. Panel (a) MLD (gray dots and area), NDL depth
(red dots and line), depth of the NO3 isoline of 5 μmol L-1 (brown line), depth of the isoline 0.415 mole photons
m−2 day−1 (base of yellow area). Note that NDL values equal to zero indicate that the NDL is non-existent (i.e. the NO 3
concentrations present at the surface are greater than the detection limit). Dots are maintained in the plot to indicate that profiles are available. Panel (b) time series of depth averaged NO3MLD concentration from BGC-Argo floats (brown
dots and line for profiles inside the SST15 region; mustard yellow points for profiles outside the SST15 region) and from
discrete ship-based samples from VAL stations (brown squares). Panel (c) surface chlorophyll concentration: from BGC-Argo floats (light-green dots), from satellite ocean color (dark-green dots), from in situ HPLC of VAL stations (yellow squares). Panel (d) BGC-Argo floats' surface bbp. Letters on the top of the panels refer to the vertical profiles shown in
(this area was not sampled during the PERLE cruises due to geopolitical issues) and they are all positioned west of the SST15 zone (Figure 1). These stations are only used in the next to qualitatively assess the CHL
and NO3 concentrations retrieved from floats.
3. Results and Discussion
The SST15 region attests to intense cooling of the surface water, suggesting that it is an area where the
MLD deepens and the upper water column undergoes mixing (Marullo et al., 2003). Compared with the surrounding regions (Figure S4, panel b), the SST15 area shows the deepest MLD winter values, confirming
the specific physical characteristics of the SST15 region. In this area, the MLD time series from float data
confirms that the maximum deepening of the MLD was at a depth of 250 m in late February/early March 2019, while also revealing that the deepening began in December 2018 then further accelerated in January 2019. Before this period (i.e. October to December 2018), the MLD was shallow and never exceeded 50 m in depth. The NDL depth was observed as being close to the MLD for most of fall 2018. Over the same peri-od, the deep stock of NO3 in the SST15 area (i.e. isoline of 5 μmol L-1) fluctuates between 100 and 200 m in
depth. In the surrounding areas, NO3 stock and DNL are generally deeper than in the SST15 area (Figure S4,
panels b and c). The cyclonic circulation of the RG, which is particularly intense in the fall-winter seasons (Malanotte-Rizzoli, Manca, Marullo, et al., 2003) likely induces a localized (i.e. centered in the SST15 area)
uplift of NO3 stock.
In the SST15 area, the deepening of the MLD observed from late December 2019 onwards induced a
consist-ent injection of NO3 into the upper layers, resulting in the presence of NO3 concentrations typical of deep
stock close to the surface. Moreover, the NDL disappeared, indicating the surface water column was NO3
re-plenished. Although maxima were observed in January 2019, NO3 values in the MLD remained persistently
elevated (always greater than 1 μmol L-1) throughout the period from January to early March 2019 (Figure 2,
panel b), revealing that the MLD deepening and the associated mixing continuously redistributed NO3 from
the deep stock into the surface layer. The NO3MLD started to progressively decrease in February 2019, before
definitively vanishing in late March 2019, when the observed values were below the detection limit. Concomitant in situ data to confirm the NO3 evolution assessed by floats, in particular the high NO3MLD
values observed in January/February, are unavailable. However, the analysis of NO3 profiles of VAL stations
measured during the PERLE-2 survey (March 2019) reveals that at one station at least, NO3MLD was not
completely exhausted (brown squares in Figure 2, panel b). Although the spatiotemporal matching of VAL stations with float data is not perfect (as the former were obtained from outside the SST15 region and outside
the temporal window when the NO3 increase was most observed by floats), the in situ data still provide
confirmation of the BGC-Argo observations.
NO3 augmentation in the mixed layer is also indirectly confirmed by the parallel increase of biomass at the
surface (as assessed by the simultaneous analysis of surface CHL and bbp time series). Showing very low
values in October to November 2018, surface CHL started to increase slightly from December 2019, when the MLD deepened marginally. This augmentation could likely be ascribed to a redistribution of the bio-mass associated to the Deep Chlorophyll Maxima (DCM), directly related to the MLD deepening. During this period, the depths of DCM and of mixed layer are nearly coincident (see Figure S5 for a time series of DCM and mixed layer depths, and also some examples of vertical profiles during this phase in Figure S6, panel a–c). Additionally, since the increase in CHL was not accompanied by a respective increase in bbp, it
may be related to an increase in CHL per cell content as described in Bellacicco et al. (2016), resulting from a decrease in light availability rather an increase of biomass (as confirmed by the low values of the ratio bbp/CHL during this phase, see Figure S5, lower panel). A phosphorus limitation could also explain the
relatively low values of biomass, even in the presence of NO3 availability. In December 2018–January 2019,
however, surface biomass increased unequivocally, as concomitantly indicated by an increase in the surface CHL and bbp values observed by BGC-Argo. During February 2019, biomass, although fluctuating, remained
relatively constant, with CHL and bbp largely higher than the fall values. In early March 2019, surface CHL
concentrations and bbp values reached their maxima, before further decreasing in late March.
From December 2018, the evolution of phytoplankton biomass can be directly correlated to the MLD/NO3
peak, as indicated by the absolute maxima of the CHL and bbp series; in situ HPLC data from VAL
stations (yellow squares in Figure 2, panel c) confirmed the phytoplankton peak, which persisted for ∼2 weeks (Figure S6, panel l).
5. After this last episode, the MLD remained permanently shallow, the NO3MLD rapidly vanished, and
sur-face CHL and bbp decreased back to low fall values (Figure S6, panel m).
6. In April 2019, a second peak of surface bbp was observed while the other parameters showed no relevant
anomalies (Figure S6, panel n).
The succession of events recorded by the BGC-Argo floats is completely consistent with the dynamics of phytoplankton growth primarily driven by MLD dynamics and controlled by nutrient availability. Since December, the NO3 availability induces an increase of surface CHL, maintaining elevated the biomass
dur-ing the winter months. The sprdur-ing CHL peak, occurrdur-ing at the definitive stratification of the water column, concludes the biomass accumulation period, which protracted for most of the winter. The influence of light availability appears less critical than the impact of NO3 on biomass dynamics. However, it partially
explains the stable conditions observed in February 2019 when, although NO3 was available at the surface,
biomass stagnated. During this period, the isoline of 0.415 mole photons m−2 day−1 was permanently
shal-lower than the MLD, suggesting that mixing removes phytoplankton cells from the sunlit layers, causing a slowdown of, or temporarily stop in biomass growth (Williams et al., 2000). We also considered as driver the dilution-recoupling hypothesis (Behrenfeld, 2010; Boss & Behrenfeld, 2010). Indeed, it may have favored the mid-January bloom, when there was a deepening of the mixed layer by ∼50 m but (1) for the rest of winter the MLD was quite stable around 100 m and (2) the impact of the other convective event at the end of February was more in diluting the existing biomass than in favoring the accumulation of new biomass. The large scale cyclonic circulation of the RG is also an important factor driving the NO3 dynamic
(Robin-son et al., 2001). The shallow values of isoline 5 μmol L-1 and of NDL in the SST
15 area, compared to those
observed in the surrounding regions (Figure S4, panels a and c), suggest that the fall-winter large scale circulation induces favorable conditions for NO3 injections in the central RG.
The second surface bbp peak observed in April could likely be related to the presence of detached coccoliths
(Terrats et al., 2020), released by coccolithophores, a dominant group in the region (Oviedo et al., 2015; Vidussi et al., 2001), observed to thrive during late winter and spring in the Levantine basin (Knapperts-busch, 1993; Ziveri et al., 2000). During March 2019 (PERLE-2), coccolithophores were present at relatively high densities (up to 7.6 × 10⁴ cells L-1, partial results from microscopical cell counts). Alternatively, the
surface bbp peak could be associated with Saharan dust inputs, which are frequent in the region during this
time of the year (Guerzoni et al., 1999).
Although NO3 and CHL float data may still be affected by uncertainties (D'Ortenzio, Taillandier, et al., 2020),
the rise in NO3MLD concentration, followed by a significant surface CHL increase, are unequivocal. The NO3
and CHL increases are larger than the estimated errors of float data, which, in the Mediterranean, are esti-mated at about 1 μmol L-1 and 0.2 mg m-3, respectively (Mignot, D'Ortenzio, et al., 2019). Finally, although
in situ ship data are used here only to corroborate floats observations, they indicate that NO3 and CHL
increases are effective, supporting the float-derived results.
The hypothesis of significant phytoplankton increase in the area, as a consequence of MLD and nutrient dynamics related to winter overturning mixing, has already been formulated in the past (Denis et al., 2010;
Ediger & Yilmaz, 1996; Malanotte-Rizzoli, Manca, Marullo, et al., 2003; Souvermezoglou & Krasakopou-lou, 1999; Vidussi et al., 2001). These previous studies, however, were based on a very limited set of in situ observations largely collected in late 1990s, and therefore they could not assess or predict the duration of such events. An observational gap over the following 20 years precluded further validation, resulting in the bulk of subsequent analysis being based on satellite ocean-color observations.
While satellite surface CHL concentrations match the float observations from fall 2018 and late spring 2019, they completely overlook the CHL dynamics observed in late winter and also under-evaluate the observed concentrations in March 2019 (as indicated when in situ HPLC data are compared with float and satellite observations). Cloud coverage may primarily explain the lack of ocean-color observations, while the cor-rection of white caps (due to the intense winds recurrently observed in the area) may strongly reduce the number of available ocean-color pixels and thus available match-ups in the Levantine Sea.
The combined approach of BGC-Argo floats and satellite observations proposed here is still improvable. One such point is the selection of BGC-Argo profiles to generate time series on the basis of the annual min-ima of SST obtained by satellite, here considered as permanent and not temporally variable. In this respect, this approach misrepresents the very high frequency of mixing events and the patchy nature of spatial phytoplankton patterns. In addition, mesoscale and sub-mesoscale processes influence NO3, bbp, and CHL
distributions, inducing additional variability for time series. The effect of these processes is evident in the oscillation of the time series, in particular during the transition periods (i.e. stratification/destratification). Another point is the lack of observations by BGC-Argo floats of macronutrients other than NO3, in
par-ticular phosphorus, which is considered the main limiting nutrient in the area. The picture proposed here, based on the MLD/NO3 interplay, appears nevertheless coherent with the existing hypothesis on the RG
biogeochemical functioning. It also provides, for the first time, a description of the seasonal biogeochem-ical evolution of the region, providing a conceptual framework (based on in situ observations) to improve our comprehension of the functioning of the whole Levantine region. PERLE survey data (presently under analysis), including phosphorus observations, will certainly allow refining this understanding, by introduc-ing and modulatintroduc-ing the findintroduc-ings obtained in this study. Also, the analysis of biogeochemical variables relat-ed to the ecosystem dynamics should provide complementary information on this ecosystem functioning by indicating the distribution of their bulk properties.
Overall, however, and despite these limitations, the proposed approach provides the first continuous annual survey of water-column distribution of NO3, bbp, and CHL in the RG and surrounding regions. It also offers
a comprehensive view of the seasonal evolution in the area, which largely confirms and also enhances pre-vious explanations of its biogeochemical functioning.
4. Conclusions
An unprecedented BGC-Argo observation system was implemented in the Levantine area of the Mediter-ranean Sea in 2018–2019. It was supported by an equivalent and concomitant ship-based effort (3 seasonal surveys from May 2018 to March 2019) to elucidate the impact of physical forcing on the biogeochemical dynamics of the basin. The analysis of the floats data presented here unequivocally confirms phytoplank-ton response to the successive mixing events from December to March. This response was first hypoth-esized and observed in the 1990s, but, later on, substantiated only indirectly through models or satellite observations, which could fail in fully assessing the biogeochemical dynamic of the area (as suggested by the presented results). In the area where the lowest SSTs were recorded, BGC-Argo floats unambiguously observed significant NO3 availability in the sunlit layer, followed by rapid accumulation of biomass on the
surface. Phytoplankton growth appears to be primarily driven by MLD dynamics as shown by the temporal match between MLD stratification and destratification events and CHL fluctuations in the upper layers. As hypothesized in previous studies, MLD deepening drives surface NO3 availability, as observed by floats in
the RG from January 2019 onwards. Floats data also revealed that the upper limit of the deep stock of NO3
was closer to the surface (between 100 and 170 m) than in the surrounding regions and that an uplift of nutrients occurred at the end of the year (i.e. December 2018). Our results confirm that large-scale cyclonic circulation, uplifting density isolines, is likely to be the principal preconditioning cause of subsurface NO3
The results presented here fine-tune the existing picture of the sporadic and intermittent nature of the RG CHL increase, mainly obtained from ocean-color satellite observations. In the 2018–2019 period specifically analyzed here, satellite ocean-color observations partially failed to detect the area's increase in biomass. Considering that the region's biogeochemical budgets are primarily estimated on the basis of remote-sens-ing data, our evidence on the observational limits of satellites indicates then that these budgets could ac-cordingly be biased. In this context, the massive use of BGC-Argo floats, in support of and as a supplement to space and ship-based observation, is one of the potentialities of an expanded BGC-Argo network. To fully exploit these potentialities, more investigations are required to improve integration of the different sources of biogeochemical data and to enhance the use of coupled models assimilating both BGC-Argo and satellite observations (as in Cossarini et al. [2019]). Our analysis also demonstrates that BGC-Argo floats are a powerful tool for elucidating complex interactions between physical and biogeochemical dynamics, al-though they should be integrated, as far as possible, to “classic” observational systems such as ship surveys, moorings and satellites (see relevant discussion in D'Ortenzio, Taillandier, et al. [2020] and in Taillandier et al. [2018]).
Data Availability Statement
The BGC-Argo data presented here are freely available at https://doi.org/10.17882/42182#71394 or ftp://ftp. ifremer.fr/ifremer/argo/dac/. These data were collected and made freely available by the International Argo Program and the national programs that contribute to it (http://www.argo.ucsd.edu, http://argo.jcommops. org). The PERLE data are available at SISMER (https://doi.org/10.17600/18000865) and SEDOO (https:// mistrals.sedoo.fr/MERMeX/). Satellite data were provided by the Copernicus Marine Service and CNR-ISAC Rome, and are available from the Copernicus Marine Service website: https://marine.copernicus.eu.
References
Aminot, A., & Kérouel, R. (2007). Dosage automatique des nutriments dans les eaux marines: Méthodes en flux continu. Editions Quae. Antoine, D., Morel, A., & André, J.-M. (1995). Algal pigment distribution and primary production in the eastern Mediterranean as derived
from coastal zone color scanner observations. Journal of Geophysical Research, 100(C8), 16193–16210. https://doi.org/10.1029/95jc00466 Behrenfeld, M. J. (2010). Abandoning Sverdrup's critical depth hypothesis on phytoplankton blooms. Ecology, 91(4), 977–989. https://doi.
org/10.1890/09-1207.1
Bellacicco, M., Volpe, G., Colella, S., Pitarch, J., & Santoleri, R. (2016). Influence of photoacclimation on the phytoplankton seasonal cycle in the Mediterranean Sea as seen by satellite. Remote Sensing of Environment, 184, 595–604. https://doi.org/10.1016/j.rse.2016.08.004 Bosc, E., Bricaud, A., & Antoine, D. (2004). Seasonal and interannual variability in algal biomass and primary production in the
Mediterra-nean Sea, as derived from 4 years of SeaWiFS observations. Global Biogeochemical Cycles, 18(1). https://doi.org/10.1029/2003GB002034 Boss, E., & Behrenfeld, M. (2010). In situ evaluation of the initiation of the North Atlantic phytoplankton bloom. Geophysical Research
Letters, 37(18), L18603. https://doi.org/10.1029/2010gl044174
Boss, E., & Pegau, W. S. (2001). Relationship of light scattering at an angle in the backward direction to the backscattering coefficient.
Applied Optics, 40(30), 5503. https://doi.org/10.1364/ao.40.005503
Cossarini, G., Mariotti, L., Feudale, L., Mignot, A., Salon, S., Taillandier, V., et al. (2019). Towards operational 3D-Var assimilation of chlo-rophyll Biogeochemical-Argo float data into a biogeochemical model of the Mediterranean Sea. Ocean Modelling, 133, 112–128. https:// doi.org/10.1016/j.ocemod.2018.11.005
Denis, M., Thyssen, M., Martin, V., Manca, B., & Vidussi, F. (2010). Ultraphytoplankton basin-scale distribution in the eastern Mediter-ranean Sea in winter: Link to hydrodynamism and nutrients. Biogeosciences, 7(7), 2227–2244. https://doi.org/10.5194/bg-7-2227-2010
Acknowledgments
This study represents a contribution to the following research projects: NAOS (funded by the Agence Nationale de la Recherche in the framework of the French “Equipement d'avenir” program grant ANR J11R107-F), MISTRALS-MERMEX (CNRS, INSU), REFINE (European Research Council, Grant agreement 834177), Bio-Argo-France (TOSCA CNES), PROTEVS (funded by the French DGA) and Argo-Italy (funded by the Italian Ministry of Research). HCMR scientists acknowledge financial sup-port by “CLIMPACT” (funded by the Public Investment Program of Greece, GSRT, Ministry of Development and Investments) and “MARRE” (Greek Ministry of Economy and Development & EU Regional Development Fund) projects. Thanks also go to the captains and crew of R/V Le Tethys II (CNRS/ INSU), Pourquoi Pas? (IFREMER) and L’Atalante (IFREMER), who participat-ed in the deployment of autonomous platforms, and of the three PERLE cruises. A special thanks to captain Gilles Ferrand, who conducted the de-ployements of most of the floats used in this paper. A specific and warm thanks to the whole of the “BAM Team” (in particular Loic), to the administrative staff of the LOV (Linda Féré, Corinne Poutier, Isabelle Courtois) and to the staff of the “Baleine Joyeuse”. Nothing was possible without them. Finally, we would also like to thank the two referrees (Dr. Raquel Somavilla and the anonymous one) : their suggestions and comments strongly improved the final version of the paper.
D'Ortenzio, F., Iudicone, D., Montegut, C. D., Testor, P., Antoine, D., Marullo, S., et al. (2005). Seasonal variability of the mixed lay-er depth in the Meditlay-erranean Sea as dlay-erived from in situ profiles. Geophysical Research Lettlay-ers, 32(12). L12605. https://doi. org/10.1029/2005gl022463
D'Ortenzio, F., Ragni, M., Marullo, S., & d'Alcalà, M. R. (2003). Did biological activity in the Ionian Sea change after the Eastern Mediter-ranean Transient? Results from the analysis of remote sensing observations. Journal of Geophysical Research, 108(C9), 8113. https:// doi.org/10.1029/2002jc001556
D'Ortenzio, F., & Ribera d'Alcalà, M. (2009). On the trophic regimes of the Mediterranean Sea: A satellite analysis. Biogeosciences, 6(2), 139–148. https://doi.org/10.5194/bg-6-139-2009
D'Ortenzio, F., Taillandier, V., Claustre, H., Prieur, L. M., Leymarie, E., Mignot, A., et al. (2020). Biogeochemical Argo: The test case of the NAOS Mediterranean array. Frontiers in Marine Science, 7, 120. https://doi.org/10.3389/fmars.2020.00120
Ediger, D., Tuğrul, S., & Yılmaz, A. (2005). Vertical profiles of particulate organic matter and its relationship with chlorophyll-a in the upper layer of the NE Mediterranean Sea. Journal of Marine Systems, 55(3–4), 311–326. https://doi.org/10.1016/j.jmarsys.2004.09.003 Ediger, D., & Yilmaz, A. (1996). Characteristics of deep chlorophyll maximum in the Northeastern Mediterranean with respect to
environ-mental conditions. Journal of Marine Systems, 9(3–4), 291–303. https://doi.org/10.1016/s0924-7963(96)00044-9
Guerzoni, S., Chester, R., Dulac, F., Herut, B., Loÿe-Pilot, M. D., Measures, C., et al. (1999). The role of atmospheric deposition in the biogeochemistry of the Mediterranean Sea. Progress in Oceanography, 44(1–3), 147–190.
Johnson, K., Pasqueron De Fommervault, O., Serra, R., D'Ortenzio, F., Schmechtig, C., Claustre, H., & Poteau, A. (2018). Processing
Bio-Ar-go nitrate concentration at the DAC level (p. 22). ArBio-Ar-go data management. https://doi.org/10.13155/46121
Karageorgis, A. P., Gardner, W. D., Georgopoulos, D., Mishonov, A. V., Krasakopoulou, E., & Anagnostou, C. (2008). Particle dynamics in the Eastern Mediterranean Sea: A synthesis based on light transmission, PMC, and POC archives (1991–2001). Deep Sea Research Part
I: Oceanographic Research Papers, 55(2), 177–202. https://doi.org/10.1016/j.dsr.2007.11.002
Kessouri, F., Ulses, C., Estournel, C., Marsaleix, P., D'Ortenzio, F., Severin, T., et al. (2018). Vertical mixing effects on phytoplankton dynamics and organic carbon export in the western Mediterranean Sea. Journal of Geophysical Research: Oceans, 123(3), 1647–1669. https://doi.org/10.1002/2016jc012669
Knappertsbusch, M. (1993). Geographic distribution of living and Holocene coccolithophores in the Mediterranean Sea. Marine
Micropal-eontology, 21(1–3), 219–247. https://doi.org/10.1016/0377-8398(93)90016-q
Krom, M. D., Emeis, K. C., & Van Cappellen, P. (2010). Why is the Eastern Mediterranean phosphorus limited? Progress in Oceanography,
85(3–4), 236–244. https://doi.org/10.1016/j.pocean.2010.03.003
Krom, M. D., Groom, S., & Zohary, T. (2003). The Eastern Mediterranean. In K. D. Black, & G. B. Shimmield (Eds.), The Biogeochemistry of
Marine Systems (pp. 91–126). Oxford: Blackwell.
Lascaratos, A., WIlliams, R. G., & Tragou, E. (1993). A mixed-layer study of the formation of Levantine intermediate water. Journal of
Geophysical Research, 98(C8), 14739–14749. https://doi.org/10.1029/93jc00912
Leymarie, E., Poteau, A., André, X., Besson, F., Brault, P., Claustre, H., et al. (2013). Development and validation of the new ProvBioII float.
Mercator Ocean—Coriolis Quarterly Newsletter, 48, 26–30.
Malanotte-Rizzoli, P., Manca, B., Marullo, S., Ribera d'Alcalà', M., Roether, W., Theocharis, A., et al. (2003). The Levantine intermediate water experiment (LIWEX) group: Levantine basin—a laboratory for multiple water mass formation processes. Journal of Geophysical
Research: Oceans, 108(C9), 8101. https://doi.org/10.1029/2002JC001643
Malanotte-Rizzoli, P., Manca, B. B., d'Alcala, M. R., Theocharis, A., Brenner, S., Budillon, G., & Ozsoy, E. (1999). The Eastern Mediterrane-an in the 80s Mediterrane-and in the 90s: The big trMediterrane-ansition in the intermediate Mediterrane-and deep circulations. Dynamics of Atmospheres Mediterrane-and OceMediterrane-ans, 29(2–4), 365–395. https://doi.org/10.1016/s0377-0265(99)00011-1
Manca, B., Burca, M., Giorgetti, A., Coatanoan, C., Garcia, M.-J., & Iona, A. (2004). Physical and biochemical averaged vertical profiles in the Mediterranean regions: An important tool to trace the climatology of water masses and to validate incoming data from operational oceanography. Journal of Marine Systems, 48(1–4), 83–116. https://doi.org/10.1016/j.jmarsys.2003.11.025
Marullo, S., Napolitano, E., Santoleri, R., Manca, B., & Evans, R. (2003). Variability of rhodes and Ierapetra gyres during Levantine in-termediate water experiment: Observations and model results. Journal of Geophysical Research: Oceans, 108(C9), 8119. https://doi. org/10.1029/2002jc001393
Mayot, N., D'Ortenzio, F., Ribera d'Alcalà, M., Lavigne, H., & Claustre, H. (2016). Interannual variability of the Mediterranean trophic regimes from ocean color satellites. Biogeosciences, 13(6), 1901–1917. https://doi.org/10.5194/bg-13-1901-2016
Mignot, A., Claustre, H., Uitz, J., Poteau, A., D'Ortenzio, F., & Xing, X. (2014). Understanding the seasonal dynamics of phytoplankton bi-omass and the deep chlorophyll maximum in oligotrophic environments: A Bio-Argo float investigation. Global Biogeochemical Cycles,
28(8), 856–876. https://doi.org/10.1002/2013gb004781
Mignot, A., D'Ortenzio, F., Taillandier, V., Cossarini, G., & Salon, S. (2019). Quantifying observational errors in Biogeochemical-Argo oxygen, nitrate, and chlorophyll a concentrations. Geophysical Research Letters, 46(8), 4330–4337. https://doi.org/10.1029/2018gl080541 Napolitano, E., Oguz, T., Malanotte-Rizzoli, P., Yilmaz, A., & Sansone, E. (2000). Simulations of biological production in the Rhodes and Io-nian basins of the eastern Mediterranean. Journal of Marine Systems, 24(3–4), 277–298. https://doi.org/10.1016/s0924-7963(99)00090-1 Omand, M. M., & Mahadevan, A. (2015). The shape of the oceanic nitracline. Biogeosciences, 12(11), 3273–3287. https://doi.org/10.5194/
bg-12-3273-2015
Oviedo, A., Ziveri, P., Álvarez, M., & Tanhua, T. (2015). Is coccolithophore distribution in the Mediterranean Sea related to seawater car-bonate chemistry? Ocean Science, 11(1), 13–32. https://doi.org/10.5194/os-11-13-2015
Pedrosa-Pàmies, R., Sanchez-Vidal, A., Canals, M., Lampadariou, N., Velaoras, D., Gogou, A., et al. (2016). Enhanced carbon export to the abyssal depths driven by atmosphere dynamics. Geophysical Research Letters, 43(16), 8626–8636. https://doi.org/10.1002/2016GL069781 Ras, J., Claustre, H., & Uitz, J. (2008). Spatial variability of phytoplankton pigment distributions in the Subtropical South Pacific Ocean:
Comparison between in situ and predicted data. Biogeosciences, 5(2), 353–369. https://doi.org/10.5194/bg-5-353-2008
Robinson, A. R., Leslie, W. G., Theocharis, A., & Lascaratos, A. (2001). Mediterranean Sea circulation. Academic Press, Harcourt Science & Technology. Retrieved from http://www.academicpress.com
Salihoǧlu, İ., Saydam, C., Baştürk, Ö., Yilmaz, K., Göçmen, D., Hatipoǧlu, E., & Yilmaz, A. (1990). Transport and distribution of nutrients and chlorophyll-a by mesoscale eddies in the Northeastern Mediterranean. Marine Chemistry, 29, 375–390.
Schmechtig, C., Poteau, A., Claustre, H., D'Ortenzio, F., & Boss, E. (2015). Processing Bio-Argo chlorophyll-a concentration at the DAC level (p. 12). Argo Data Management. http://doi.org/10.13155/39468
Schmechtig, C., Poteau, A., Claustre, H., D'Ortenzio, F., Dall'Olmo, G., & Boss, E. (2018). Processing Bio-Argo particle backscattering at the
doi.org/10.1029/1999jc000308
Volpe, G., Santoleri, R., Vellucci, V., Ribera d'Alcalà, M., Marullo, S., & D'Ortenzio, F. (2007). The colour of the Mediterranean Sea: Global versus regional bio-optical algorithms evaluation and implication for satellite chlorophyll estimates. Remote Sensing of Environment,
107(4), 625–638. https://doi.org/10.1016/j.rse.2006.10.017
Williams, R. G., McLaren, A. J., & Follows, M. J. (2000). Estimating the convective supply of nitrate and implied variability in export pro-duction over the North Atlantic. Global Biogeochemical Cycles, 14(4), 1299–1313. https://doi.org/10.1029/2000gb001260
Ziveri, P., Rutten, A., de Lange, G. J., Thomson, J., & Corselli, C. (2000). Present-day coccolith fluxes recorded in central eastern Med-iterranean sediment traps and surface sediments. Palaeogeography, Palaeoclimatology, Palaeoecology, 158(3–4), 175–195. https://doi. org/10.1016/s0031-0182(00)00049-3
References From the Supporting Information
Bittig, H. C., Maurer, T. L., Plant, J. N., Wong, A. P., Schmechtig, C., Claustre, H., et al. (2019). A BGC-Argo guide: Planning, deployment, data handling and usage. Frontiers in Marine Science, 6, 502. https://doi.org/10.3389/fmars.2019.00502
Johnson, K. S., & Coletti, L. J. (2002). In situ ultraviolet spectrophotometry for high resolution and long-term monitoring of nitrate, bro-mide and bisulfide in the ocean. Deep Sea Research Part I: Oceanographic Research Papers, 49(7), 1291–1305. https://doi.org/10.1016/ s0967-0637(02)00020-1
Johnson, K. S., Coletti, L. J., Jannasch, H. W., Sakamoto, C. M., Swift, D. D., & Riser, S. C. (2013). Long-term nitrate measurements in the ocean using the In Situ Ultraviolet Spectrophotometer: Sensor integration into the Apex profiling float. Journal of Atmospheric and
Oceanic Technology, 30(8), 1854–1866. https://doi.org/10.1175/jtech-d-12-00221.1
Pasqueron de Fommervault, O., D'Ortenzio, F., Mangin, A., Serra, R., Migon, C., Claustre, H., et al. (2015). Seasonal variability of nutrient concentrations in the Mediterranean Sea: Contribution of Bio-Argo floats. Journal of Geophysical Research: Oceans, 120(12), 8528–8550. https://doi.org/10.1002/2015JC011103
Sakamoto, C. M., Johnson, K. S., & Coletti, L. J. (2009). Improved algorithm for the computation of nitrate concentrations in seawater using an in situ ultraviolet spectrophotometer. Limnology and Oceanography: Methods, 7(1), 132–143. https://doi.org/10.4319/lom.2009.7.132