HAL Id: insu-03164037
https://hal-insu.archives-ouvertes.fr/insu-03164037
Submitted on 12 Mar 2021
HAL is a multi-disciplinary open access
archive for the deposit and dissemination of
sci-entific research documents, whether they are
pub-lished or not. The documents may come from
teaching and research institutions in France or
abroad, or from public or private research centers.
L’archive ouverte pluridisciplinaire HAL, est
destinée au dépôt et à la diffusion de documents
scientifiques de niveau recherche, publiés ou non,
émanant des établissements d’enseignement et de
recherche français ou étrangers, des laboratoires
publics ou privés.
Relative Sea-Level Changes Over the Past Centuries
in the Central Ryukyu Arc Inferred From Coral
Microatolls
J. Weil-accardo, N. Feuillet, K. Satake, T. Goto, K. Goto, T. Harada, H.
Kayanne, M. Nakamura, N. Ramos, J.-m. Saurel, et al.
To cite this version:
J. Weil-accardo, N. Feuillet, K. Satake, T. Goto, K. Goto, et al.. Relative Sea-Level Changes Over the
Past Centuries in the Central Ryukyu Arc Inferred From Coral Microatolls. Journal of Geophysical
Research : Solid Earth, American Geophysical Union, 2020, 125 (2), �10.1029/2019JB018466�.
�insu-03164037�
Relative Sea-Level Changes Over the Past Centuries
in the Central Ryukyu Arc Inferred From Coral
Microatolls
J. Weil-Accardo1,2, N. Feuillet3, K. Satake2, T. Goto2, K. Goto4, T. Harada2, H. Kayanne5, M.
Nakamura6, N. Ramos7, J.-M. Saurel3, K. Sowa8, S.-C. Liu9, T.-L. Yu1,9,10, and C.-C. Shen1,9,10
1Now at CEREGE, Aix-Marseille University, Aix-en Provence, France,2Earthquake Research Institute, University
of Tokyo, Tokyo, Japan,3Institut de Physique du Globe de Paris, Sorbonne Paris University, Paris-Diderot University,
UMR 7154, Paris, France,4International Research Institute of Disaster Science, Tohoku University, Sendai, Japan, 5Department of Earth and Planetary Science, University of Tokyo, Tokyo, Japan,6Faculty of Science, University
of the Ryukyus, Okinawa, Japan,7National Institute of Geological Sciences, University of the Philippines-Diliman,
Quezon City, Philippines,8Japan Agency for Marine-Earth Science and Technology, Kanagawa, Japan,9Department of Geosciences, National Taiwan University, Taipei, Taiwan, ROC,10Research Center for Future Earth, National Taiwan
University, Taipei, Taiwan, ROC
Abstract
This study focuses on Okinawa and Yoron islands, in order to better understand tectonics in the Ryukyu Arc related to the subduction zone. We used coral microatolls—known for their centimetric accuracy in the record of relative sea-level (RSL) changes—to reconstruct RSL changes over the last century from living microatolls. A fossil microatoll in Yoron was used to discuss possible RSL changes beyond the last century. The signal consists of emergence whose rate varies through time, interrupted by decadal to multidecadal periods of sudden and/or gradual submergence and by interannual sea-level falls. Comparison with other existing RSL records in the arc highlights RSL variability along the arc. This pattern contrasts with the homogeneous and linear absolute regional sea-level rise, implying that this latter signal cannot fully explain our observations and that an additional process is required. We suggest the subduction zone as a possible source for generating centimetric scale RSL changes observed in coral microatolls. We tested how the Ryukyu megathrust could explain our observations with elastic dislocation modeling. The emergence trend could be explained by interseismic loading on the plate interface with a minimum coupling rate of 25%, which is higher than previous estimates based on short instrumental records. As for the submergence events that occurred regularly in the coral record, we show that they could be explained by slow slip events on the shallower part of the megathrust or in the transition zone. Such process could accommodate a significant part of the total convergence.1. Introduction
Since the occurrence of three megathrust earthquakes having triggered devastating tsunamis in 2004 in Sumatra, 2010 in Chile, and 2011 in Japan, we cannot exclude the possibility that any subduction zone may produce megathrust earthquakes. It is thus essential to better constrain the seismic potential of poorly known subduction zones, where the historical record of large earthquakes is short and where the recurrence interval of large earthquakes is long.
The Ryukyu subduction zone, along which the Philippine Sea Plate subducts beneath the Eurasian Plate at a rate of 8 cm/year, presents an active back-arc spreading in the Okinawa trough. This characterizes an extensional regime usually associated with a weak interplate coupling (Scholz & Campos, 1995). Based on the seismic moment released over the last century, the seismic coupling of the Ryukyu subduction was estimated to be lower than 5% (Peterson & Seno, 1984). The modeling of GPS data scattered on all islands of the arc also indicates a low coupling rate varying between 5% in the central Ryukyu Arc and 35% in the southern Ruykyu Arc (Yaeyama islands and Miyako island, Watanabe & Tabei, 2004). Overall, all the existing data concur to conclude that the Ryukyu subduction zone might be unable to generate large thrust earthquakes. The recent discovery of slow slip event (SSE) of different natures all along the plate boundary at depth ranging between 0 and 60 km (Heki & Kataoka, 2008; Nishimura, 2014; Nakamura & Sunagawa,
RESEARCH ARTICLE
10.1029/2019JB018466
Key Points:
• Relative sea-level changes due to climate and tectonics recorded by coral microatolls
• Record of vertical deformations related to the seismic cycle of the Ryukyu subduction zone • Coupling variability of the Ryukyu
subduction zone Supporting Information: • Supporting Information S1 Correspondence to: J. Weil-Accardo, weil@cerege.fr Citation: Weil-Accardo, J., Feuillet, N., Satake, K., Goto, T., Goto, K., Harada, T., et al. (2020). Relative sea-level changes over the past centuries in the central Ryukyu Arc inferred from coral microatolls. Journal of Geophysical Research: Solid Earth, 125, e2019JB018466. https:// doi.org/10.1029/2019JB018466
Received 29 JUL 2019 Accepted 5 DEC 2019
Accepted article online 7 DEC 2019
©2019. American Geophysical Union. All Rights Reserved.
Journal of Geophysical Research: Solid Earth
10.1029/2019JB018466
Figure 1. Geodynamic setting of the Ryukyu Arc. (a) Bathymetry and topography: ASTER data. Black rectangle (panel b): investigated area in 2016 (south Okinawa to north of Okinoerabu) with the three samples sites of Itoman, Onna, and Yoron (yellow dots). Orange stars: location, ages, and magnitudes of historical EQ based on Nakata and Kawana (1995). Red rectangle: rupture source of the 1771 Yaeyama earthquake (Nakamura, 2009b). Red triangles: active volcanoes. Green squares: Tide gauges (PSMSL data) with rate in millimeter per year (linear regression on annual data, Figure 10). LOFZ: Luzon-Okinawa Fracture Zone. (b) Location of the investigated sites and active faults (red lines and dashed lines). Bathymetry and topography: ASTER data. Yellow dots: studied sites. Green squares: Naha and Okinawa tide gauges. Major submarine faults (dashed red lines) between Yoron and north of Okinawa, and onshore faults (red lines) in Yoron from Goto et al. (2018). Gray rectangle: limit of the study of Goto et al. (2018). Major onshore fault in Okinawa from IAIST (2016).
2015) may indicate that the megathrust could use a discrete mechanism to release most of the accumulated strains instead of rupturing during large earthquakes.
On the basis of simple elastic models, however, Ando et al. (2009) highlighted the fact that the onland GPS stations are probably too far away to determine the coupling rate of the interface near the trench if the coupled area is less than 50-km wide. They further highly recommended acquiring offshore monitoring of crustal deformation. This was done a few years later in the central Ryukyu Arc, off the Okinawa main island (Nakamura, 2011; Tadokoro et al., 2018). In this region, data from GPS/acoustic instruments revealed the existence of a strongly coupled 20- to 30-km wide patch located southeast of Okinawa, with lateral extent that still remains to be accurately constrained (Tadokoro et al., 2018). Those results show that at least some portions of the plate interface, close to the trench, may be coupled. Recently, Lin et al. (2014) showed that several geological and geophysical similarities exist between the Sumatra and the Ryukyu subduction zones (the stress regime, the presence of subducting reliefs and high gravity anomalies, and the distribution of the seismicity) and concluded that a megathrust event is highly likely, particularly in the central Ryukyu Arc. Moreover, based on a new lithospheric density model, Doo et al. (2018) inferred a strong plate coupling in southern Ryukyu.
All these studies highlight the fact that the seismic coupling of the plate interface of the Ryukyu subduction zone and thus its capability to generate large earthquake is still very controversial. This is mainly because we are missing a long record of earthquakes in this area. Only few M8+ earthquakes or tsunamis were reported over the last 350 years (Watanabe, 1985), the source of which is still highly debated, and the historical record is too short to estimate their recurrence time.
With run-up of waves up to 30-m high, and more than 17,000 casualties, the 1,771 Meiwa tsunami was the deadliest event reported along the Ryukyu Arc (Nakata & Kawana, 1995). It occurred in the southern Ryukyu (Figure 1a), and several sources are proposed for this event, among them are reverse faulting coupled with landslides, an arc-perpendicular normal fault located to the east of Ishigaki island (Nakamura, 2006, and
Journal of Geophysical Research: Solid Earth
10.1029/2019JB018466
references therein), a thrust earthquake at the plate interface at shallow depth (Nakamura, 2009b), and a massive collapse of the accretionary wedge prism close to the trench (Okamura et al., 2018).
The strongest M8+ earthquake reported in the Ryukyu area occurred on 15 June 1911 in the area of Kikai or Amami islands (Figure 1a) and killed 12 people. The epicenter of this event is not well constrained and estimates vary by up to 200 km. This earthquake was large enough to produce a tsunami of 5 m in Kikai. Two main sources were proposed for this event: an intermediate intraslab earthquake beneath Amami and a shallow interplate earthquake in front of Kikai, the second hypothesis being more compatible with the occurrence of a tsunami (references therein Goto, 2013).
The reexamination of historical records highlighted two additional historical tsunamis that occurred in 1768 and 1791 in Okinawa Island and that could have been induced by interplate M-class 8 earthquakes on the coupled patch revealed by the offshore GPS measurements (Nakamura, 2011; Tadokoro et al., 2018). The 1771 Meiwa tsunami dislodged and displaced huge coral boulders and sediments far from the coast (Ando et al., 2018; Goto, Miyagi, et al., 2010). A systematic mapping and dating of numerous boulders transported along the coast of several islands of the arc allowed the identification of other older tsunamis of different magnitude and with estimated recurrence intervals of 140–400 years over the last 2,400 years (Araoka et al., 2013; Goto, Shinozaki, et al., 2010; Goto, Miyagi, et al., 2010; Goto, Kawana, et al., 2010). Based on the analysis of the sediment stratigraphy along the coast of Ishigaki in southern Ryukyu, Ando et al. (2018) identified four tsunami deposits, probably triggered by ruptures of the plate interface, that occurred in the area over the last 2,500 years with a recurrence time of about 600 years.
Those results are in contrast with the inferences based on short-term records such as GPS and seismological data. This illustrates that existing models fail to predict earthquake recurrence over the long term. For the Ryukyu subduction zone, difficulty in using the GPS to constrain the coupling rate may also arise because rigid block motions along many tectonic structures in the area are superimposed on the strain accumulation signal (Nakamura, 2004). This problem could be avoided by using the vertical motion of the GPS (Aoki & Scholz, 2003), but it is often noisy and rarely used, particularly when the record is short. We also know that the interseismic strain rate may vary through time during one seismic cycle and between seismic cycles (e.g., Meltzner et al., 2015). We thus really need to enlarge the rather short time window provided by instrumental records and to gather longer records to establish long time-series.
Toward this goal, by taking advantage of the ubiquitous corals in subtropical areas in southwest Japan, we started to study the coral microatolls along the Ryukyu Arc in order to provide several decades to several centuries-long measurements of the vertical deformation due to the seismic cycle at the plate interface. Coral microatolls are massive coral colonies that live on shallow reef flats, and act as natural tide gauges by recording relative sea-level (RSL) changes with a precision of a few centimeters over several centuries or millennia (e.g., Meltzner & Woodroffe, 2015). We use the coral microatoll record to retrieve the history of strain accumulation and release along the megathrust interface over the whole seismic cycle.
Coral microatolls are one of the valuable geological markers filling the gap between short-term deformation measured by instrumental geodesy and longer-term deformation recorded by older geological markers such as marine terraces. In addition to its tectonic significance, the coral microatolls record a significant climatic component (any changes of the absolute sea level) that we also need to characterize and which is of prime importance for islands that are especially vulnerable to the global climate change through induced regional sea-level changes.
We present here the first study using the annual record preserved in coral microatolls in Japan to accurately reconstruct RSL changes related to tectonic processes at subduction zones and to the climate. Previous works were dedicated to the survey and the14C dating of the edges of mid- to late-Holocene fossil microatolls in south Ryukyus (Ota et al., 1985) and on the east of Okinawa (Fujita et al., 2015).
We focused our first investigation in the central Ryukyu Islands where we observed microatolls on all islands we visited. We collected five samples in Okinawa main island and in Yoron Island. We first briefly review the methodology and present the main results including the detailed mapping of all the sites we investigated, the x-ray of the corals we sampled, and the RSL reconstructions. Then, by using the regional tide-gauges and satellite altimetry, we discuss the signal recorded by our microatolls and estimate the climatic component.
Journal of Geophysical Research: Solid Earth
10.1029/2019JB018466
Finally, by using simple elastic dislocation forward modeling, we discuss the origin of the coral signal to get information on the coupling rate and past tectonic events in the central Ryukyu Arc.
2. Methodology
2.1. The Use of Microatolls as Paleogeodetic Tool
The term “microatoll” is used to describe the specific morphology of massive coral colonies living in the intertidal zone and whose upper growth is limited by the RSL changes. The coral begins to grow radially with a ball-shape without constraining its upward growth by low tides or effect of exposure (hereafter named “unconstrained” upward growth or environment). Once the coral reaches its highest level of survival (HLS), which is the theoretical surface beyond which the coral cannot survive due to subaerial exposure (Meltzner et al., 2010), its upward growth is limited by the fluctuation of its HLS, and it mainly grows outward. The coral thus adapts its upward growth following the changes of this level and develop a microatoll morphology. The HLS is typically related to the lowest tide of the year (Meltzner et al., 2010), even though the accurate relationship between the HLS and the tidal range varies between species (Briggs et al., 2006; Meltzner et al., 2006; Natawidjaja et al., 2006) and among corals depending on the coral's environment (e.g., Smithers & Woodroffe, 2000; Weil-Accardo, Feuillet, Jacques, Deschamps, Saurel, et al., 2016). Since RSL changes gen-erate concomitant HLS fluctuations (Zachariasen et al., 1999, 2000), the coral adapts its growth in response to RSL changes. In this way, a coral evolving in a stable sea level will mainly grow outward and develop a flat shape. In a submergent environment, the upward growth is promoted, generating a cup morphology with a higher external rim surrounding an older central part. Corals that are growing in an emergent set-ting will tend to display a hat morphology with a higher central part surrounded by a lower external living rim (e.g., Hopley, 2011; Stoddart & Scoffin, 1979; Scoffin et al., 1978; Taylor et al., 1987). Corals record sea-sonal changes in aragonite density in their skeleton, which leads to an alternation of dark and light bands that corresponds to the annual banding, similar to tree rings. By observing the coral's internal chronology, we can accurately date the RSL changes recorded by the coral.
We use coral microatolls to document vertical deformation due to megathrust seismic cycle. Indeed, for simple models of the seismic cycle, for which the crust behaves elastically over one or few seismic cycles, the overriding plate subsides slowly above the locked (coupled) zone and uplifts beyond when the stress accumulates during the interseismic period. The vertical deformation of the upper plate is strictly of the opposite sign (uplift above the ruptured zone and subsidence beyond) during the earthquake when the stress is suddenly released.
Microatolls have been used elsewhere and have provided important results that allowed to improve our knowledge of the seismic cycle at tropical subduction zones in Indonesia (e.g., Meltzner et al., 2015, 2010, 2012, 2006; Natawidjaja et al., 2006; Philibosian et al., 2012; Sieh et al., 2008; Zachariasen et al., 1999), in Vanuatu (Taylor et al., 1980, 1982), in the Lesser Antilles (Weil-Accardo, Feuillet, Jacques, Deschamps, Beauducel, et al., 2016), in Bangladesh (Mondal et al., 2018), and in Myanmar (Shyu et al., 2018).
2.2. Survey and Sampling
Fieldwork was conducted in March 2016 to search for coral microatolls in the central part of the arc between north of Okinoerabu and south of Okinawa (Figure 1a). With the good resolution of satellite images and submarine pictures available on Google Earth over the investigated area, we were able to identify several promising sites, and we did not perform additional flight surveys during the fieldwork.
The Ryukyu Arc is characterized by a large tidal range of 2 m on average. We took care to avoid microa-tolls that were localized in moated pools that are not freely connected to open ocean, as this moating effect usually prevails in areas affected by a large tidal range (Hopley, 1982). In ponds, the lower part of the tidal cycle is often truncated implying a lowest sea level in the pond higher than in the open ocean (Smithers, 2011). In consequence, moated microatolls will record sea-level changes of the pool rather than true RSL changes. Without additional historical information and measurements to reconstruct the history of a moated microatoll, we cannot not use them to reconstruct the RSL variations.
We selected four sites (GPS locations in Table 1), two in the main Okinawa island and two in Yoron island (see detailed information in the following). We performed a detailed survey of all the sites with a total sta-tion to measure accurately the modern HLS recorded by each coral. We thus verify that all contemporary microatolls of the site are recording the HLS at the same elevation. This control is of prime importance in choosing the best corals that will give us a relevant record of RSL in the site and avoid the odd coral out
Journal of Geophysical Research: Solid Earth
10.1029/2019JB018466
Table 1
GPS Location of the Investigated Sites
Site name Latitude Longitude
Itoman 26◦05’20.06”N 127◦42’29.27”E
Onna 26◦26’30.64”N 127◦46’02.32”E
Yoron site 1 (living microatolls) 27◦04’13.49”N 128◦25’49.13”E Yoron site 2 (fossil microatolls) 27◦04’05.43”N 128◦25’31.17”E Note. Location on maps in Figure 1.
(overturned or tilted corals, corals affected by substrate changes or any very local changes not representative of the RSL changes of the whole site). After the topographic surveys, we sampled five 10-cm-thick coral slabs with a hydraulic chain saw in June and July 2016. Thin cutting of the coral slabs was further performed at the Ogyu Manufacturing Inc., also known in Japan as Milano Seisakusho Co. Ltd (equipped with stable diamond wire), where we obtained slices of about 1 to 2 cm of thickness. The thin slices were then x-rayed at the Veterinary Medical Center of the University of Tokyo. Details about the methodology, total station measurements, sam-pling, thin cutting at the marble mason, and coral x-rays were given in several previous publications (e.g., Weil-Accardo, Feuillet, Jacques, Deschamps, Beauducel, et al., 2016).
U-Th dating was needed to constrain the RSL history recorded by one fossil coral sampled in Yoron. Ages are presented in Table 2 (see details of metholology in Table 2 caption and overall descriptions of the methodology in previous papers, e.g., Cheng et al., 2000; Jaffey et al., 1971).
2.3. Coral Stratigraphy and Reconstruction of RSL Changes
The coral morphology (flat, cup, or hat shape) may give us an indication about the past RSL changes, but this is not always sufficient since regrowth colonies may cover the surface of the main colony and thus mask the RSL fluctuations. A subtle stratigraphic analysis of the large cross-sectional slabs collected from microatolls is needed to provide evidence of the changes that have affected the coral during its growth (period of promoted upward growth, period with frequent HLS impingements, changes in basal topography of the coral, etc.).
The x-ray image reveals the annual density bands of the coral and multiple old HLS surfaces. We mea-sured the changes in elevation of each HLS surface and established their chronology by counting the annual growth bands. From this stratigraphy and by plotting the maximum elevation of each growth band versus time, we obtain the graph of HLS elevation through time (with 0 as the reference elevation corresponding to the highest elevation of the youngest external growth band).
We have distinguished the “HLS year” when coral upward growth is limited by its HLS and the “highest level of growth (HLG) year,” when the coral did not reach its theoretical HLS (e.g., Zachariasen et al., 1999, 2000). During HLG years, the coral upward growth is only limited by its natural growth rate, and the distance to its theoretical HLS is unknown (Meltzner et al., 2010). In the coral stratigraphy, a HLS year corresponds to a truncated growth band, while the growth band is complete during a HLG year (Zachariasen et al., 2000). The coral upward growth is often disrupted by temporary centimetric sea-level drops, commonly named “die downs” (Taylor et al., 1987; Zachariasen et al., 1999). We use the term HLS for years that follow a die down while the term HLG is used for years not immediately following a die down (Meltzner et al., 2010). To calculate the submergence and emergence rate for each coral, we use the different calculation methods of Zachariasen (1998), Zachariasen et al. (2000), and Meltzner et al. (2010) that give similar results and
Table 2
Uranium and Thorium Isotopic Compositions and 230th ages of Yoron Fossil Microatoll by MC-ICPMS, Thermo Electron Neptune, at NTU
Sample 238U 232Th 𝛿234U [230Th/238U] [230Th/232Th] Age (yr ago) 𝛿234Uinitial
ID 10−9g/ga 10−12g/g measuredb activityc atomic(*10−6) uncorrected correctedc,d correctedb
YOR-F1-1 2856.0 (±3.5) 199.6 (±5.2) 143.0 (±2.0) 0.001166 (±0.000023) 275.2 (±8.9) 111.3 (±2.2) 109.7 (±2.3) 143.1 (±2.0) YOR-F1-2 2633.2 (±3.6) 116.0 (±4.7) 146.0 (±1.9) 0.001631 (±0.000028) 610 (±27) 155.3 (±2.7) 154.3 (±2.7) 146.1 (±1.9) YOR-F1-4 2579.1 (±3.7) 105.6 (±4.6) 144.4 (±2.3) 0.002473 (±0.000024) 996 (±44) 235.8 (±2.3) 234.9 (±2.4) 144.5 (±2.3) YOR-F1-6 3114.0 (±3.0) 339.0 (±4.5) 146.7 (±1.7) 0.003415 (±0.000032) 517.2 (±8.4) 325.3 (±3.1) 322.7 (±3.4) 146.8 (±1.8) Note. Analytical errors are 2𝜎of the mean.
a[238U] = [235U]×137.77 (±0.11‰) (Hiess et al., 2012);𝛿234U = ([234U/238U]
activit𝑦−1)×1000.b𝛿234U
initialcorrected was calculated based on230Th age (T), e.g., 𝛿234U
initial=𝛿234Umeasured* e𝜆234∗T, and T is corrected age. c[230Th/238U]activit𝑦= 1−e−𝜆230∗T+ (𝛿234Umeasured/1000)[𝜆230/(𝜆230−𝜆234)](1−e−(𝜆230−𝜆234)∗T), where T is the age. Decay constants are 9.1705×10⁻⁶yr−1for230Th, 2.8221×10⁻⁶yr−1for234U (Cheng et al., 2013), and 1.55125×10⁻¹⁰yr−1for238U (Jaffey et al., 1971). dAge corrections, relative to chemistry date on January 13th, 2017, were calculated using an estimated atomic230Th/232Th ratio of 4 (±2)×10−6 (Shen et al., 2008)
Journal of Geophysical Research: Solid Earth
10.1029/2019JB018466
allow us to test the robustness of the coral signal. These methods are all based on linear regression, and the difference lies in the number and type of data taken into account in the calculation: all HLG and HLS data starting from the first HLS (Zachariasen, 1998; Zachariasen et al., 2000), only HLS data (Zachariasen, 1998; Zachariasen et al., 2000), only noneroded HLG before die downs (Meltzner et al., 2010). For the corals collected in Yoron, we only used the calculation method of Zachariasen (1998) and Zachariasen et al. (2000) which take into account all HLS and HLG points starting from the first HLS. This method is more appropriate for the living corals of Yoron whose records reflect short-term periods of emergence and submergence rather than successive temporary die downs. As well, the same method was used for the fossil coral of Yoron for which we did not find residual print of die downs (see detailed information in the following section).
3. Results
3.1. Sampling Sites
Despite its high latitude between 24◦and 31◦N, the Ryukyu archipelago offers plenty of corals due to the warm Kuroshio Current which maintains an average temperature above the minimum temperature required for coral reef survival (Denis et al., 2013; Kan, 2011).
We found plenty of coral microatolls between Okinoerabu and south of Okinawa (Figure 1 and supporting information, Figure S1), all were Porites species, with variable colors from purple to brown-yellow. Their environment varies from open lagoon to emerged reef flat. We observed a large variability in shape among the microatolls that we discovered, from cup-shaped corals indicating submergence at Ie-jima to hat-shaped corals indicating emergence at Yoron (Figure S1).
Based on the geomorphological environment of the microatolls, we decided to focus on four sites: Itoman and Onna (south and west part of Okinawa, respectively), and two sites in the northeastern lagoon of Yoron island (Figure 1 and GPS locations in Table 1).
The site of Itoman corresponds to a pool separated from the open ocean by an emerged platform that stands at about 1.5 m above the modern HLS recorded by the living microatolls of the area (Figures 2a–2c). While eroded depressions in the emerged platform are filled by small elevated pools with moated microatolls grow-ing in (total station measurements in green in Figures 2b and 2c), we found large (around 2.5 m wide) corals to very large microatolls (overturned microatolls more than 3 m wide) in the main pool behind the emerged platform (Figures 2a–2d). An artificial channel between the pool and the open ocean was dug in 1907 (Pers. Com from Itoman City Office, Figures 2a and 2b). In the connected pool, we mapped 50 rather flat living coral microatolls that define the modern HLS at an elevation of −8.31 ± 0.03 m (relative to the height of the total station; Figures 2b and 2c). We sampled two living microatolls we named ITO 1 and ITO 2 (Figures 2b–2f), 1.8 to 2.5 wide and 45 to 65 cm high (supporting information, Figure S3a–S3b).
As in Itoman, the fringing reef that enclosed the 4-km-long and 1-km-wide Onna site (Figure 3 and sup-porting information, Figure S2) is protected by an eroded emerged platform standing at about 0.65 m above the modern HLS (Figures 3a–3c). The platform is more eroded than in Itoman, and three natural channels connect the reef flat to the open ocean (Figure S2). The construction of the port of Maeda between 1984 and 1994 led to the excavation in 1993–1994 of a fourth channel close to our site (personal communication from Onna Fishery Cooperative, Figure S2). In Onna, we mapped around 86 living coral microatolls, which record a modern HLS at −0.46 ± 0.06 m of elevation compared to that of the total station (Figures 3a–3c). We sampled two living corals we named ONNA 1 and ONNA 2 (Figures 3d and 3e). The modern HLS is defined with an accuracy of up to 0.02 m when measured on individual coral colonies (Figures S3c and S3d). Corals were 2 m on average, 20 and 50 cm high and were almost flat or slightly hat-shaped (Figures 3d, 3e, S3c, and S3d).
We investigated two sites about 500 m apart (Table 1 and Figure 4) in the wide lagoon of Yoron, described by Yonekura et al. (1994). We targeted the northern site because we discovered very large fossil microatolls of about 8 m in diameter. We studied smaller living microatolls in the eastern site. The living coral microatolls are 1.5 m wide and 50 to 70 cm high (Figures 4d, 4e, S3e, and S3f) and thus have a higher height to width ratio than the microatolls of Okinawa. The living microatolls display clear rims much more pronounced than in Okinawa (Figures 4d and 4e). We surveyed 15 living microatolls, which mark a mean HLS of −8.26 ± 0.07 m of elevation compared to that of the total station (Figures 4a and 4b). This modern HLS was slightly higher by around 5 cm than the older HLS recorded by the large fossils microatolls (Figures 4f and 4g). As in Okinawa, an emerged platform standing at about 0.8 m above the modern HLS surrounds our sites (Figure 4b). We
Journal of Geophysical Research: Solid Earth
10.1029/2019JB018466
Figure 2. Survey in Itoman, southern Okinawa. (a) Panorama of Itoman site. (b) Map view of the total station survey. Itoman reef setting overlain on a Google Earth screenshot (image taken on 1 April 2015) with total station
measurements of the field of microatolls. Sampled microatolls (ITO 1 and ITO 2) are indicated in blue. Red line: location of profile in c, along which all our total station measurements have been projected. PF: Platform. (c) N90◦E projection of our HLS measurements (location in b). Elevation relative to the height of the total station base. (d) Panorama of the site with Ito 2 microatoll highlighted as well as large overturned microatolls. (e) Pictures of the coral (with its approximate morphology, sketch in the bottom right corner) and the slab ITO 1. (f) Pictures of the coral (with its approximate morphology, sketch in the bottom left corner) and the slab ITO 2. Inset: basic drawing of the thick slab before the thin cutting to highlight the main HLS surfaces recorded by the coral. This step is needed before the thin slicing, as the HLS record can slightly vary in the coral (and thus between thin slices) and also to reconstruct the coral upper surface if small pieces are broken during the slicing. For ITO 2, we identified on the thin slice in Figure 5a, a small missing part between about 1939 and 1950 (highlighted with dashed black line in Figure 5a). All HLS surfaces observed on the slab were also found on the thin slice.
observed that it is more eroded than in Itoman and very discontinuous with wide connections to open ocean, both in the north and in the east (Figure 4c). In Yoron, we collected one large fossil microatoll we named YOR-F1 and two living microatolls we named YOR-1-S1 and YOR-11-S1 (Figures 4d, 4e, 4h, and S3e–S3g). We observed emerged platforms in the sites we selected and in almost all islands investigated in the central Ryukyu Arc. These platforms were dated mid- to late-Holocene (e.g., Koba et al., 1982; Pirazzoli & Koba, 1989), and their emergence is being attributed to a combination of eustasy (with a sea level highstand less than 1 m higher than modern sea-level between 3,500 and 1,700 BP) and regional tectonics (for the terrace distribution and elevation through the whole arc; e.g., Koba et al., 1982). Through the analysis of uplifted marine notches, reefs, beachrocks, and barnacles (survey and14C dating), Kawana and Pirazzoli (1985) documented geological evidences of a past earthquake in the southern part of Okinawa that would have occurred about 2,400 years ago. Additional studies (mapping and dating) will be needed to demonstrate if the platforms observed on the field may result from coseismic uplift as in southern Okinawa, which is beyond the scope of this paper.
3.2. RSL Records
We reconstructed the RSL history over the last century from the living microatolls we sampled in Okinawa and in Yoron and over about three centuries of record from the fossil microatoll of Yoron.
3.2.1. Itoman, South Okinawa
The 2.5-m-wide and 0.65-m-high ITO 2 microatoll is the largest we have sampled in Itoman (Figures 2f and S3b). While it is rather flat, the slab stratigraphy reveals that new coral growths have colonized depressions in its center (Figure 5a).
Journal of Geophysical Research: Solid Earth
10.1029/2019JB018466
Figure 3. Survey in the site of Onna, western Okinawa. (a) Panorama of Onna site. (b) Map view of the total station survey. Onna reef setting overlain on a Google Earth screenshot (image taken on 1 April 2015) with total station measurements of the field of microatolls. Sampled microatolls (ONNA 1 and ONNA 2) are indicated in blue. Red line: location of profile in b, along which all our total station measurements have been projected. (c) N90◦E projection of our HLS measurements (location in a). Elevation relative to the height of the total station base. (d) Pictures of the coral (with its approximate morphology, sketch in the bottom right corner) and the slab ONNA 1. (e) Pictures of the coral (with its approximate morphology, sketch in the upper right corner) and the slab ONNA 2.
The coral began to grow radially in 1868 in an unconstrained environment (Figures 5a and 6a). As a result, it developed a ball shape (Figure 5a). It experienced a first HLS drop in 1890 of 5.6 cm (Figures 5a and 6a). During the following 9 years (between 1890 and 1899), the microatoll recorded a stable HLS before a short period of HLS decrease between 1899 and 1906 (Figures 5a and 6a) that ended with a total large drop of 12.5 cm of the HLS (Figures 5a and 6a). In between the two HLS drops (1890 and 1906), we calculate that the microatoll recorded a mean emergence rate of 2.5 ± 1.1 mm/year (blue line on that time period in Figure 6a). The emergence may have been continuous or made of multiple small RSL drops, which could have been smoothed by erosion.
Between 1868 and 1906, ITO 2 was growing in an enclosed pool that was not freely connected to the open ocean until an artificial channel was dug in 1907 (oral informations from Itoman City Office, Figures 2a and 2b). As this coral was moated, it likely recorded the sea-level variations in the pool rather than the true RSL changes in the open ocean. The total station measurements indicate that, at the time of the survey in 2016, the surface of ITO 2 was about 1.5 m below the top of the emerged platform, which acted as a barrier (Figure 2c). In 1890, after reaching a first HLS, the top of the coral was about 15 cm below its level in 2016 (Figure 5a) and thus about 1.65 m below the top of the platform. From the tide predictions for the Okinawa tide gauge (supporting information, Figure S4), we inferred an average tidal range of 2 m, and comparison with our total station measurement highlights that the top of the platform is only slightly below the highest tide (Figure S4). By considering that the tide curve did not change since 1890, which is a
Journal of Geophysical Research: Solid Earth
10.1029/2019JB018466
Figure 4. Survey in Yoron. (a) Map view of the total station survey for the first site. Yoron reef setting overlain on a Google Earth screenshot (image taken on 1 April 2015) with total station measurements of the field of microatolls. Sampled microatolls (YOR-1-S1 and YOR-11-S1) are indicated in blue. Red line: location of profile in b, along which all our total station measurements have been projected. (b) N90◦E projection of our HLS measurements (location in a). Elevation relative to the height of the total station base. (c) Panorama of the first site of Yoron. (d) Pictures of the coral (with its approximate morphology, sketch in the bottom right corner) and the slab YOR-1-S1. (e) Pictures of the coral (with its approximate morphology, sketch in the bottom right corner) and the slab YOR-11-S1. (f) Map view of the total station survey for the second site. Yoron reef setting overlain on a Google Earth screenshot (image taken on 1 April 2015) with total station measurements of the field of microatolls. The sampled microatoll YOR-F1 is indicated in blue. Red line: location of profile in g, along which all our total station measurements have been projected. (g) N90◦E projection of our HLS measurements (location in f). Elevation relative to the height of the total station base. (h) Panorama of the fossil microatoll (with its approximate morphology, sketch in the bottom left corner) and picture of the coral slab YOR-F1.
Journal of Geophysical Research: Solid Earth
10.1029/2019JB018466
Figure 5. Coral stratigraphy of the longest coral records in the central Ryukyu Arc. (a) ITO 2 slab stratigraphy. In yellow: coral skeleton with holes in white. Annual growth bands in black with thicker bands every 10 years. Dashed black lines: unclear bands. As the external ring dates to July 2016, each growth band corresponds to the middle of the year. Dashed red lines with corresponding dates: die downs. Black arrow: coral unconstrained upward growth before reaching a first HLS. Blue arrows: emergence trend (the first that occured in 1906 is a sudden RSL drop related to the channel opening that connected the pool to the open ocean). Red arrow: submergence trend (sudden or gradual). (b) Slab stratigraphy of ONNA 2. Symbols and dates as in (a). (c) Slab stratigraphy of YOR-1-S1. Symbols and dates as in (a). (d) Slab stratigraphy of YOR-F1. Symbols and dates as in (a). Blue dots (with corresponding dates): location of the U-Th dating (results in Table 2). Black arrows with corresponding number: possible changes in the coral record.
Journal of Geophysical Research: Solid Earth
10.1029/2019JB018466
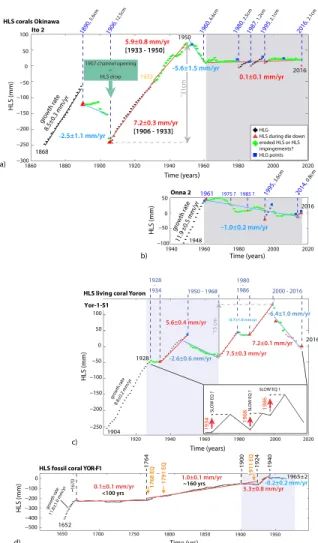
Figure 6. HLS curves of the longest coral records in the central Ryukyu Arc. (a) ITO 2 HLS curve. From the drawing, we plot the upper altitude of each growth band. The reference altitude (0) is the elevation of the 2016 growth band. A HLG data (black diamond) corresponds to complete growth band when the coral did not reach its theoretical HLS (e.g., Zachariasen et al., 1999, 2000) while an HLS data (red triangle) refer to truncated growth band that follow a die down (Meltzner et al., 2010). HLG points correspond to noneroded HLG years recorded before a die down and are highlighted with blue squares. Truncated growth bands for which we have difficulty to decipher between erosion and RSL changes are named eroded HLS or HLS impingements and are highlighted with green diamonds. Dashed blue lines: die down events with dates indicated in blue and amplitudes of the relative sea-level drops in black. Red and blue straight lines: Submergence and emergence rates (given in millimeter per year with 2𝜎uncertainty) calculated by linear regression with all points starting from the first HLS point (e.g., Zachariasen et al., 2000). The upward coral growth rate at the beginning of the coral growth (given in millimeterm per year with 2𝜎uncertainty) is calculated with linear regression. Green rectangle with arrow: major HLS drop around 1906 due to the connection to the open ocean through the construction and the opening of a channel in 1907 (personal communication from Itoman City Office). Double gray arrows with number indicated and dashed gray line: estimate of the RSL increase between 1906 and 1950 recorded by ITO 2. (b) ONNA 2 HLS curve. Symbols, rates, and dates as in (a). (c) YOR-1-S1 1 HLS curve. Symbols, rates, and dates as in (a). Double gray arrows with number indicated and dashed gray line: estimate of the RSL increase over the last 48 years recorded by YOR-1-S1. Inset: schematic record with sudden/gradual submergence events around 1934, 1968 and 1986 that could be due to slow earthquakes (see main text). (d) YOR-F1 HLS curve. Symbols, rates, and dates as in (a). Dashed black lines with corresponding number: possible changes in the coral record. Orange arrows: major reported earthquakes. Gray rectangles: shared record between ITO 2 and ONNA 2. Blue rectangles: shared record between YOR-1-S1 and YOR-F1.
Journal of Geophysical Research: Solid Earth
10.1029/2019JB018466
Figure 7. Coral stratigraphy for the other coral slabs sampled in the central Ryukyu Arc. Symbols and dates as in Figure 5. (a) ITO 1 slab stratigraphy. (b) ONNA 1 slab stratigraphy. (c) YOR-11-S1 slab stratigraphy.
reasonable assumption on such a short timescale, ITO 2 only missed a small part of the tidal cycle (tens of centimeters at most) before the channel opening. This is attested by the sea-level drop of 12.5 cm recorded around 1906 at the channel opening (Figures 5a, 6a, and supporting information, Figure S5). This value corresponds to the difference in elevation between the lowest tide recorded by microatolls connected to the open ocean and those that were located in the previously enclosed pool (Figure S5). The corals in the pool likely did not record the lowest yearly levels of the tidal cycle and the extreme climatic die downs. However,
Journal of Geophysical Research: Solid Earth
10.1029/2019JB018466
Figure 8. HLS curves for the other coral slabs sampled in the central Ryukyu Arc. Symbols and dates as in Figure 6. (a) ITO 1 HLS curve (left), both ITO 1 and ITO 2 HLS curves once the corals reached their first HLS (right). (b) ONNA 1 HLS curve (left), both ONNA 1 and ONNA 2 HLS curves (right). (c) YOR-11-S1 HLS curve (left), both YOR-1-S1 and YOR-11-S1 HLS curves (right). Double gray arrows with number indicated and dashed gray line: estimate of the RSL increase over the last 51 years recorded by YOR-11-S1. Inset: graphic view of the calculation of the net emergence signal recorded by the coral, after the subtraction of the submergence events to the apparent submergence trend (calculated through the whole coral signal that combines periods of submergence and periods of emergence).
as the upper surface of the coral before 1906 was not limited by the top of the emerged platform (as it could be in theory for fully impermeable moated pool, Smithers, 2011), it was able to track the sudden permanent changes in relative sea level or continuous variations over several years in the pool, at a slightly higher level than in the open ocean.
Between 1906 and 1950, the coral recorded a period of rapid upward columnar growth (Figures 2f, 5a, and 6a) that might be divided in two parts (between 1906 and 1933 and between 1933 and 1950) because we observed an HLS impingement around 1933 (Figures 2f, 5a, and 6a). The coral has grown radially in an unconstrained environment at a rate of about 7.2 ± 0.3 mm/year (similar to the coral's natural growth rate established between 1868 and 1890) until it reached an HLS in 1933 (Figure 6a). Then, a second RSL increase at slightly slower rate of 5.9 ± 0.8 mm/year has been recorded until 1950 (Figure 6a). During that period, the coral might have been close to its HLS according to the lower upward growth rate and the shape of the growth bands that seems to flatten the coral's surface with a decrease of the growth band thickness from the side to the top the coral (Figures 5a and 6a). The two RSL increases were sudden and/or gradual at faster rate than the coral's natural growth rate (at least for the period 1906–1933). In total, ITO 2 recorded about 31 cm of RSL increase between 1906 and 1950 (Figure 6a).
The later period was followed by a permanent RSL drop of 6.6 cm that could have started around 1950 (Figures 5a and 6a). Between 1960 and July 2016, the coral mainly grew laterally very close to its HLS and
Journal of Geophysical Research: Solid Earth
10.1029/2019JB018466
was frequently impinged by centimetric RSL drops of 2.5, 1.2, 2.1, and 2.1 cm in 1980, 1987, 1995, and 2016, respectively (Figures 5a and 6a). Whereas the die downs of 1980, 1987, and 1995 were followed by a slight upward growth, the drop of 1960 was permanent and marked the beginning of the main outward growth of the coral (Figures 5a and 6a). We calculated an emergence trend of 5.6 ± 1.5 mm/year between 1950 and 1960 followed by a stability of the relative sea level until 2016 (rate of 0.1 ± 0.1 mm/year; Figure 6a). The second coral we sampled in the site (ITO 1) is also flat, with height to width ratio equal to that of ITO 2 (Figures 2e and S3a). It recorded a shorter RSL history, however, because it began to grow in 1950 (Figures 7a and 8a). It reached its first HLS in 1968 (Figures 7a and 8a) and mainly grew outward. As ITO 2, it recorded centimetric die downs in 1987, 1995, and 2016 (3.4, 2.8, and 1.4 cm, respectively) as well as additional drops in 2004 and 2011 (3.7 and 1.9 cm, respectively, Figures 7a and 8a). Overall, ITO 1 recorded a stability of the relative sea level (rate of −0.03 ± 0.21 mm/year), as ITO 2 did over the same period (Figures 7a and 8a). At a first order, records from both corals are in good agreement despite slight differences in amplitudes of die downs and in the number of HLS impingements. These small stratigraphic differences reflect the small (few centimeters) spatial fluctuations of the modern HLS at the scale of the entire site and reveal the coral's natural variability within a reef in response to RSL changes (Weil-Accardo, Feuillet, Jacques, Deschamps, Beauducel, et al., 2016; Weil-Accardo, Feuillet, Jacques, Deschamps, Saurel, et al., 2016).
3.2.2. Onna, West Okinawa
The longest record in Onna is provided by the 2-m-wide and 20-cm-thick ONNA 2 microatoll (Figures 3e and S3d). The ONNA 1 coral is twice as thick than ONNA 2, because it grew in a deeper part of the reef flat, and is slightly smaller (Figures 3d and S3c). They are both flat to slightly hat-shaped (Figures 3d, 3e, S3c, and S3d), typical of the other hundreds of corals we surveyed (Figures 3a–3c).
ONNA 2 began to grow in 1948 and reached its first HLS in 1961 (Figures 5b and 6b). It then mainly grew outward until 2016 and experienced at least two die downs in 1995 and 2014 of 3.6 and 0.8 cm of amplitude, respectively (Figures 5b and 6b). We possibly missed other die downs (likely in 1975 and 1985) whose resid-ual prints could have been erased by a slight erosion (Figure 5b). The morphology of this coral characterized by a flat surface and a small height implies that ONNA 2 grew in a very shallow environment since 1948. We calculated an emergence rate of about 1 mm/year over the last 55 years (Figure 6b).
ONNA 1 recorded a similar history with an emergence rate of 1 mm/year over the last 33 years (Figures 7b and 8b). It also recorded the die downs of 1995 and 2015 with amplitude of 1.5 and 0.9 cm, respectively (Figures 7b and 8b). Its surface being probably less eroded than that of ONNA 2, additional die downs that occurred in 1986 and 2004 with amplitude of 1.1 and 6.1 cm, respectively (Figures 7b and 8b), were preserved.
3.2.3. Yoron
In Yoron, the two living corals we sampled in the first site are 1.5 m wide and between 50 and 70 cm thick (Figures 4d, 4e, S3e, and S3f). They both display a complex upper surface with clear rims (Figures 4d and 4e). The modern HLS being more than 10 cm lower than the top of the corals (Figures 6c, 8c, S3e, and S3f), we describe them as hat-shaped microatolls (Figure S1).
The coral YOR-1-S1 provide the longest RSL record (Figures 5c and 6c). It began to grow in 1904 and reached a first HLS in 1928 (Figures 5c and 6c). Between 1928 and 1934, the coral grew outward close to its HLS in a stable RSL environment (Figures 5c and 6c). From 1934 until 1950, it grew upward at rate of 5.6 ± 0.4 mm/year, catching-up a sudden or gradual RSL increase (Figures 5c and 6c). YOR-1-S1 kept record-ing alternations of periods of stable to RSL decrease (between 1950 and 1968, 1980 and 1986, 2000 and 2016) and periods of RSL rise either sudden or gradual (between 1934 and 1950, 1968 and 1980, 1986 and 2000) (Figures 5c and 6c).
The neighbouring coral YOR-11-S1 recorded a very similar RSL signal. After 32 years of unlimited upward growth at rate of 9.7 ± 0.2 mm/year, the coral reached its first HLS in 1956 and then recorded periods of stable RSL to RSL decrease characterized by several HLS impingements (between 1956 and 1965, 1981 and 1987, 2000 and 2016), alternating with periods of unconstrained upward growth in a context of a sudden or high-rate submergence (between 1965 and 1981, and from 1987 to 2000, Figures 7c and 8c).
A striking observation is that for both corals, the value of the RSL increase (e.g., the difference between the HLS at the beginning and at the end of the rapid upward growth period) is almost always the same from a period to another one. It ranges between about 8 and 13 cm (around 9 cm in 1934, 13 cm in 1965, or 8 cm in 1968 and 10 cm in 1986 or 12 cm in 1987, Figures 5c, 6c, 7c, and 8c).
Journal of Geophysical Research: Solid Earth
10.1029/2019JB018466
Table 3
Raw Submergence (in Red) and Emergence (in Blue) Rates in Millimeter per Year With 2𝜎Uncertainty, Calculated With Different Methods of Meltzner et al. (2010), Zachariasen (1998), and Zachariasen et al. (2000)
Sample name Time period Raw RSL rate Corrected rate since 1950
mm/year mm/year ITO 2 [1890–1906] −2.5±1.1 ITO 2 [1906–1933]* MIN 7.2±0.3 ITO 2 [1933–1950]a 5.9±0.8 ITO 2 [1950–1960] −5.6±1.5 −8.6±1.8 ITO 2 [1960–2016] 0.1±0.1 −2.9±1.0 ITO 1 [1968–2016] −0.03±0.21 −3.0±1.0 ONNA 2 [1961–2016] −1.0±0.2 −4.0±1.0 ONNA 1 [1983–2016] −1.0±0.6 −4.0±1.2
Naha tide gauge - GPSb [2000–2014] 2.15 −0.53±0.35
YOR-1-S1c [1928–1934] ≈0
YOR-1-S1 [1934–1950]* MIN 5.6±0.4
YOR-1-S1 [1950–1968] −2.6±0.6 −5.6±1.2
YOR-1-S1 [1968–1980]* MIN 7.5±0.3 MIN +4.5±1.0
YOR-1-S1 [1980–1986] −0.7±1.1 −3.7±1.5
YOR-1-S1 [1986–2000]* MIN 7.2±0.1 MIN +4.2±1.0
YOR-1-S1 [2000–2016] −6.4±1.0 −9.4±1.4
YOR-1-S1d [1968–2016] ≈0.6 −2
YOR-1-S1e [1968–2016] ≈ −2.5 -5.5
YOR-11-S1f [1956–1965] 1.4±1.8 −1.6±2.1
YOR-11-S1 [1965–1981]* MIN 8.3±0.7 MIN+5.3±1.2
YOR-11-S1 [1981–1987] −3.7±1.9 −6.7±2.2
YOR-11-S1 [1987–2000]* MIN 10.6±0.4 MIN +7.6±1.1
YOR-11-S1 [2000–2016] −8.8±2.0 −11.8±2.2 YOR-11-S1g [1965–2016] ≈1 −2 YOR-11-S1h [1965–2016] ≈ −3 −6 YOR-F1 ≈[1670–1764] 0.08±0.04 YOR-F1 ≈[1764–1924] 1.04±0.04 YOR-F1 ≈[1924–1940]* MIN 5.3±0.8 YOR-F1 ≈[1940–1965] −0.2±0.2 −3.2±1.0
Note. For periods of RSL stability (according to geomorphologic observations), the rate is written in black. Since all calculation methods give very similar results, we choose to rather use the calculation method of (Zachariasen, 1998; Zachariasen et al., 2000) and considered all HLG and HLS points starting from the first HLS in the linear regression. This method is also more appropriate for corals from Yoron for which we calculate rates on shorter time periods than the whole record duration due to major changes in growth pattern. The last column corresponds to the RSL rate corrected from 3±1 mm/year of regional sea-level rise since 1950 (see main text). We use asterisks to highlight periods of sudden or gradual (at a rate faster than the growth rate) submergence during which the coral upward growth is unconstrained and for which we can only calculate minimum submergence rates (see main text).
aITO 2: period during which growth bands seem to flatten the surface with a decrease of the band thickness from the side to the top of the coral, implying a proximity to the coral HLS and thus that ITO 2 likely recorded a gradual submergence during that period. bNaha tide gauge co-located with a GPS allows to access to both tectonic motion and absolute sea-level trend (e.g., Wöppelmann & Marcos, 2016). The two values for columns three and four are from http://www.sonel.org/.cYOR-1-S1: this part of the signal corresponds to a period during which the coral was close to its HLS (Figures 5c, 6c, and 9).dYOR-1-S1: graphic estimates of the apparent submergence trends recorded since 1968. eYOR-1-S1: Attempts to estimate rates of emergence after removing the effect of the last two submergence periods recorded by both corals.fYOR-11-S1: for this part of the signal, the linear regression indicates a slight submergence but the stratigraphic analysis of the slab rather suggests a period of RSL stability with the coral upper surface close to its HLS (Figures 7c and 8c) which is why we highlight the raw rate in black.gYOR-11-S1: graphic estimates of the apparent submergence trends recorded since 1965. hYOR-11-S1: Attempts to estimate rates of emergence after removing the effect of the last two submergence periods recorded by both corals.
Journal of Geophysical Research: Solid Earth
10.1029/2019JB018466
Figure 9. Comparison of the three longest living coral records for each site. Dashed black lines: attempt of correlation between records. Red arrows: submergence events (sudden or gradual). Blue arrows: likely permanent RSL drops with one that would have started around 1950. Black arrows: average RSL trend over about the last 50 years that slightly varies from slight emergence in Itoman and Onna to slight submergence in Yoron. Double gray arrows with number indicated and dashed gray lines: estimates of the RSL increases recorded between 1906 and 1950 by ITO 2, recorded between 1934 and 1950 by YOR-1-S1, recorded over the last 48 years recorded by YOR-1-S1 (see text) and estimate of the RSL drop recorded by ITO 2 and YOR-1-S1 between 1950 and 1968. Inset in YOR-1-S1 HLS: graphic view of the calculation of the net emergence signal recorded by the coral, after the subtraction of the submergence events to the apparent submergence trend (calculated through the whole coral signal that combines periods of submergence and periods of emergence).
The fossil microatoll YOR-F1 was sampled in the second site of Yoron (Figure 4f). It is almost 8 m wide and 60 cm high and displays a cup morphology indicating submergence (Figures 4h and S3g). We performed U-Th dating along the slab (Table 2 and Figure 5d). According to the four U-Th ages, which are in good agree-ment with each other and the visual counting of the growth bands, this coral would have died about 50 years ago around 1965 ± 2 (Figures 5d and 6d). The inner part of the coral, between the first HLS reached around 1670 and 1924, was smoothed by erosion, and we could not find any residual imprints of past die downs (Figure 5d). It is however clear that the coral recorded a slow RSL increase reaching at most about 1 mm/year during this period of about 260 years with possible changes in rate around 1764 and 1900 (Figures 5d and 6d). The coral is characterized by a well-marked external younger rim, which is higher than the inner part (Figures 4h and 5d). This implies a major acceleration of the submergence with a rate increasing from about
Journal of Geophysical Research: Solid Earth
10.1029/2019JB018466
1 mm/year to about 5 mm/year between 1924 and 1940 (Figure 6d). After 1940, the coral recorded a stable RSL until it died (Figures 5d and 6d).
We observed another fossil coral of similar size and exhibiting the same morphology (with a central plateau and a well-marked external rim) close to YOR-F1. This indicates that the whole site recorded the same RSL history and that the cup shape of the fossil microatolls is not the result of erosion. The fossil coral YOR-F1, being very young, underwent erosion only very recently. This erosion likely smoothed only the upper surface of the central plateau, and erased the subtle marks of small centimetric die downs whose amplitude ranges in average between 1 and 3 cm according to what we observed on other living corals. We are thus confident that the two main changes in the morphology of the coral (around 1764 and within the last decades before the coral death) are reliable marks of past RSL changes.
Moreover, the HLS record of YOR-F1 and the longest HLS record of the living coral YOR-1-S1 are similar in both timing and rate changes over the same period, with a time delay of a few years due to uncertainties on U-Th dating and growth band counting (Figures 6c and 6d with shared records highlighted with blue rectangles).
4. RSL Changes Pattern at Regional Scale
4.1. Comparison Between Onna, Itoman, and Yoron RSL Records
We attempted to compare the RSL record in the three sites we investigated. The longest HLS curves are presented on Figure 9, and all the RSL rates are in Table 3. Since the HLS records between the two living corals sampled at the same site are in good agreement with each other, we will mainly focus on the longest RSL records of each site in the following section.
The largest signal deduced from the microatolls we collected is the ≈31 cm of submergence recorded by the coral ITO 2 in Itoman between 1906 and 1950 (Figure 9). The submergence might be separated in two phases: between 1906 and 1933 and between 1933 and 1950. From 1906 to 1933, the coral grew freely upward by 19 cm at rate of about 7 mm/year (close to the coral's natural growth rate) in an unconstrained environment suggesting a sudden or very rapid submergence rate (faster than the coral's natural growth rate; Figures 6a and 9). This period was interrupted by a discrete HLS impingement in 1933, followed by a rapid submergence at a slightly lower rate (5.9 ± 0.8 mm/year) than before (Figures 5a, 6a, and 9). During almost the same period, between 1934 and 1950, the living coral YOR-1-S1 also recorded a period of submergence at high rate (5.6 ± 0.4 mm/year; Figure 6c and 9). A striking change in morphology of the Yoron fossil coral YOR-F1 occurred in 1924 with the development of the well-marked external rim in a submergent context at a rapid rate of 5.3 ± 0.8 mm/year until 1940 (Figure 5d). It is noteworthy that the signal of living YOR-1-S1 is similar to fossil YOR-F1 but delayed by 10 years. This highlights the uncertainties (few years) in the chronology we have established by combining U-Th ages and growth band counting. The signal recorded by the three corals is very consistent and reveals a major about 15–20 years long lasting submergence event, sudden or gradual between ≈1930 ± 5 and ≈1950 in south Okinawa and Yoron. The submergence was about 9 cm in Yoron (for both YOR-1-S1 and YOF-F1) and about 12 cm in south Okinawa (Figure 9).
After this submergence event, the microatoll ITO 2 recorded a permanent RSL drop of about 7 cm between 1950 to 1960 with an emergence rate of 5.6 ± 1.5 mm/year (Figures 6a and 9). This episode coincides in time and in amplitude with a period of RSL decrease between 1950 and 1968 recorded by YOR-1-S1 through numerous HLS impingements from which we calculated an emergence rate of 2.6 ± 0.6 mm/year (Figures 6c and 9). This episode was also recorded by YOR-11-S1 between 1956 and 1965 and results in several HLS impingements starting in 1956 in a rather stable setting that followed a long period of radial growth in an unconstrained environment (Figures 7c and 8c). Similarly, the ONNA 2 coral also reached its first HLS during this period in 1961 (Figure 9). The fossil coral YOR-F1 in Yoron died around 1965 ± 2 during the same period (Figure 5d). Few years before its death, the coral was very thin (17 cm, Figure 5d). Most of the corallites of the corals were likely dead, probably due to an accumulation of sand at the base of the coral, maybe during a tropical storm, and a small emergence event was sufficient to kill this remaining and fragile marginal living part. Overall, our observations suggest that a major RSL drop, of about 7 cm of ampli-tude and that occurred between 1950 and 1960–1968, has affected all corals of the region both in Okinawa and Yoron.
Over a shared period, between 1960 and 2016, the records of Itoman and Onna are in good agreement with a stability of the relative sea level in Itoman and a slight emergence at Onna interrupted by die down events,
Journal of Geophysical Research: Solid Earth
10.1029/2019JB018466
which are better preserved in the Itoman record (Figures 9 and Table 3). In Yoron, over the same period, the signal is very different with an alternation of phases with rapid coral upward growth (sudden or gradual submergence) and 6 to 18 years long periods during which the coral was close to its HLS and recorded a signal of emergence (Figures 5c, 6c, 9, and Table 3). From this combination of submergence and emergence periods, we calculated a mean submergence rate of about 0.6 mm/year over the last 48 years (between about 1968 and 2016 in Figure 9). After the subtraction of the RSL increases recorded by YOR-1-S1 since 1968 (15 cm in total during the two submergence periods), we calculate a net emergence trend of about 2.5 mm/year (Table 3 and Figure 9). Similarly, we calculate a mean rate of submergence of 1 mm/year for YOR-11-S1 between 1965 and 2016 (Figure 7c and 8c). By removing the RSL increases of the two submergence periods having occurred around the same time as YOR-S1 (20 cm in total, Figure 8c), we calculate a net emergence of 3 mm/year (Figures 8c and Table 3). These emergence rates of 2.5 and 3 mm/year are in good agreement with the slight emergence trend inferred from Okinawa records.
4.2. The Coral Signal Versus Tide Gauge and Satellite Records
In order to better understand the RSL signal inferred from coral records, we have analyzed the signal from the available tide gauges in the Ryukyu Arc (Figure 1a). We have considered records over the whole arc to decipher the origin of the RSL signal (regional and/or local). We selected the six longest records (ranging from 30 years for the shorter record of Nakanoshima to 55 years for the longest record of Naze, Figure 10b) to minimize, as much as possible, bias in sea-level trend due to interannual and interdecadal sea-level varia-tions (e.g., Douglas & Peltier, 2002). Two tide gauges are available at Okinawa island (Naha and Okinawa tide gauges; Figures 1 and 10b). Unfortunately, we did not find any record in Yoron island. The RSL rates, calcu-lated by linear regression, range between 0.5 ± 0.7 mm/year at Naze and 4.4 ± 1.5 mm/year at Nakanoshima (Figure 10b). The RSL rates vary from one island to another one (Figures 1 and 10b). Over a shared period, the two closest tide gauges of Naha and Okinawa recorded a similar submergence rate of 1 mm/year for the last 40 years (Figure 10b). This slight submergence differs from the stability to slight emergence recorded by the corals of Okinawa (Figures 9 and 10b). When the mean RSL rate is small and the record is short, however, the morphology of microatolls may vary from a subtle cup to a subtle hat shape at the same site. This has been observed among coral microatolls from Haiti, which have grown in a context of very slow-increasing sea level (Weil-Accardo, Feuillet, Jacques, Deschamps, Saurel, et al., 2016). In such cases, the short period RSL fluctuations might have a large impact on corals, as well as on tide gauges, and longer records are needed to estimate the mean rate.
Numerous annual extreme RSL drops were recorded by the tide gauges of Naha and Okinawa like in 1980, 1986, 1995, and 2014 (blue circles in Figure 10b), which were also recorded as die downs by the microatolls of Onna and Itoman. This is an excellent indication of the reliability of the coral microatolls to record such interannual RSL fluctuations as natural tide gauges. In the coral stratigraphy, die downs are followed the year after by upward growth for several years, which implies a temporary origin. As well, we can observe in tide gauges that the sea level goes back to its initial level in the following months to one year in general. These emergence events are likely drived by climatic modes (as the El Nino South Oscillation in the Pacific Ocean, the Indian Ocean Dipole in the Indian Ocean or the North Atlantic Oscillation in the Atlantic Ocean), with an interplay between ocean and atmosphere that generates changes in wind, sea-surface temperature and the sea level (e.g., Becker et al., 2012; Lombard et al., 2005). Interannual sea-level drops of climatic origin have been previously identified in coral microatolls (e.g., Meltzner et al., 2010; Philibosian et al., 2014; Woodroffe & McLean, 1990; Woodroffe & Gagan, 2000). Further investigation of the origin of the die downs recorded by Ryukyu microatolls is beyond the scope of this paper, because a study at a more regional scale would be required, as well as geochemical analysis (e.g.,𝛿18O, Sr/Ca … ; Abram et al., 2008). Temporary positive sea-level anomalies are also observed in the Ryukyu tide gauges but as for the negative anomalies, the sea level goes back to its initial level rapidly. This is not observed in coral microatolls that rather recorded submergence for several years.
The longest tide gauge of Naze is located 180 km northeast of Yoron (Figure 1a) recorded between 1961 (beginning of its record) and 1969 four successive RSL drops that create a negative RSL trend with a total amplitude of about 11 cm (Figure 10b). This coincides with the 10-5 years long period of 7 cm RSL drop recorded by corals microatolls between 1950 and 1960-968 (Figure 9). As well, a decadal regional sea-level drop is found at the same time in tide gauge records from Japan mainland (Sasaki et al., 2017) that would reflect multidecadal sea-level oscillations driven by climate variability. Indeed, the work of Meyssignac et al. (2012) highlighted that regional sea-level trend patterns are not long-lived features. As an example, they
Journal of Geophysical Research: Solid Earth
10.1029/2019JB018466
Figure 10. Other regional RSL records. (a) Satellite altimetry data (NOAA data) for the Pacific Ocean. The regionally rising trend of about 3 mm/year since 1992 would have been almost unchanged since 1950 according to sea-level reconstruction of Meyssignac and Cazenave (2012). (b) Tide gauges (PSMSL annual data) with trend (straight red lines with rate in millimeter per year, with 2𝜎uncertainty). Green ellipsis and dashed green lines: period between 1961 and 1969 during which the Naze tide gauge recorded an emergence trend (see text). Blue circles and dashed blue lines: interannual RSL drops recorded by the tide gauges, in synchronicity with the die downs recorded by microatolls (see text). The two surrounding tide gauges of Naha (1967–2015) and Okinawa (1975–2015) recorded slow submergence (around 1 mm/year over the shared period 1975–2015).
identified east-west oscillation every 17 years in the tropical Pacific mainly driven by the El Nino South Oscillation (Meyssignac et al., 2012). In their sea-level reconstructions, however, the signal in the Ryukyus appears rather stable through time (Meyssignac et al., 2012). In any case, the permanency of the RSL drop, at least in the Itoman coral record (Figure 9), differs with the temporary sea-level oscillations observed in Naze. This might mean that the synchronicity between coral and the Naze records (and possibly other tide gauges from Japan mainland) for that drop is only a coincidence, and their origins are likely different. In Naha, we have access to a value of the vertical land motion because the Naha tide gauge is colocated with a GPS. The GPS data are available at the Sonel website (http://www.sonel.org/) and are used to correct the RSL changes recorded by the tide gauges from local or more regional tectonic signals (e.g., Wöppelmann & Marcos, 2016). Between 2004 and 2014, the Naha GPS recorded 0.53 ± 0.35 mm/year of uplift, leading to an absolute sea-level trend of 2.68 ± 0.49 mm/year (http://www.sonel.org/ and Naha tide gauge record in Figure 10). The two closest other tide gauges colocated with nearby continuous GPS—Chichijima in the