HAL Id: hal-00800408
https://hal.archives-ouvertes.fr/hal-00800408
Submitted on 13 Mar 2013
HAL is a multi-disciplinary open access
archive for the deposit and dissemination of
sci-entific research documents, whether they are
pub-lished or not. The documents may come from
teaching and research institutions in France or
abroad, or from public or private research centers.
L’archive ouverte pluridisciplinaire HAL, est
destinée au dépôt et à la diffusion de documents
scientifiques de niveau recherche, publiés ou non,
émanant des établissements d’enseignement et de
recherche français ou étrangers, des laboratoires
publics ou privés.
Improving Supervised Classification of Activities of
Daily Living Using Prior Knowledge
Anthony Fleury, Norbert Noury, Michel Vacher
To cite this version:
Anthony Fleury, Norbert Noury, Michel Vacher. Improving Supervised Classification of Activities of
Daily Living Using Prior Knowledge. International Journal of E-Health and Medical Communications
(IJEHMC), IGI, 2011, 2 (1), pp.17-34. �hal-00800408�
Improving Supervised Classification of Activities of Daily
Living Using Prior Knowledge
∗Anthony Fleury, University Lille Nord de France, France
Norbert Noury, INL-INSA Lyon Lab, France
Michel Vacher, Laboratoire d’Informatique de Grenoble, UJF-Grenoble,
Grenoble-INP, CNRS UMR 5217, Grenoble, France
A
BSTRACTConstant growing of the mean age of the population and bottleneck created at the entry of institutions makes telemedicine for elderly people an actual challenge largely explored. It requires recognizing the behavior and actions of a person inside his home with non-intrusive sensors and to process data to check his evolution. This paper presents the results of the study of prior introduction, in Support Vector Machine, to improve this automatic recognition of Activities of Daily Living. From a set of activity performed in a smart home in Grenoble, we obtained models for seven activities of Daily Living and test the performances of this classification and the introduction of spatial and temporal priors. Finally, we discuss the different results.
K
EYWORDS:
Daily Living, Independent Living, Life Expectancy, Support Vector Machine, Telemedecine.1
Introduction
During the past 15 years, telemedicine, telemonitoring and assisted living have been fields of research very active due to the evolutions in the sensor production and to the increase of performances of computing units (Noury et al., 2003; Chan et al., 2008). Moreover, the evolution of the demography in the world begins to be critics and nowadays the number of places in institutions able to welcome elderly people that are not anymore autonomous is largely lower than the demands for the entry in such place. That is the reason why researches in the field of
∗
Reference of the published paper of this draft: @article{FLEURY-JEHMC11,
author= "Anthony Fleury and Norbert Noury and Michel Vacher",
title= "Improving Supervised Classification of Activities of Daily Living Using Prior Knowledge", journal= "International Journal of E-Health and Medical Communications",
publisher= "IGI Publishing, Hershey-New York, USA", month= "march",
year= "2011", volume= "2", number="1", pages="17 - 34",
keywords= "Daily Living, Independent Living, Life Expectancy, Support Vector Machine, Telemedecine", issn="1947-315X EISSN: 1947-3168", }
1 INTRODUCTION
smart sensors and smart homes try to find ways to assist the monitoring of person automatically, launching alarm when needed, either in case of the detection of a severe problem such as fall for instance (Noury et al., 2007; Bourke et al., 2007; Bourke and Lyons, 2008), or in case of detection of a modification in the uses of the person that could indicate a problem (Campo et al., 2010). To monitor person at home, we have to get interested on the part that the geriatricians tries to follow: the autonomy and performing of Activities of Daily Living (ADL). That is the reason why our work, presented in this paper, is focused on the automatic recognition of activities of daily living in smart environment.
In the literature, we can find a large spectrum of different smart home environments and experimental protocol to use and test them for activity recognition. For instance, (Philipose et al., 2004) explored the thematic using RFID tags on a large number of objects (more than a hundred) and tried to infer the activity that was performed considering the objects touched by the person using a glove with a RFID receiver and also a Gaussian curve describing the mean time of execution of each activity. They considered 14 activities and made experimentations on 14 persons. Dynamic Bayesian Networks gave them 88% of global detection accuracy. (Hong et al., 2009) also used RFID tags on foods and objects to create models for the activities “preparing a drink (cold or hot)” and “Hygiene”. Using Dempster-Shafer Theory, they presented the values of the belief and mass functions that show the possibility to distinguish between both activities with this configuration. Related to this work, (Nugent et al., 2008) also tested the impact of sensor failures on recognition using the evidential theory. (Kröse et al., 2008), in the CARE project, also tried to differentiate between two activities (“going to the toilets” and “exit from the flat”) using the data from a lot of sensors (switch, environmental, etc.) and considering Hidden Markov Models for classification. They achieved promising results and presented them for two elderly people (contrary to other studies made on young individuals).
Some other sensors can be used, such as FSR arrays. FSR are Force Sensing Resistors. (Kim et al., 2009) set-up FSR on sofa, table, toilet seat, top of toilet bowl and bed; and combined this set of arrays with an accelerometer-based sensor that is placed on the belt of the person. The presented results aimed at detecting the beginning and the end of the night with these sensors. On/off switches can also inform on the use of some objects (Tapia et al., 2004). These sensors are simple switches that detect the use of a particular object at home. These switches can transmit their data and also their identifier (which corresponds to a location and an object). From this data, for each activity recorded, we build a vector of features, which takes into account the use of a sensor or not, the way it is used, and if another sensor has been used before. The sensors are used on various doors, on specific objects such as cabinets, and also on electrical devices (microwave oven, TV, etc.). The authors tried to learn models for 35 activities using Naïve-Bayes network with the described features. The results are presented for activities with a minimum number of occurrences (at least six) and for two individuals. The maximum number of activities was eight. The results presented ranged from 7%to 30% of adequate classification, depending on the activity. Better results are presented for the activity detected in the “best interval” (with a confidence interval of time before and after activity).
(Tsukamoto et al., 2008) and (Berenguer et al., 2008) tested the use of electrical signatures to detect different various activities of daily living. Indeed, by using pattern recognition on the electrical network it is possible to infer what materials are being used, and when they are turned on and off. In the last paper, the authors presented the detection of the activity “take a meal” on 18 aged people whose flat were monitored.
2 HEALTH SMART HOME – TIMC-IMAG LAB
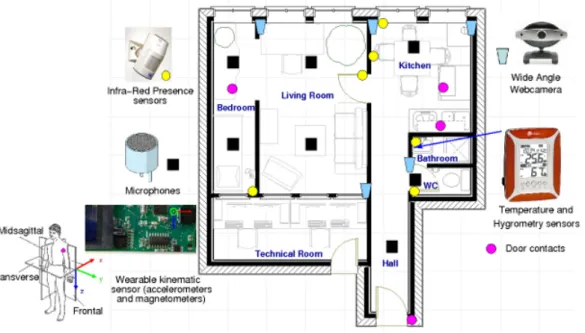
Figure 1: Map of the flat as currently set-up at TIMC-IMAG Laboratory and location of the different sensors.
Some other smart homes try to reduce the number of sensor using mostly video cameras as sensor and analyzing it as a scene. (Libal et al., 2009) uses the signal of 3 videos cameras and 24 microphones to try to recognize 6 different activities in a smart environment. Audio and video are processed separately and fused. Then GMM are trained to recognize the activities from the features vector extracted from both audio and video.
As previously presented, there are multiple configurations of sensors, flats and also validation. For this work, we were based on a flat that is developed since 10 years at the TIMC-IMAG laboratory and that will be presented in the next part. The third part will present the Activities of Daily Living classification using support vector machines. Then, on the fourth part, we will introduce the addition of priors to this generic classification before presenting, in the sixth part, the results of these classifications, with and without priors, on our initial dataset of seven Activities of Daily Living recorded in a smart environment. The final part will be devoted to the discussion and conclusion of the results obtained in the paper.
2
Health smart home – TIMC-IMAG Lab
Since 1999, the AFIRM team of the TIMC-IMAG laboratory is working on a Health Smart Home at the faculty of Medicine of Grenoble. This flat is fully equipped, with all the necessary rooms (as described on Figure 1), and all the equipment that we can find in a normal apartment (fridge and microwave oven in the kitchen, TV and radio in the living room ...).
3 SUPERVISED MODELING AND CLASSIFICATION OF ADLS
first sensors that have been used are the Presence Infra-red Sensors, passive sensors that are able to detect a movement in a cone of reception. They are placed all over the flat to cover the movement of the person in the different location, especially in the region of interest (bed, table of the kitchen, etc.). These sensors also equipped other locations that have been set-up by the laboratory in hospital suites and in real home of elderly people. They have produced years of data that are analyzed to detect trends in the behavior of the person (Virone et al., 2002) and also alarms that can be raised in case of abnormal situation detection (Noury et al., 2006). For this system, the important measurement are the agitation and mobility (Bellego et al., 2006), that are two variables that indicate respectively the movement habits of the person inside the same area or from one area to another (an area being a room or a specific location of the flat). Then, the second step has been to work, with the former CLIPS laboratory (now LIG, team GETALP), on the integration of their sound and speech recognition system and the application of this sensor to the problematic. This integration has been done (Istrate et al., 2006) and the system has been validated in semi-wilde conditions (Vacher et al., 2010). This system uses eight microphones linked to a computer equipped with a software that is able to recognize the different sounds of daily living (step, door locking or shutting, dishes, object fall, phone ringing, screams, and glass breaking) and also to translate the voice into the pronounced (the five most probable) sentences in French. For the speech recognition, it also learnt some distress sentences with specific weight to be able to recognize them and launch alarms.
This whole setup has been completed during the last years to add other sensors and video cameras (Fleury et al., 2010). The first new sensors are door contacts on the fridge, chest of drawers and cupboard. We also added a sensor in the bathroom that indicates the temperature and hygrometry every five minutes. Finally, a wearable sensor is placed in the tee-shirt of the person. This sensor indicates the posture of the person at each moment (sit, lie or stand) and the walking episodes (Fleury et al., 2009).
In addition to all of the previous ones, we added wide-angle video camera to have a vision of the whole flat. They were not used as a sensor but only as a way to timestamp the performed activities afterward. They cover the whole flat except the bathroom and the toilets. For these two rooms, for privacy considerations, only the door of the room is recorded and the persons were asked to close the door differently depending if the activity concerned the bathroom or the toilets.
All these sensors have been chosen for the information brought in the context of activity recog-nition and also for the ease and possibility to install and use them. They are then used in a classification process that aimed at determining the activity currently performed and that is presented in the next section.
3
Supervised Modeling and Classification of ADLs
3.1
Activities of daily living considered
This work aims at being part of the follow-up for a person by geriatricians in a telemedicine context. To make it the more informative, we used, as a base, the scales that are used in this field classically, that is to say the ADL scale (Katz and Akpom, 1976) and one of its variation in
3 SUPERVISED MODELING AND CLASSIFICATION OF ADLS3.2 Multi-modal consideration for ADL recognition
France the AGGIR scale. ADL scale is interested by six different activities: (1) is the person has to receive assistance for bathing either the entire body or a part of it, (2) is the person is able to find clothes, and dress or undress (except tying shoes), (3) ability to use the toilet, (4) capacity to transfer (move out from a bed or a chair without external assistance), (5) full control of the bowel and bladder, (6) ability to feed oneself (except an help for cutting meat or buttering bread for instance). During the evaluation with the geriatrician, the elderly people have to answer these questions by yes or no. Depending on these answer, a level of autonomy is determined. As far as AGGIR scale is concerned, it defines ten discriminatory items (coherence, orientation, toilet use, dressing, feeding, bowel movement, transfers, moving inside the flat, moving outside, and communication with the external world) and seventeen illustrative (as handling money or taking transport – cab or bus). Depending on the ability to do the ten ones either alone, with partial or total assistance, this grid defines six levels of autonomy that are then used to determine the institutionalization of the person or his access to financial or material assistance.
From the consideration of these scales, we determined seven activities of interest that we would like to automatically recognize in our health smart homes. These are the following:
• Sleeping: for this activity, a bed is available in the bedroom,
• Preparing and having a meal: we put all the necessary (even all the kind of food) to prepare a breakfast in the flat,
• Dressing and undressing: for this activity, clothes were available in the chest of drawers, • Resting: it is the broadest activity as it does not have a specific definition. This activity
includes watching TV, listening to the radio, reading a book, sitting down on the sofa... • Hygiene: for this activity, for simplicity, we considered the tooth brushing and washing of
the hands.
• Bowel movement: this activity covers the toilets use.
• Communication: this final activity is the ability to communicate on the phone with the external world. In our protocol, the subject was called five times on the phone and has to answer with given previously created, phone conversations, which were randomly selected.
3.2
Multi-modal consideration for ADL recognition
For such recognition, there is no adapted sensor able to indicate the activity currently performed. Indeed, an activity is a combination of one or several locations, a set of movement, a set of interaction with object... Moreover, to implement it in a process of activity recognition, we must find some features that allow discriminating the different activities for every people. Performing one activity (for instance preparing a meal) is not unique and a same person will not perform a same activity twice exactly in the same way.
For these reasons, the previously described sensors were considered and a former analysis was done in order to choose the best representative features for activity description. This feature analysis is presented in the next section.
3.3
Features
A first experimentation was performed to collect few data related to the ADL. The results of this experimentation were used to compute a very large number of features and then to extract the
3.4 Classification with SVM 3 SUPERVISED MODELING AND CLASSIFICATION OF ADLS
most relevant for our test dataset. The final feature set is described in Table 1. These features are then computed on our new dataset of the seven activities that will be described later and used in the SVM process for activity classification.
Modality Features selected
Actimeter Percentage of time spent in the different postures (stand, sit, lie) and walking Microphones Number of events per class and number of events per microphones PIR Percentage of time in each rooms and number of events for each detectors
Door contacts Percentage of time in “open” position and predominant state (open/close) in the considered time slot Environmental Differential measure for the last 15 minutes for temperature and hygrometry
Table 1: Sum-up of the sensors and their associated features.
3.4
Classification with SVM
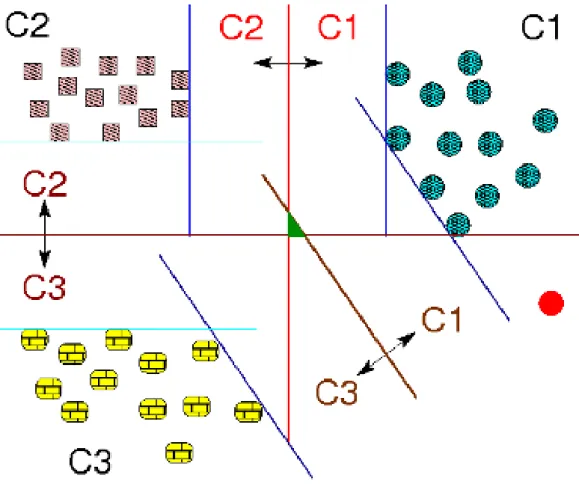
Support Vector Machines (SVM) has been introduced by (Boser et al., 1992) as a way to solve binary classification problems whether linear or non-linear. SVM tries to determine, using optimization, a separating hyperplane for the two different classes and trying to maximize the “safety margin” from this hyperplane to the closest vectors of the subset for each class. These vectors, which are the main data entering in consideration for the construction of the solution, are the support vectors (that support the margin). We can see an illustration of this principle on Figure 2 between classes C1 and C2 for instance. All the equations relating to SVM are based inner product for the considered vectors. To solve non-linear classification problems, we use a kernel function, that acts as an inner product and that map the input space into a higher dimension space called feature space. If correctly chosen, in this new space, the problem turns into a linear classification problem for which the separation can be found easily. The kernel used for our application is the Gaussian kernel defined by:
K(xi, xj) = exp −kxi− xjk 2 2σ2
In this equation, the hyper parameter s is optimized during the learning session considering the training examples.
From their constructions, SVM have a good capacity for generalization of a problem (that is to say good results when classify new items) in a large set of applications (Burges, 1998), in which it performs at least as well as other classification processes and often better. That is a reason why we chose this algorithm for this problem in which we have to cope with a very few training dataset.
This process is previously defined for binary classification. In our application, we have seven classes (for the seven activities), and so we face multiclass classification problem instead of binary. To use SVM into multiclass problems, three methods can be used. We chose the method one-versus-one (Knerr et al., 1990) in which we construct N·(N −1)
2 classifiers using all the pairwise
combinations of the N classes (see on Figure 2). We then took the decision using majority voting. Each new sample is sent for classification to all the classifiers and the decision that has the most important number of hits is the final taken decision. In case of equality, we consider the classifier
3 SUPERVISED MODELING AND CLASSIFICATION OF ADLS 3.4 Classification with SVM
Figure 2: Illustration of the SVM principle and of the one-versus-one multiclass classification method.
that has the highest margin (as it is the “safer” one). This method for multiclass classification has been preferred to one-versus-all because of our little number of samples. Indeed, one-versus-all will construct N classifiers that will be unbalanced. On larger datasets, it could be insignificant but in our case it should be a disaster with the little number of samples in some of the classes. The second reason why we prefer one-versus-one was also because with this method, the area in which the decision cannot be taken is smaller (colored part on Figure 2). We also prefer this method to M-SVM (Multiclass SVM) (Guermeur, 2002) and again it is because of the little number of samples. M-SVM has to solve a linear problem largely more complex than binary SVM and with few samples in some classes, the system leads to a singular matrix (the optimization problem has then no solution).
3.5 Experimental dataset 3 SUPERVISED MODELING AND CLASSIFICATION OF ADLS
3.5
Experimental dataset
3.5.1 Protocol
The process of classification needs data for training and testing, and these data must be as realistic as possible for usable results. To obtain these data, we performed experimentation with different person in the previously introduced flat. This experimentation was quite simple. First, a deep visit of the flat was performed with the experimenter so that the person can act in it as if he were home. Then, he was asked to enter the flat alone, and to perform, at least once, all of the seven activities. There was no instruction on either the order in which the person has to do the activity, the way to do it or the time spent for each one. He was totally free to perform it as normally done at home and to spend as much time as needed to do the activities.
After the experimental session, for each participant, an XML file that describes the whole followed scenario was created using the video camera recordings.
This experimentation was performed by 13 healthy and young subjects (six women and seven men). The average age was 30.4 ± 5.9 years (24–43, min–max), height 1.76 ± 0.08 m (1.62–1.92, min–max), and weight 69± 7.42 kg (57–80, min–max). The mean execution time of the experiment was 51 min 40 s (23 min 11 s–1 h 35 min 44 s, min–max).
3.5.2 Dataset
From this experimentation, we obtained more than 11 hours of recording. These records have been analyzed to create the XML files containing the information on the exact timestamp of the beginning and end of each activity.
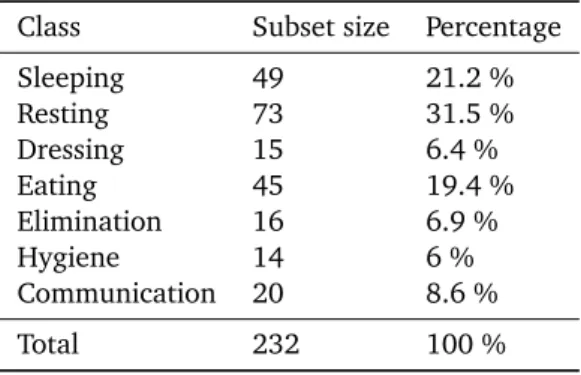
For our work, we considered fixed-time frame of 3 minutes and our goal was to classify, as perfectly as possible, these frames. This value (3 minutes) has been chosen because it is the mean time of execution of the shortest activity. These frames are independent, without aliasing. Table 2 presents the repartition of the different frames in the seven classes. As we can notice, this repartition is highly unbalanced. Indeed, when we ask to people to sleep as much time as they want and then to spend as much time as they need to wash hand and teeth, the time for both activity is largely not the same. It is so very likely to obtain such repartition.
Class Subset size Percentage
Sleeping 49 21.2 % Resting 73 31.5 % Dressing 15 6.4 % Eating 45 19.4 % Elimination 16 6.9 % Hygiene 14 6 % Communication 20 8.6 % Total 232 100 %
4 INTRODUCING PRIORS IN THE CLASSIFICATION PROCESS
3.5.3 Validation protocol
The validation is performed using leave-one-out method on the global dataset. Indeed, with the little number of sample in some classes as hygiene or toilets use, it is difficult to perform multi-folds (stratified or not) validation or even to validate keeping one subject against all the others. The unbalancing of the dataset should be more important with other methods. So for this validation, we take one sample out of the dataset. Then, we normalize the data and keep the normalization coefficients. We learn with the 231 samples that were previously normalized, and we test on the sample we kept out. This last sample is normalized using the coefficient of normalization of the 231 samples. We repeat this operation for all the samples of the dataset.
4
Introducing Priors in the Classification Process
4.1
Why considering prior knowledge for activity recognition?
In the previous part, that describes the classification process, we explained that we construct models to differentiate each pairs of activities for the seven ones. Then, majority voting rule is used to determine which of the seven activities is the most probable for this frame. To sum-up, this process can be seen as a black-box with two inputs and one output. The first input is the binding of the models constructed by optimization during the training phase. These models are the equations of the different separation for each SVM of the problem. The second input is the set of features for the specific time frame which must be classified. According to the models and to the specific values of the features, the output is then the classification result in one of the seven classes.
According to this description, it becomes evident that this process looks at the data without knowing them. Indeed, no matter, for instance, what the data on the 5th feature is, the important is where the point is located in the feature space to determine, for a specific SVM, if it is the class Ci or Cj.
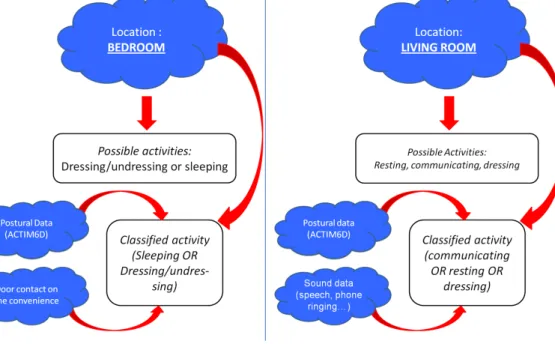
Another approach would be to try to interpret these data. Figure 3 gives two examples of activities and decision in multimodal environment. For the first one, on the left, the person is in the bedroom. From this location, we can reduce the number of possibilities from seven to only two different activities. We have only one classifier to use then to determine the result. This classifier will use the postural data (if the person is lying down or not, etc.) and the data of the door contact of the chest of drawers. For these two last variables, we can consider that, now that we have reduced the number of possibilities, they will be correctly learnt by the classifier and then we only consider as prior the location in the bedroom.
It is exactly the same thing on the second example. The person is in the living room, with three possibilities: resting, communicating and also dressing (because there is no wall between the bedroom and the living room at this place, so aliasing problems can appear). Considering the postural data and the sound data, we can determine easily which of the three remaining class is the most probable for this frame.
The method described in the two previous paragraphs interprets partially the data to first reduce the number of possibilities in the classification process and then use the other dimensions to
4.2 Priors introduction method4 INTRODUCING PRIORS IN THE CLASSIFICATION PROCESS
Figure 3: Illustration of the reduction of the number of possible class using different sensors and priors.
classify between the remaining possibilities. This kind of method will be used to introduce prior knowledge in our classification process in order to try to improve the classification results.
4.2
Priors introduction method
We can imagine two methods for introducing priors in our process. The first is to tune the classifier considering the knowledge, by adding some additional equations to the initial optimization problem. We consider the interesting priors that are location and time in our case. For this application it will be difficult to obtain a robust solution introducing knowledge like this because of the majority voting part that is performed after the classification and also another time because of the little number of samples for the learning process.
For these reasons, we decided to apply a pre-process to the data allowing the introduction these priors. We have a set of rule and depending on this rule; we can activate some of the classifiers and take the decision with majority voting on the only classifiers that are activated. The rules that are considered are described in the three following sections.
4.3
Priors based on the location
When a person is trying to understand an action, two major variables are important: “where” and “when” (indeed the “who” is not important in this work). The first is so the location of the person (as shown as example on Figure 3). We considered as pre-process to take the percentage
4 INTRODUCING PRIORS IN THE CLASSIFICATION PROCESS4.4 Priors based on the time of the day
of time spent in each room (that is one of our feature) and to consider the maximum. If this maximum is greater than 80% (so if more than 80% of the 3 minutes frame is spent in one room) then we consider that this frame is assigned to this specific room. If it is not the case, the frame is not assigned to a room.
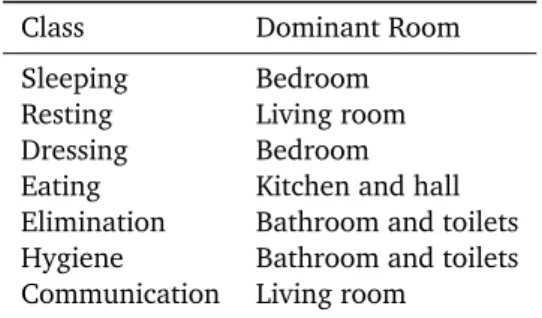
The seven activities that we consider are relatively precise. Indeed, we can assign them to a specific location that is the most common and the most use to do so. For instance we know that preparing and having a meal will be done in the kitchen and that sleeping will be done in the bedroom. We assigned the communication activity to the living room because the phone is in it. Finally, we assigned dressing to the bedroom (even if we wrote previously in this paper about possible aliasing problems with the living room) because in case of dressing, even if there are detections in the living room, the majority of the activity will be detected in the bedroom. As we consider the dominant room for each activity, that is a possible assignment scheme. It is not the case for hygiene and toilets use. There is also no separation between the two rooms but the overlap area is more important. In that case, we assigned both activities to both rooms. Finally we can also notice that eating is affected to kitchen and hall, because of the sensor of the hall also “monitor” the sink and some of the chairs of the table of the kitchen. Table 3 sums-up all these assignations.
Class Dominant Room Sleeping Bedroom Resting Living room Dressing Bedroom Eating Kitchen and hall Elimination Bathroom and toilets Hygiene Bathroom and toilets Communication Living room
Table 3: Repartition of the dominant room for the different activities.
4.4
Priors based on the time of the day
By the same token, we can work on the time of the day which is the “when” clause of the activity. When the action is performed is important, especially for elderly people that have uses and routine in their lives. Let’s take the example of an activity in the bedroom. The two possibilities are sleeping and dressing. If it is 3PM and that the person finished his lunch at 1:30 PM, we can imagine that it is more likely that he is sleeping (nap time) than dressing.
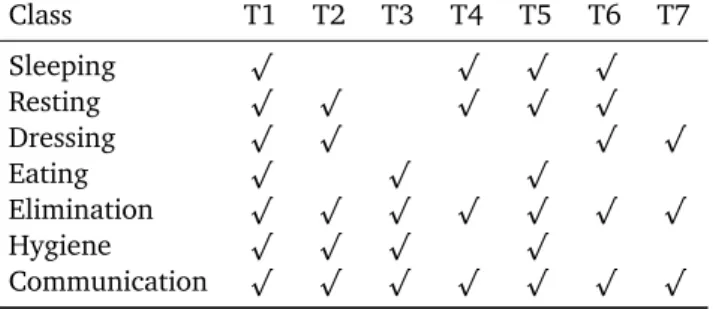
For that reason, we split the day in seven periods of time. These periods are organized as follow: T1 represents the breakfast (from 7 AM to 9 AM), T2 the morning (from 9 AM to 12 AM), T3 the lunch (from 12 AM to 2 PM), T4 the afternoon (from 2 PM to 7 PM), T5 the diner (from 7 PM to 9 PM), T6 the evening (from 9PM to 11 PM) and finally T7 for the night (from 11 PM to 7 AM). We then attribute the seven activities to a subset of the seven time slots trying to keep the models as general as possible. The possible considered slots for each activity are displayed on Table 4. We tried to be general and logical; however, this model can be easily adapted knowing a specific
4.5 Priors based on aggregation of both location and time4 INTRODUCING PRIORS IN THE CLASSIFICATION PROCESS Class T1 T2 T3 T4 T5 T6 T7 Sleeping p p p p Resting p p p p p Dressing p p p p Eating p p p Elimination p p p p p p p Hygiene p p p p Communication p p p p p p p
Table 4: Repartition of the time slots for the different activities.
target population and its uses. As we can see on Table 4, eating is possible at time of breakfast, lunch and dinner and sleeping is possible during night, morning, afternoon and late evening. Some of the activities are not restricted in time. For instance, communication (received or performed) is possible at any time, and logically elimination is also possible at any time. As it is a large activity, resting is possible often also.
To test this method, a problem was encountered because even if the person simulates his life during an entire day, this simulation is performed during only a short period of time and the recorded hours are not coherent with the activity. To test this additional sensor, we generated a perfect sensor for it, and for that we randomly associated for each frame to a possible slot depending on the activity. Then, knowing this perfect sensor, we used the same method than for location. For each frame, considering its slot, we can reduce the number of possibilities by inactivating some of the classifiers and take the decision with majority voting on the remaining SVM.
4.5
Priors based on aggregation of both location and time
The idea of this last part is to use both spatial and time priors at a time. Until now, we consider three different models. The first is generic ones and is related to seven activities, 21 classifiers allow differentiating these activities one compared to another. The second is the one based on the location priors that reduces the number of classifiers using the dominant room in the frame. The last one is based on time priors by aggregating the time of the day information to the first one.
To try to improve more the results, we could consider using both priors. We have for the moment three classifiers and three decisions. One simple scheme is to look at the two decisions based on priors, and if these decisions are coherent we keep this as the final decision. If they are not, we take the decision of the generic model. Using this, we perform a majority voting on the classifiers with a priority to the generic models to resolve ambiguities.
After this presentation of the different methods of classification, with and without priors, we will present the results of these different methods on our dataset.
5 RESULTS
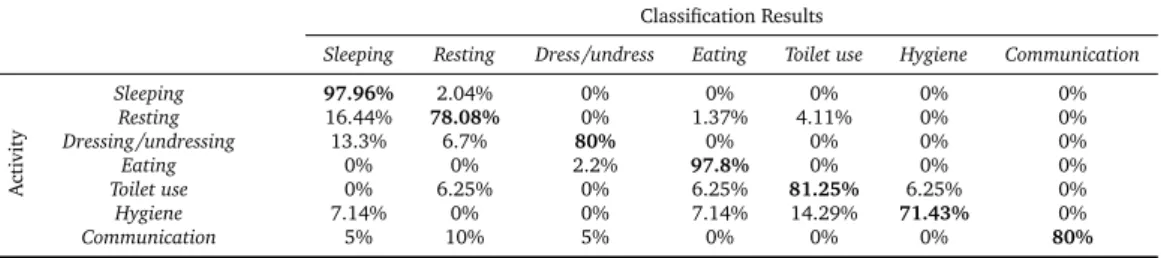
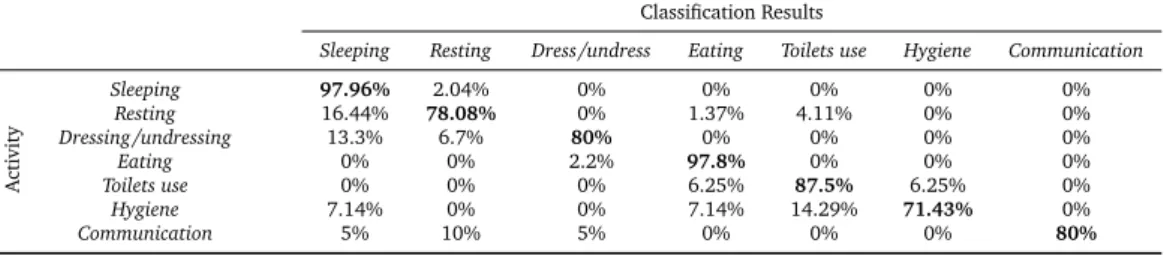
Table 5: CONFUSION MATRIX FOR THE LEAVE-ONE-OUT PROTOCOL USING GENERIC MODELS. GLOBAL
ERRORRATE: 13.79%
Classification Results
Sleeping Resting Dress/undress Eating Toilet use Hygiene Communication
Activity Sleeping 97.96% 2.04% 0% 0% 0% 0% 0% Resting 16.44% 78.08% 0% 1.37% 4.11% 0% 0% Dressing/undressing 13.3% 6.7% 80% 0% 0% 0% 0% Eating 0% 0% 2.2% 97.8% 0% 0% 0% Toilet use 0% 6.25% 0% 6.25% 81.25% 6.25% 0% Hygiene 7.14% 0% 0% 7.14% 14.29% 71.43% 0% Communication 5% 10% 5% 0% 0% 0% 80%
5
Results
5.1
Generic models
The results for the generic models are presented in the Table 5. These results show a global error rate (GER) of 13.79%. The details of all the mistakes are presented in the confusion matrix and these results are more extensively discussed in (Fleury et al., 2010), to which the readers are referred.
5.2
Priors on the location
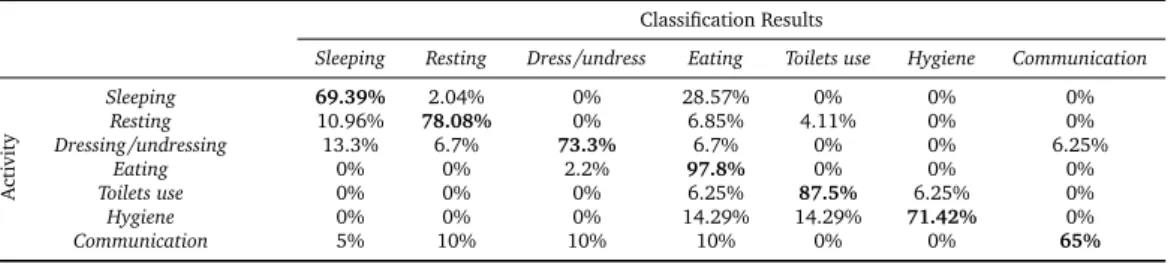
First we can notice that only 8 frames over the 232 are not assigned to a specific room with our pre-process. Only these 8 frames are processed by the generic classifiers presented previously. The results of this second classification are presented by the Table 6. Unexpectedly, the GER is greater than for the generic models and is 21.12%. If we examine it more carefully, it could be explained by one simple fact: the missing detections of the presence infra-red sensors. Indeed, we can for instance focus on the first line of the table, Sleeping activity, and we examine the results. The frames that are classified as Resting are still classified as Resting and correspond to ones that are not assigned to a room. But we can see appearing more than 28% of classification as Eating. If our classifier that distinguishes the possible activities in a room goes wrong, the classification should be Dressing/Undressing. The only possibility to obtain Eating is to be in the Kitchen. That corresponds to non-detections on the presence infrared sensors. We examined for instance this particular case of Sleeping, and we noticed these non-detections. The participant number 12 entered the flat and directly went to the bed to perform the first activity that she chose, Sleeping. She stayed in bed for 25 minutes. If we look at the file that contains the location sensors data, we have a first detection at the entrance and then in the hall. After, when she entered the Living room we have no detection and the same when she entered the Bedroom. The first detection appears at 22 minutes of Sleeping activities. For the 22 first minutes, for the algorithm, as there is no other detection, the person is still in the hall, not moving. As a consequence, all these frames are 100% in the Kitchen/Hall and the decision taken is Eating. We have other non-detection like this that brings a high number of misclassification in the Eating activity for all the classes. This knowledge based on the spatial occupation is interesting and allow disambiguating some
5.3 Priors on the time 5 RESULTS
other situations. As we can notice, the only class for which the classification rate rises with this knowledge is Elimination. With the generic models, Elimination were classified as Resting in 7% of the case, (it can be explained because for this activity, no specific sound is known, the posture is the same, etc.) and now because the location is in the bathroom/toilets, the decision taken is correct. We can imagine that some Resting frames classified as Sleeping could be corrected if there were no problem with the presence sensors.
With a faultless presence sensor, this knowledge allows to obtain a lower computing time and to disambiguate situations (as it considers few classifiers). However, with faulty sensors, some frames for which the incorrect data were compensated by the other sensors are now incorrectly interpreted because the correct class is not even considered as possible and is, as a consequence, not tested.
Table 6: CONFUSION MATRIX FOR THE LEAVE-ONE-OUT PROTOCOL USING MODELS WITH SPATIAL KNOWL -EDGE. GLOBALERRORRATE: 21.12%
Classification Results
Sleeping Resting Dress/undress Eating Toilets use Hygiene Communication
Activity Sleeping 69.39% 2.04% 0% 28.57% 0% 0% 0% Resting 10.96% 78.08% 0% 6.85% 4.11% 0% 0% Dressing/undressing 13.3% 6.7% 73.3% 6.7% 0% 0% 6.25% Eating 0% 0% 2.2% 97.8% 0% 0% 0% Toilets use 0% 0% 0% 6.25% 87.5% 6.25% 0% Hygiene 0% 0% 0% 14.29% 14.29% 71.42% 0% Communication 5% 10% 10% 10% 0% 0% 65%
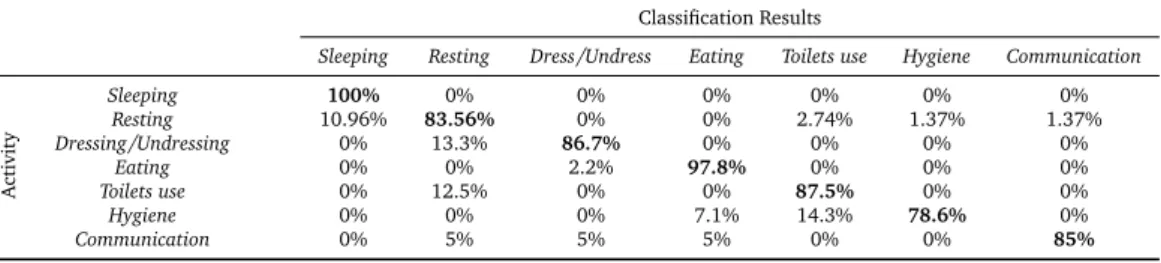
5.3
Priors on the time
The results of this third algorithm are presented in Table 7. As the time parameter is simulated and affected randomly to the different frames, the results could change with these 232 assignations. To avoid side effects, the results given are the mean of five executions of the same algorithm, so five different assignations for the 232 frames. Globally, they are better than the generic ones while the GER is only 9.91%. Indeed, this time the introduction of a prior allows disambiguating between some classes that can be considered as close, for instance Sleeping and Resting and reducing the misclassification rate in both cases. It also show the limits of these priors when classes are close one to another. Indeed, if we analyze the results for the activity dressing, we can see that we reduced the misclassification to Sleeping from 13% to 0%. That is normal because Sleeping and Dressing are orthogonal in that case. But half of the samples that were misclassified are still misclassified with temporal prior but now they are classified as Resting that is the closest class to Sleeping which exist in the same temporal slots as Dressing. We have the same case for Elimination that is now classified as Resting.
These results are easily explainable because here, and contrary to the case of the location in the previous results, we only find a perfect and faultless way to reduce the number of possible classes for each frame. Moreover, as previously, the classification is faster than for the generic models because we reduce the number of estimations and so the computing time. But when the number of classes is reduced, we still rely on the SVM that can differentiate the classes pairwise.
6 DISCUSSION AND CONCLUSION 5.4 Aggregation of priors
As these SVM are not perfect, our classification is not either and we found again the classes that SVM have difficulties to separate.
Table 7: CONFUSION MATRIX FOR THE LEAVE-ONE-OUT PROTOCOL USING MODELS WITH PRIORS ON TIME. GLOBALERRORRATE: 9.91%
Classification Results
Sleeping Resting Dress/Undress Eating Toilets use Hygiene Communication
Activity Sleeping 100% 0% 0% 0% 0% 0% 0% Resting 10.96% 83.56% 0% 0% 2.74% 1.37% 1.37% Dressing/Undressing 0% 13.3% 86.7% 0% 0% 0% 0% Eating 0% 0% 2.2% 97.8% 0% 0% 0% Toilets use 0% 12.5% 0% 0% 87.5% 0% 0% Hygiene 0% 0% 0% 7.1% 14.3% 78.6% 0% Communication 0% 5% 5% 5% 0% 0% 85%
5.4
Aggregation of priors
The results of this last algorithm are presented in the Table 8. The GER is then 13.2%, so almost the same than the generic models. These results are easily explainable. Indeed, aggregation of classifiers should enhance the results. It is for instance the basis of boosting methods. If we eliminate the cases in which the classifier with spatial knowledge is wrong because of faulty measurements, we have the expected behavior. With a bigger training dataset or with more predictable faults in the measurement, we could have trained an artificial neural network with three entries (the three decisions). But here this would not have any sense. Here, the decisions brought by the two other classifiers, which are supposed to correct the errors of the generic one, are not consistent between them. As a consequence, the decision is taken on the most general one. We improved a little (for few frames) the results of the general classifier by adding the two others but as we can see, the problems of the classifier based on the location makes these improvements negligible. The only result that has been taken into account for the final classification is for the Toilets use. The items classified as Sleeping has been corrected and are in the correct class in that case. These frames correspond (see on Table 6) to the ones that have been correctly classified by the algorithm based on spatial priors. On most of the cases, the decision is taken considering the generic classifier (because it is the one that does not bring any prior knowledge and that uses only the models determined from the samples).
6
Discussion and Conclusion
This paper presented a study on the introduction of priors in the automatic classification of seven different activities of daily living in a health smart home. We have first presented the set-up of the flat (with all the sensors) that hosted the experimentations, and then the technique used (based on SVM) and the features proposed to differentiate correctly the seven activities of daily living.
6 DISCUSSION AND CONCLUSION
Table 8: CONFUSION MATRIX FOR THE LEAVE-ONE-OUT PROTOCOL USING MODELS WITH AGGREGATED PRIORS. GLOBALERRORRATE: 13.2%
Classification Results
Sleeping Resting Dress/undress Eating Toilets use Hygiene Communication
Activity Sleeping 97.96% 2.04% 0% 0% 0% 0% 0% Resting 16.44% 78.08% 0% 1.37% 4.11% 0% 0% Dressing/undressing 13.3% 6.7% 80% 0% 0% 0% 0% Eating 0% 0% 2.2% 97.8% 0% 0% 0% Toilets use 0% 0% 0% 6.25% 87.5% 6.25% 0% Hygiene 7.14% 0% 0% 7.14% 14.29% 71.43% 0% Communication 5% 10% 5% 0% 0% 0% 80%
in which 13 young and healthy persons have been asked to perform, without any scenario or orders, the seven activities of daily living that we tried to learn using supervised classification. From this dataset, we first remind the results of the supervised classification of these seven activities by SVM. In these results, we noticed a Global Error Rate of 13.79% and the analysis of the confusion matrix showed that some of the classes are close to each other and as a consequence difficult to differentiate. That is for instance the case for the activities Sleeping and Resting and also for the activities Hygiene and Elimination (the second include the first). These samples of these classes are often differentiated only by the value of one or two of the features and close on all the other dimensions.
Then we tried to improve the results by adding spatial knowledge. This knowledge is that for each activity, one room is dominant (bedroom for Sleeping, etc.). This addition is done by preprocessing the data and inactivating some of the classifiers that are useless. This new classification process degrades the results to 21.2% of GER. Analyzing the data, we noticed that this is due to the numerous errors in the Presence Infra-Red sensors that are supposed to give the location of the person and being essential in this knowledge.
The second addition of knowledge was temporal one. We generated a perfect sensor for this one and tried this classification. This improves the GER to 9.9%. This improvement is due to the diminution of the number of possible classes for each sample and as it is a perfect sensor, we do not have the same effect that for the previous knowledge.
Finally, we aggregated both priors with a priority, in case of non coherence between both priors, on the generic classification. We obtained, at the end of this process, results very close to the first one (with a GER of 13.2%), that are dues, again, to the errors of the temporal knowledge. Indeed, because of this error, both classifiers do not give the same results and so the classification process takes the result of the generic one.
Introduction of knowledge could be more efficient if the location sensors have a better detection rate. Here, only the temporal knowledge improves the results and the aggregation of both do not bring large progression because of the spatial one. Changing these sensors for more precise ones in the future version of the smart home should be a way to improve the results with these priors. This work gave us the opportunity to know the effect of considering priors in a supervised classification process for activities of daily living. Such process can be used for two different applications. The first is for assistance of the person in an Ambient Assisted Living environment.
6 DISCUSSION AND CONCLUSION
Knowing the activity currently performed, we can assist the person in this activity or check some specific states (for example that he turned off the gas in case of cooking) at the end. Moreover, the sound and speech recognition system of the flat could also be used as a way to improve home automation.
The second application is for long-term monitoring of a person at home. During this monitoring process, the important is to know whether the set of vital activities have been done during the day (eating, going to the toilets, taking care of him...) and finding a way to quantify the level of performance on the activity.
If we analyze the results, even with the temporal knowledge, we only improve our results of few percents (4-5%). However, with this improvement, we also lose a large part of the generality of our models. Indeed, in the previous generic models, nothing impose that we have to eat in the kitchen between 12AM and 2PM for instance. With this dataset and such results, we could think that we can lose 4% of correct classification and keep the generality of the models to be adaptable to every situation and house (considering a part for the learning process that should be coherent with this situation).
Moreover, we also have another way to improve the results of the classification, which are post-processing after the classification. Indeed, in this paper, we only consider the frames independently. We do not have a long term follow-up of a person so we took all the frames and try to classify them. This removes one important property of our data: they are continuous. The different frames are more than independent frames; they are also a succession of frames of the same activity and of transition between two activities. To consider this, we can work on these results of classification as on sentences: with grammar. The succession of activities will create the equivalent of “words” and “sentences” that we could interpret to correct the data if this appears to be useful.
In all the case, all this work has to be put in perspective considering the little number of samples that we have and the fact that, even if it has been done with multiple persons, all the experiments have been conducted in the same flat. We are able to discuss of the results of this classification and compare the effect of different introduction of priors, but the generalization of these results have to be proven using a larger database acquired in different smart environments. Such dataset will allow us to test the generic models and confirm the good results that we have on this generic model; and secondly to confirm the results that we have on the prior introduction.
However, acquiring a larger dataset is very time-consuming and a hard task to complete. For this, we cannot imagine using the same technique than here for the indexation. We have to remove the video camera and be based on partial annotation that should be given by the person himself. We can imagine for instance to give, with the system, a PDA that allows to do this annotation. By considering large time of recording, this partial annotation (we can imagine that the person will annotate about 10 or 20% of his life) will give us a large database to work with.
References
Bellego, G., Noury, N., Virone, G., Mousseau, M., and Demongeot, J. (2006). Measurement and model of the activity of a patient in his hospital suite. IEEE Transactions on TITB, 10(1):92–99.
6 DISCUSSION AND CONCLUSION
Berenguer, M., Giordani, M., Giraud-By, F., and Noury, N. (2008). Automatic detection of activities of daily living from detecting and classifying electrical events on the residential power line. In e-health Networking, Applications and Services, 2008. HealthCom 2008. 10th International
Conference on, pages 29–32. IEEE.
Boser, B. E., Guyon, I. M., and Vapnik, V. N. (1992). A training algorithm for optimal margin classifiers. In Proceedings of the fifth annual workshop on Computational learning theory, pages 144–152. ACM.
Bourke, A. and Lyons, G. (2008). A threshold-based fall-detection algorithm using a bi-axial gyroscope sensor. Medical Engineering and Physics, 30(1):84.
Bourke, A., O’brien, J., Lyons, G., et al. (2007). Evaluation of a threshold-based tri-axial accelerometer fall detection algorithm. Gait & posture, 26(2):194–199.
Burges, C. J. (1998). A tutorial on support vector machines for pattern recognition. Data mining
and knowledge discovery, 2(2):121–167.
Campo, E., Bonhomme, S., Chan, M., and Esteve, D. (2010). Remote tracking patients in retirement home using wireless multisensor system. In e-Health Networking Applications and
Services (Healthcom), 2010 12th IEEE International Conference on, pages 226–230. IEEE. Chan, M., Estève, D., Escriba, C., and Campo, E. (2008). A review of smart homes - present state and future challenges. Computer methods and programs in biomedicine, 91(1):55–81. Fleury, A., Noury, N., Vacher, M., et al. (2009). A wavelet-based pattern recognition algorithm to classify postural transitions in humans. In EUSIPCO 2009, 17th European Signal Processing
Conference.
Fleury, A., Vacher, M., and Noury, N. (2010). Svm-based multimodal classification of activities of daily living in health smart homes: sensors, algorithms, and first experimental results.
Information Technology in Biomedicine, IEEE Transactions on, 14(2):274–283.
Guermeur, Y. (2002). Combining discriminant models with new multi-class svms. Pattern
Analysis & Applications, 5(2):168–179.
Hong, X., Nugent, C., Mulvenna, M., McClean, S., Scotney, B., and Devlin, S. (2009). Evidential fusion of sensor data for activity recognition in smart homes. Pervasive and Mobile Computing, 5(3):236–252.
Istrate, D., Castelli, E., Vacher, M., Besacier, L., and Serignat, J.-F. (2006). Information extraction from sound for medical telemonitoring. Information Technology in Biomedicine, IEEE Transactions
on, 10(2):264–274.
Katz, S. and Akpom, C. A. (1976). A measure of primary sociobiological functions. International
Journal of Health Services, 6(3):493–508.
Kim, M., Jang, J., Song, S.-k., Jung, H.-Y., Park, S.-H., and Park, S.-J. (2009). Adl monitoring system using fsr arrays and optional 3-axis accelerometer. Ambient Assistive Health and Wellness
6 DISCUSSION AND CONCLUSION
Knerr, S., Personnaz, L., Dreyfus, G., Fogelman, J., Agresti, A., Ajiz, M., Jennings, A., Alizadeh, F., Alizadeh, F., Haeberly, J., et al. (1990). Single-layer learning revisited: a stepwise procedure for building and training a neural network. Optimization Methods and Software, 1:23–34. Kröse, B., Van Kasteren, T., Gibson, C., and Van Den Dool, T. (2008). Care: Context awareness in residences for elderly.
Libal, V., Ramabhadran, B., Mana, N., Pianesi, F., Chippendale, P., Lanz, O., and Potamianos, G. (2009). Multimodal classification of activities of daily living inside smart homes. Distributed
Computing, Artificial Intelligence, Bioinformatics, Soft Computing, and Ambient Assisted Living, pages 687–694.
Noury, N., Fleury, A., Rumeau, P., Bourke, A., Laighin, G., Rialle, V., and Lundy, J. (2007). Fall detection-principles and methods. In Engineering in Medicine and Biology Society, 2007. EMBS
2007. 29th Annual International Conference of the IEEE, pages 1663–1666. IEEE.
Noury, N., Virone, G., Barralon, P., Ye, J., Rialle, V., and Demongeot, J. (2003). New trends in health smart homes. In Enterprise Networking and Computing in Healthcare Industry, 2003.
Healthcom 2003. Proceedings. 5th International Workshop on, pages 118–127. IEEE.
Noury, T., Villemazet, C., Fleury, A., Barralon, P., Rumeau, P., Vuillerme, N., and Baghai, R. (2006). Ambient multi-perceptive system with electronic mails for a residential health monitoring system. In Engineering in Medicine and Biology Society, 2006. EMBS’06. 28th Annual
International Conference of the IEEE, pages 3612–3615. IEEE.
Nugent, C. D., Hong, X., Hallberg, J., Finlay, D., and Synnes, K. (2008). Assessing the impact of individual sensor reliability within smart living environments. In Automation Science and
Engineering, 2008. CASE 2008. IEEE International Conference on, pages 685–690. IEEE. Philipose, M., Fishkin, K. P., Perkowitz, M., Patterson, D. J., Fox, D., Kautz, H., and Hahnel, D. (2004). Inferring activities from interactions with objects. Pervasive Computing, IEEE, 3(4):50–57.
Tapia, E., Intille, S., and Larson, K. (2004). Activity recognition in the home using simple and ubiquitous sensors. Pervasive Computing, pages 158–175.
Tsukamoto, S., Hoshino, H., and Tamura, T. (2008). Study on indoor activity monitoring by using electric field sensor. Gerontechnology, 7(2):226.
Vacher, M., Fleury, A., Portet, F., Serignat, J.-F., Noury, N., et al. (2010). Complete sound and speech recognition system for health smart homes: application to the recognition of activities of daily living. New Developments in Biomedical Engineering.
Virone, G., Noury, N., and Demongeot, J. (2002). A system for automatic measurement of circadian activity deviations in telemedicine. Biomedical Engineering, IEEE Transactions on, 49(12):1463–1469.
6 DISCUSSION AND CONCLUSION
Anthony Fleury received an Engineer (Computer Science) and a M.Sc. (Signal Processing) degree in 2005 in Grenoble and a PhD degree in Signal Processing from the University Joseph Fourier of Grenoble in 2008 for his work on Health Smart Homes and activity recognition. He joined then the LMAM team at Swiss Federal Institute of Technology and is now, since sept. 2009, Associate Professor at Ecole des Mines de Douai. His research interests include the modeling of human behaviors and activities, machine learning and pattern recognition with applications to biomedical engineering.
Norbert Noury has specialized in the field of "smart sensors" for Ambient Assisted Living environments and for Ubiquitous Health monitoring systems. He received the M.Sc Electronics from Grenoble Polytechnic Institute (1985) and the PhD Applied Physics from Grenoble University (1992). He spent 8 years in various industrial companies (1985-93), and then joined the Grenoble University (1993) where he founded a new research activity on Health Smart Homes (2000). Norbert Noury is now a full Professor at the University of Lyon. He has guided 16 PhD students, authored or co-authored about 150 scientific papers (including 30 journal papers, 80 communications in International Conferences, 8 patents, 14 book chapters) and is a recognized expert at the European Commission.
Michel Vacher received the Ph.D. degree in acoustical science from the INSA of Lyon, in 1982. Since 1986, he has been Research Scientist at the "Centre National de la Recherche Scientifique". He firstly joined the LTPCM laboratory where he worked on high resolution electron microscopy (HREM) image simulation and analysis. He joined the Laboratory of Informatics of Grenoble (ex CLIPS lab) at the end of 2000 to develop new research direction for smart house applications. His research interest includes auditory scene analysis, keyword/speech recognition in Smart Environments and aging voice recognition. He is project coordinator of the ANR Sweet-Home project and published some 37 papers on various aspects of these topics.