HAL Id: hal-00297739
https://hal.archives-ouvertes.fr/hal-00297739
Submitted on 5 Apr 2005HAL is a multi-disciplinary open access
archive for the deposit and dissemination of sci-entific research documents, whether they are pub-lished or not. The documents may come from teaching and research institutions in France or abroad, or from public or private research centers.
L’archive ouverte pluridisciplinaire HAL, est destinée au dépôt et à la diffusion de documents scientifiques de niveau recherche, publiés ou non, émanant des établissements d’enseignement et de recherche français ou étrangers, des laboratoires publics ou privés.
Particle-associated dissolved elemental fluxes: revising
the stochiometry of mixed layer export
A. N. Antia
To cite this version:
A. N. Antia. Particle-associated dissolved elemental fluxes: revising the stochiometry of mixed layer export. Biogeosciences Discussions, European Geosciences Union, 2005, 2 (2), pp.275-302. �hal-00297739�
BGD
2, 275–302, 2005
Revising the stochiometry of mixed layer export
A. N. Antia Title Page Abstract Introduction Conclusions References Tables Figures J I J I Back Close
Full Screen / Esc
Print Version Interactive Discussion EGU Biogeosciences Discussions, 2, 275–302, 2005 www.biogeosciences.net/bgd/2/275/ SRef-ID: 1810-6285/bgd/2005-2-275 European Geosciences Union
Biogeosciences Discussions
Biogeosciences Discussions is the access reviewed discussion forum of Biogeosciences
Particle-associated dissolved elemental
fluxes: revising the stochiometry of
mixed layer export
A. N. Antia
Leibniz-Institut f ¨ur Meereswissenschaften, Research Division Marine Biogeochemistry, D ¨usternbrooker Weg 20, 24105 Kiel, Germany
Received: 28 February 2005 – Accepted: 15 March 2005 – Published: 5 April 2005 Correspondence to: A. N. Antia ([email protected])
BGD
2, 275–302, 2005
Revising the stochiometry of mixed layer export
A. N. Antia Title Page Abstract Introduction Conclusions References Tables Figures J I J I Back Close
Full Screen / Esc
Print Version Interactive Discussion
EGU Abstract
Sinking particles carry substantial loads of dissolved elements in their interstitial spaces that contribute to the vertical transport of elements out of the euphotic zone. Elemen-tal fluxes as traditionally measured by sediment traps underestimate toElemen-tal export when this particle-associated dissolved flux is not considered. The errors introduced are 5
variable and alter both the absolute levels of flux as well as the stochiometry of ex-port. Using samples from sediment traps in the North Atlantic and measuring excess dissolved carbon, nitrogen, phosphorus, silica and calcium in the supernatant of the collection cups, it is possible to quantitatively assess the total flux in the sample. At the base of the winter mixed layer, up to 90±6% of phosphorus fluxes are found as ex-10
cess phosphate whereas for carbon and nitrogen dissolved concentrations account for between 30% and 47% of total fluxes respectively. Particle-associated dissolved silica fluxes are a mean of 61% of total flux. Little (<10%) of calcium fluxes are in dissolved form. The proportion of dissolved to total flux decreases with trap deployment depth. Calculations of the C:N:P ratios for particles only are well above the Redfield Ratio of 15
106:16:1 (Redfield et al., 1964), although the mid-water dissolved N:P and N:Si values as well as the C:N:P ratios of remineralisation along isopycnals conform to the Redfield Ratio at this site. Accounting for dissolved fluxes of all these elements brings the es-timates in agreement with the Redfield Ratio and with other geochemical eses-timates of the stochiometry of winter mixed layer export. A factor of 3 to 4 higher ratios of organic: 20
inorganic carbon export also implies that the net atmospheric CO2sequestration by the biological pump is about 50% higher at this site when the particle-associated dissolved elemental fluxes are considered.
1. Introduction
The biogenic production of particles in the surface ocean leads to incorporation of 25
BGD
2, 275–302, 2005
Revising the stochiometry of mixed layer export
A. N. Antia Title Page Abstract Introduction Conclusions References Tables Figures J I J I Back Close
Full Screen / Esc
Print Version Interactive Discussion
EGU and aggregation sink out of the upper mixed layer and transport these elements to the
deep sea and sea floor. The proportion in which these elements leave the surface mixed layer determines their relative residence times at the surface and their deep-water stochiometry. Since Redfield et al. (1963) pointed out the relative constancy of carbon, nitrogen and phosphorus (C, N and P) in organic matter and inorganic N:P in 5
the deep sea, this concept has been widely used to estimate fluxes of one element based on those of the others (e.g. MacCready and Quay, 2001). Indeed, this ratio is so accepted as being the “norm” that deviations in surface waters are interpreted as “over-production” of carbon, or an elevated efficiency of the biological pump (K¨ortzinger et al., 2001a; Engel et al., 2002). In the mesopelagial, changes in these ratios with depth are 10
taken to reflect the remineralisation time and length scales of different elements (Honjo et al., 1982; Honjo and Manganini, 1993). Among the other bio-active elements, silica (specifically the N:Si ratio in upwelled water) determines the contribution of diatoms to new production, thus influencing species succession in a way that is important for particle export. Additionally, the ratio of inorganic carbon (primarily calcium carbonate) 15
to organic carbon in particles exported from the winter mixed layer determines the ef-ficiency of net atmospheric CO2 sequestration (Antia et al., 2001). Both silicate and carbonate are thought to play a prominent role in ballasting material to accelerate its sinking speed (Armstrong et al., 2002; Klaas and Archer, 2002), so their contribution to sedimenting particles can potentially alter the efficiency of bulk export.
20
Sediment traps, more correctly called particle interceptor traps, have been used for several decades to quantify and characterise the flux of elements from the surface to the deep sea. Despite uncertainties in the efficiency with which traps collect the true settling flux, they are still the sole means by which time-series sampling of sinking par-ticles is done in the mid-ocean. Valuable insights into the close coupling of surface 25
processes with mesopelagic and benthic fluxes as well as novel information on the ver-tical fluxes of major and minor elements has emerged from trap studies, contributing to our understanding of ocean biogeochemical cycles. Almost simultaneous with the en-thusiasm in deploying traps in numerous environments came the sobering realisation
BGD
2, 275–302, 2005
Revising the stochiometry of mixed layer export
A. N. Antia Title Page Abstract Introduction Conclusions References Tables Figures J I J I Back Close
Full Screen / Esc
Print Version Interactive Discussion
EGU that they fell short of collecting the “true” sinking flux (Gardner, 1980; Buesseler, 1991;
Gust et al., 1992, 1996). Of the many issues addressed, hydrodynamic biases appear to be a major problem, causing under- or over-collection of particles and sorting of par-ticles based on size or other properties (Gust et al., 1996). A comprehensive summary of this technology and its caveats is given by Gardner (2000).
5
A further issue that is less often addressed or corrected for when measuring export fluxes using sediment traps is the dissolution of material after particles settle in the trap cups. A number of early studies report dissolution of organic carbon (Gardner et al., 1983; Noji et al., 1999; Honjo et al., 1995), and nitrogen (Hansell and Newton, 1994; K ¨ahler and Bauerfeind, 2001) amino acids (Lee and Cronin, 1982; Lee et al., 1992), 10
fatty acids (K ¨ortzinger et al., 1994), phosphate (Knauer et al., 1984; von Bodungen et al., 1991), dissolved inorganic nitrogen (primarily ammonium, Knauer et al., 1990; von Bodungen et al., 1991), silicate (von Bodungen et al., 1991; Bauerfeind et al., 1997; Antia et al., 1999) and metals (Knauer et al., 1984; Pohl et al., 2004). Despite finding that dissolution can account for a large and variable proportion of the measured 15
particulate flux, to date there has been no systematic analysis of the corrections that may need to be applied to arrive at values of the entire flux in the trap. As important as errors in the absolute levels of flux are changes in the ratios of the elements to each other, as mentioned above.
When compiling existing data from the literature on dissolved compounds in trap 20
supernatant, it became apparent that while some studies had looked at individual com-pounds no comprehensive data existed in which the major elements were measured for a single set of samples. The aim of this study was to estimate the degree of dis-solution of major elements (carbon, nitrogen, phosphorus, silica and calcium) from particles captured by sediment traps at different depths from long-term moorings in the 25
North Atlantic and assess how this process affects the estimation of the stochiometry of export.
BGD
2, 275–302, 2005
Revising the stochiometry of mixed layer export
A. N. Antia Title Page Abstract Introduction Conclusions References Tables Figures J I J I Back Close
Full Screen / Esc
Print Version Interactive Discussion
EGU 2. Materials and Methods
Conical, 0.5 m2 aperture Kiel-type sediment traps were deployed on 3 moorings at the European continental margin at depths between 600 m and 4000 m. Details of mooring deployment and sample processing are given in Antia et al. (1999). Sedi-mentation rates of particulate organic carbon and nitrogen (POC and PON) and par-5
ticulate biogenic silica (PSi) presented here are available from the OMEX database (http://www.bodc.ac.uk/projects/omex.html). Particulate organic phosphorus (POP) was measured after filtration, oxidation and colorimetric determinations after Grasshoff et al. (1999).
Seawater from ca. 1000 m depth at the mooring sites, with 0.14% mercuric chloride 10
added as a poison was used to fill the trap jars prior to deployment. Dissolved carbon, nitrogen, phosphorus and silicate was measured in this water and these values were used as background concentrations. After recovery and transport to the laboratory, samples were placed upright and particles allowed to settle to the bottom of the cups before further analyses. Supernatant water from above the particle pellet was carefully 15
pipetted out, filtered through sterile 0.45 µm polycarbonate filters and stored at 4◦C in the dark. Samples were processed in the order in which they were exposed in the traps so that, including time of deployment and time between recovery and processing, all samples had been in the poisoned jars for atleast 5 months before analysis.
The following was analysed in supernatent: nitrate, nitrite, ammonium, silicate and 20
phosphate, dissolved organic carbon (DOC) and nitrogen (DON) and dissolved cal-cium. NO2, NO3, NH4, PO4, SiO4were analysed using the manual methods described in Grasshoff et al. (1999). Samples were diluted 1:10 before nitrate analyses to keep the level of mercuric chloride below 0.02%, so as not to compromise the efficiency of the cadmium reductor. DOC and DON were analysed using the high temperature cat-25
alytic oxidation (HTCO) method and dissolved calcium using ICP analyses. Dissolved organic phosphorus was measured in 119 samples as the increase in phosphate con-centration after treatment with a strong oxidising agent (Oxisolv, Merck).
BGD
2, 275–302, 2005
Revising the stochiometry of mixed layer export
A. N. Antia Title Page Abstract Introduction Conclusions References Tables Figures J I J I Back Close
Full Screen / Esc
Print Version Interactive Discussion
EGU The excess dissolved concentration of each element in supernatent was calculated
as the difference between the measured value and the background value in water used to fill the sample cups. Total fluxes were calculated from the sum of dissolved and par-ticulate flux of each element. In several cases and in particular for phosphorus, mean fluxes showed large variations due to extreme outliers in the data. These were defined 5
as values lying outside of three standard deviations from the mean and discarded from calculations. Generally 0, 1 or 2 outliers per set of 21–40 values were identified and eliminated.
Adding to the data analysed from the OMEX traps literature values were taken from trap deployments in the North Atlantic and Southern Ocean. Data from the Greenland 10
and Norwegian Seas were provided by the Special Research Project (313) of the Uni-versity of Kiel and are available underhttp://www.ifm.uni-kiel.de/jgofs/dm/. Data from traps in the Southern Ocean are from the SAZ Project of the Antarctic CRC, Australia (Bray et al., 2000). The sources of other data compiled for comparison are given in the legend of Table 1.
15
3. Results
3.1. Excess phosphorus in supernatant
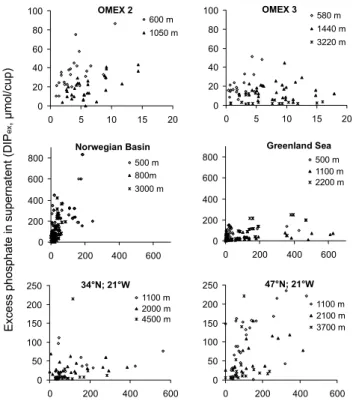
For all elements examined, substantial excess dissolved concentrations in supernatent were found. This was most pronounced for phosphorus, with up to 90 (±6.4)% of the to-tal phosphorus in trap jars found as excess phosphate (DIPex) in supernatent at 600 m 20
at the OMEX 3 site (Fig. 1a, Table 1). Excess dissolved organic phosphorus could not be detected, with with a mean measured concentration of 1.04 (±2.7) µmol dm−3. With increasing trap depth the proportion of DIPex to total phosphorus found in the cups decreased substantially, accounting for 61 (±20.4)%, 34(±23)% and 15 (±3.4)% of total phosphorus at 1440 m, 3220 m and 4000 m respectively. Site-specific di ffer-25
BGD
2, 275–302, 2005
Revising the stochiometry of mixed layer export
A. N. Antia Title Page Abstract Introduction Conclusions References Tables Figures J I J I Back Close
Full Screen / Esc
Print Version Interactive Discussion
EGU small, with a similar proportion of total phosphorus as DIPexat two sites in the
Norwe-gian Sea and East Greenland Sea (ca. 80% at 500 m, decreasing to 68 and 40% at 3000 m and 2200 m respectively, Table 1, see also von Bodungen et al., 1991). Lower dissolved fluxes were found in the temperate North Atlantic at 34◦N and 48◦N (21◦W), decreasing from 30–50% at 1000 m to 17% at 3700 m and 10% at 4500 m. Weak linear 5
correlations between particulate organic phosphorus and DIPexwere found at all sites. Since samples were processed a minimum of 5 months after sample retrieval a time-course of increase in dissolved elemental concentrations in supernatent could not be investigated. After the initial analyses in 1994, splits and supernatent were stored at 4◦C in the dark and reanalysed in 2004 for selected variables. During this long-term 10
storage particulate organic phosphorus showed no decrease, indicating that further degradation or leaching did not occur. For particulate organic phosphorus measured in 1994 (POP1994) and the measurements repeated in 2004 (POP2004) the following relationship was found:
POP1994=0.09(±0.07)+1.03(±0.28) POP2004; n=136, r2= 0.89. 15
3.2. Excess silica in supernatant
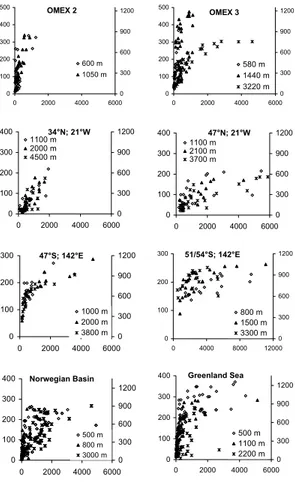
High excess dissolved silica (DSiex) concentrations were found in all traps studied (Fig. 2). Maximum DSiex values in supernatent of ca. 1000–1200 µmol/l (at which concentration silicate saturates in seawater at ca. 2◦C and pH 8, Rickert et al., 2002) were seen, with the initial slope of PSi to DSiexdecreasing with increasing water depth. 20
Maximal losses of DSi to the dissolved phase at the 500 m horizon amounted to be-tween 61 (+7.4)% at the OMEX 3 site and 35 (+21.1)% in the Norwegian Sea. Below 3500 m a relatively constant 6.1–6.7% of the total siliceous flux was found as DSiex (OMEX 4 at 4000 m; 34◦N, 21◦W at 4500 m; 47◦N, 21◦W at 3700 m). Remarkably low dissolution of SiO4into supernatent (<5 to 10%) was seen in traps from the Southern 25
Ocean at 51◦S and 53◦S, up to an order of magnitude lower than the other sites at similar depth.
BGD
2, 275–302, 2005
Revising the stochiometry of mixed layer export
A. N. Antia Title Page Abstract Introduction Conclusions References Tables Figures J I J I Back Close
Full Screen / Esc
Print Version Interactive Discussion
EGU 3.3. Excess nitrogen in supernatant
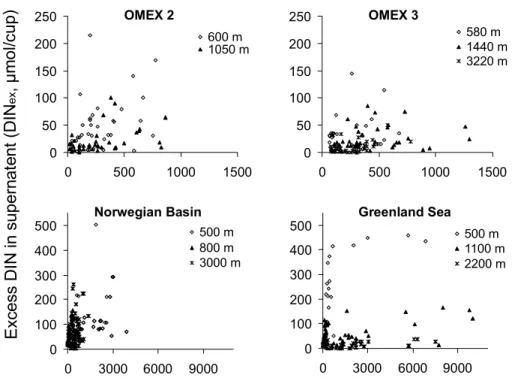
For nitrogen too substantial excess concentrations in supernatent were seen. Excess dissolved inorganic nitrogen (DINex=excess NO3+NH4) was low (ranging from 1.5 to 5.4% total nitrogen, Fig. 3a–d and Table 1) and consisted almost exclusively of ammo-nium. Excess dissolved organic nitrogen (DONex) accounted by far for the larger part 5
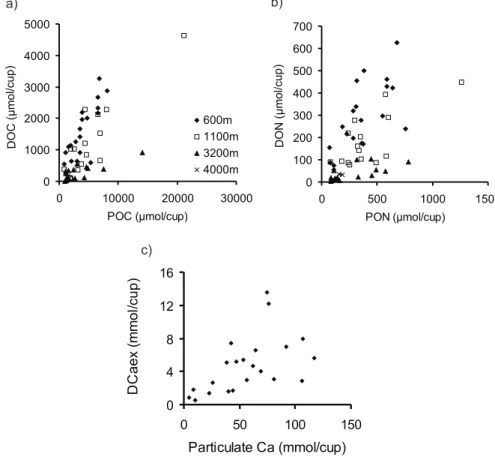
of dissolved nitrogen species and amounted to 45 (+13)% and 16.7 (+2.9)% of total nitrogen fluxes in the traps at 600 m and 4000 m respectively (Fig. 4a). DONex was linearly related to PON fluxes and showed a decreasing trend as proportion of total nitrogen flux with trap depth.
3.4. Excess carbon in supernatant 10
A similar trend was observed for excess dissolved organic carbon (DOCex) in superna-tent, in that it was linearly related to POC flux and decreased with increasing trap depth (Fig. 4b). Altogether, 30 (+6.6)% and 7 (+3.6)% of total carbon was found as DOCexat 600 m and 4000 m respectively. We did not measure dissolved inorganic carbon (DIC) in supernatant, but the sea water was well buffered (pH>7.6) leading us to assume no 15
significant DIC increase. Production of DIC through microbial activity would indicate ineffectiveness of the trap poison, which at the levels used (0.14% HgCl2) stop bacte-rial activity within hours (Lee et al., 1992). We did however, measure excess dissolved Ca (DCaex) to check for inorganic carbon losses; on average there was an increase of 3.9–7.9% above background dissolved Ca levels (9.9% at 1440 m).
20
3.5. Swimmer-related excess dissolved fluxes
For the trap at 600 m, where maximal swimmers were found, there was no correlation between swimmer carbon (a better estimation of swimmer flux than number alone) and DOC or DON values (r2=0.17, n=37). At this depth, swimmer biomass was low compared to total organic carbon and nitrogen fluxes, accounting for a mean of 10.9 25
BGD
2, 275–302, 2005
Revising the stochiometry of mixed layer export
A. N. Antia Title Page Abstract Introduction Conclusions References Tables Figures J I J I Back Close
Full Screen / Esc
Print Version Interactive Discussion
EGU (±7.1)% of total carbon (DOC+POC) in the traps. Even assuming that 20% of the
swimmer biomass leached into the surrounding seawater, this effect would be negligible on DOC increase. I therefore neglect swimmer-derived DOC/N and assume all the excess DOC and DON originated from organic particles.
3.6. Correction of C:N:P, N:Si and POC:PIC ratios 5
Table 2 summarises the molar ratios of C:N:P for the traps analysed in this study as well as other values from the literature. Relying on information from particulate analyses only, the C:P and N:P ratios are highly in excess of the Redfield value of 106:1 and 16:1 respectively, even though the scatter in the data is large. Where corrections for the dissolved fluxes are available for all elements, mean ratios at the base of the mixed 10
layer are well in agreement with the Redfield ratios, increasing with depth to 4000 m. Large shifts in the POC:PIC ratio are seen when accounting for excess dissolved fluxes, increasing fom 2:1 to a mean of 7:1 at 600 m. For nitrogen and silica, similar rates of dissolution result in large corrections of the absolute flux values but the ratio of N:Si remains unchanged (Table 3).
15
4. Discussion
The fact that large sinking aggregates, the main vehicles for vertical elemental fluxes (McCave, 1975; Fowler and Knauer, 1986), carry with them dissolved loads in their interstital spaces has been recognised for some time. Aggregates are greatly enriched in DOM and inorganic products of remineralisation and dissolution such as phosphate 20
and silicate (Shanks and Trent, 1979; Alldredge, 2000; Brzezinski et al., 1997). A sub-stantial amount of the dissolved loads leave the aggregates within the euphotic zone (Kiørboe et al., 2001), since diffusion between the aggregate and seawater are high (Alldredge and Cohen, 1987; Ploug et al., 2002). Fecal pellets, an important aggregate type, also contain large amounts of DOM that rapidly leach out into the surrounding sea 25
BGD
2, 275–302, 2005
Revising the stochiometry of mixed layer export
A. N. Antia Title Page Abstract Introduction Conclusions References Tables Figures J I J I Back Close
Full Screen / Esc
Print Version Interactive Discussion
EGU water (Lampitt et al., 1990; Urban-Rich, 1999). Packed with bacteria and heterotrophic
protozoa (Silver and Alldredge, 1981; Simon et al., 2002), these micro-environments are hotspots of microbial activity in the water column (Grossart and Ploug, 2001) and greatly affect the cycling of elements in the water column. Investigating the time-course microbial degradation of fesh diatom aggregates, Grossart and Ploug (2001) find sig-5
nificant carbon and nitrogen contents and high microbial turnover rates after 8 days of incubation, during which time aggregates in the natural environment would be well below the winter mixed layer.
As Alldredge (2000) points out, the dissolved loads in the interstital spaces of aggre-gated must contribute substantially to vertical flux. However, practically all measure-10
ments of DOM within aggregates have been done within the upper water column; the DOM load in sub-surface and deep aggregates is unknown. The data presented here provide a first, albeit indirect, estimate of dissolved elemental concentrations in large particles in the mid- and lower water column.
Aggregates are thus carriers of significant amounts of dissolved material, here called 15
the “particle-associated dissolved flux”. In sediment traps, these particles settle into trap jars where microbial activity is stopped or greatly reduced depending on the preservative or poison used. At the concentration of mercuric chloride used in this study Lee et al. (1992) report complete and almost immediate cessation of microbial activity. I assume, thus, that the excess dissolved concentrations in supernatent water 20
are not an artefact produced by degradation of material within the cups but result solely from passive leaching of material that arrived in the trap in the interstital spaces of par-ticles. Diffusive fluxes on the order of ca. 16–50 µm/day (Kiørboe et al., 2001; Ploug et al., 2002) would ensure equilibration of interstital concentrations with the superna-tent solution during the long storage times used in this study. Even assuming lower 25
diffusion rates due to the presence of a polysaccharide matrix and the fractal nature of aggregates (Alldredge, 2000), for long-term moorings the diffusion rate will not limit the net leaching of dissolved substances out of the particles. During further processing of the samples (picking of swimmers, splitting and filtering), particles are rinsed with
BGD
2, 275–302, 2005
Revising the stochiometry of mixed layer export
A. N. Antia Title Page Abstract Introduction Conclusions References Tables Figures J I J I Back Close
Full Screen / Esc
Print Version Interactive Discussion
EGU seawater and partially broken, and particularly during filtering the interstital spaces are
bled. However, presuming equilibrium between the particles and surrounding seawa-ter, adding the excess elemental fluxes to the measured particulate flux accounts for this loss. Filtration of particles prior to analysis, whether from water bottles, trap jars or in situ pumps, causes loss of interstitial fluids and underestimation of their elemental 5
loads. This “particle-associated dissolved load” is not measured in either the partic-ulate or dissolved pool using current protocols, and is potentially lost in estimates of elemental standing stocks and vertical flux. This caveat is common to all analyses of particles in the water column and warrants attention in all biogeochemical studies.
The data here show agreement with those of Alldedge (2000) who measured POC 10
and DOC on aggregates from 2–20 m water depth. At these shallow depths DOC was on average 31% of total carbon in the particles whereas in trap material at 600 m depth (this study) DOCex was on average 30% total carbon in the cups, suggesting that a significant proportion of labile organic carbon is still being recycled within aggre-gates reaching the base of the mixed layer, and that losses due to leaching, diffusion 15
and assimilation by organisms on and in the aggregates are lower than the net DOC production rates. Considerably lower DOCex, accounting for <10% total carbon, is ex-ported below 1400 m. The linear relationship between POC flux and DOCex implies no significant seasonality in the contribution of dissolved matter to total fluxes, but rather a constant internal aggregate remineralisation by bacteria and protozoa, in proportion 20
to organic matter availaibility.
For silica and calcium, where dissolution is controlled both by physico-chemical fac-tors as well as biological degradation, dissolution and leaching may continue after mi-crobial activity is stopped. Silica dissolution on organic aggregates is accelerated by destruction of the organic frustule matrix through bacterial protease activity (Bidle and 25
Azam, 2001), and diatomaceous aggregates in the upper water column accumulate silicic acid in their interstital spaces at upto 100-fold higher concentrations than in the surrounding seawter (Brzezinski et al., 1997). Although seawater is greatly undersat-urated with respect to silicic acid, high siliceous fluxes and leaching out of particles
BGD
2, 275–302, 2005
Revising the stochiometry of mixed layer export
A. N. Antia Title Page Abstract Introduction Conclusions References Tables Figures J I J I Back Close
Full Screen / Esc
Print Version Interactive Discussion
EGU cause saturation of silicate in supernatent water (Fig. 2), presumably stopping further
losses due to passive dissolution.
For calcite, losses from the particles are low and relatively constant. Lower disso-lution of this inorganic carbon compared to the high DOCex concentrations alter the Corg:Cinorg ratio (rain ratio) of flux at the base of the winter mixed layer (Table 2), that 5
is responsible for net drawdown of atmospheric CO2 by the biological pump. Net car-bon (sequestration) fluxes at the winter mixed layer at the OMEX site as defined and calculated by Antia et al. (2001) increases by 50% from 1.47 to 2.22 mgC m−2yr−1 in reponse to the increase in the rain ratio from 2 to 8 at 600 m depth when accounting for the paticle-associated dissolved fluxes (Table 2).
10
Factors such as fixative/poison type, brine, buffer, and presence of swimmers are likely to affect leaching of interstitial fluids. Where data are available (Table 1), in traps with similar treatments (mercuric chloride, no brine addition), similar proportions of ex-cess dissolved phosphorus and silicate were found in supernatent at similar depths. For silicate, traps in the southern Ocean showed lower DSiex concentrations; how-15
ever, since both the species composition and biogeochemical regimes as well as trap treatment (addition of brine) differed, it is difficult to separate these effects. For traps at similar sites and depths, (the OMEX traps and data from Honjo and Manganini, 1993) there are factor of 2 differences in the slopes of dissolved to particulate fluxes of phosphorus and silica measured (Figs. 1 and 2), with much higher proportions of 20
dissolved elements in the HgCl2-poisoned OMEX traps. These may be due to dif-ferences in poison/fixative used since formalin is known to stabilize membranes and chitinous structures, possibly making them less permeable for leaching (e.g. Lee et al., 1992). Rather unfortunately, the use of formaldehyde as a fixative, as recom-mended by the JGOFS protocols (http://usjgofs.whoi.edu/protocols rpt 19.html) pre-25
cludes DOC/DON measurements in supernatant, the effect of which can be substantial in the mesopelagic zone.
For silica in particular, the initial slope of DSiexagainst PSi flux varies both with depth and site. At 51◦S in the polar front where the large, heavily silicified Fragillariopsis
BGD
2, 275–302, 2005
Revising the stochiometry of mixed layer export
A. N. Antia Title Page Abstract Introduction Conclusions References Tables Figures J I J I Back Close
Full Screen / Esc
Print Version Interactive Discussion
EGU
kerguelensis dominated diatom export (Bray et al., 2000; T. Trull, pers. comm.) about
half the silica dissolution of that found at other sites at the same depths was seen. Such site-specific differences in dissolution of biogenic silica has been reported by Rickert et al. (2002) who found a factor of 10 lower dissolution of silica in the Southern Ocean compared to the Norwegian Sea, related to differences in the reactivity of diatom 5
shells. Species-specific differences in the dissolution of diatom frustules (Kohly, 1998), and strong differences in reactivity of biogenic silica linked to the structural integrity, organic coating and detrital minerals is manifested in higher silica contents of Southern Ocean sediments compared to similar latitudes in the North (Schl ¨uter et al., 2000).
Although in this study swimmer fluxes were low and negligible compared to the pas-10
sive sinking fluxes, swimmers may strongly falsify results in shallow traps (Steinberg et al., 1998). Addition of brine, that causes zooplankton swimmers to herniate in the traps, (Peterson and Dam, 1990) would magnify the problem. Since swimmers, through her-niation, excretion and leaching will introduce large dissolved concentrations that cannot reliably be separated from the particle-associated dissolved load, swimmer avoidance 15
should be a priority.
For elements other than those presented here, the rate and degree of dissolution would need to be individually determined. Knauer et al. (1984) shows rapid dissolu-tion of up to >80% and >70% of sedimenting Manganese and Cadmium respectively and similarly high dissolution, although proceeding at a slower rate, for Zinc. Pohl et 20
al. (2004) find only half those values in their traps. Particle-reactive elements such as iron and thorium are, predictably, not found in supernatant (Pohl et al., 2004).
Given the differing stochiometry of POM and DOM and the differing time scales of their production and mineralisation (Hopkinson and Vallino, 2005) large aggregates as carriers of both particulate and dissolved material should be treated as a single entity 25
requiring a consolidated analytical approach. This would include collection of interstitial waters during filtration with analyses of excess dissolved elements, as has been done in the upper water column in but relatively few studies.
BGD
2, 275–302, 2005
Revising the stochiometry of mixed layer export
A. N. Antia Title Page Abstract Introduction Conclusions References Tables Figures J I J I Back Close
Full Screen / Esc
Print Version Interactive Discussion
EGU to negligible effects depending on element and trap depth, both in terms of the absolute
values of flux as well as in the stochiometry of settling material (Table 3). Whereas at the base of the winter mixed layer at around 500 m, phosphorus would need to be corrected upwards by a factor of up to 10, carbon and nitrogen flux corrections are between factors of 1.4 to 2. Slightly higher dissolution of silica would make the total 5
silica fluxes higher by a factor of 2 to 2.5. Total calcium fluxes are practically unaffected by dissolution. These estimates are similar to the errors due to hydrodynamic biases of moored traps, estimated by water column radioisotope budgets (Scholten et al., 2001; Yu et al., 2001) below the mixed layer. Both these effects (particle-associated dissolved fluxes and hydrodynamic biases) decrease with increasing water depth and 10
when accounted for, will increase the estimates of mid-water remineralisation rates that have arisen from sediment trap data (e.g. Pace et al., 1987; Martin et al., 1987; Antia et al., 2001). These “corrections” may narrow the gap between measured particle fluxes and those based on subsurface oxygen utilization rates (Jenkins, 1982). They would also substantially decrease the estimated “lateral” or “advective” fluxes that are 15
assumed where an increase in flux with depth is measured. (e.g. Antia et al., 1999; Neuer, 1997) and narrow the observed discrepancy between vertical POC fluxes and sediment community carbon demand (Lampitt et al., 1995; Smith et al., 2001)
The ratio of major elements (organic- and inorganic carbon, nitrogen, phosphorus and silica) leaving the upper mixed layer is crucial in estimating the net sequestra-20
tion potential of the biological pump and the global distribution of deep-water nutrient ratios. Biogeochemical models routinely use nitrate fluxes to estimate carbon export (e.g. MacCready and Quay, 2001) relying on the mean global validity of the Redfield stochiometry of C:N uptake in the formation of primary organic matter. Although there is evidence that, at least seasonally, particle formation with a C:N ratio significantly 25
higher than the Redfield Ratio takes place (K ¨ortzinger et al., 2001; Engel et al., 2004) this analysis indicates that export at the base of the mixed layer does not reflect this in the annual mean, at least in the North Atlantic.
sedi-BGD
2, 275–302, 2005
Revising the stochiometry of mixed layer export
A. N. Antia Title Page Abstract Introduction Conclusions References Tables Figures J I J I Back Close
Full Screen / Esc
Print Version Interactive Discussion
EGU ment traps (summarized in Table 2) and uniformly shows C:N ratios above the Redfield
Ratio at the base of the mixed layer. In a compilation of trap and in situ pump data Schneider et al. (2003) report C:N ratios above 8.5 below 500 m depth, increasing by 0.2 per 1000 m. The OMEX data reported here are in agreement with this trend for the particulate fraction only (Table 1). Correcting for dissolved C, N and P in the traps 5
however gives total elemental ratios of almost exactly 106:16:1. C:N ratios not signifi-cantly different from the Redfield Ratio (6.1±1.2:1) at 600 m depth at this site are also in agreement with those calculated by K ¨ortzinger et al. (2001) along isopycnals at sim-ilar depths in the North Atlantic (6.5±0.2). K ¨ortzinger et al. (2001) in turn revised the previously lower estimate (C:N of 5.1±0.2:1) of Takahashi et al. (1987) by subtracting 10
the contribution of anthropogenic CO2 to total DIC. Total N:P ratios of ca. 16:1 and N:Si ratios of 2.4:1 in sedimenting particles at the base of winter mixed layer agree with long-term means of dissolved nutrients in the mesopelagic zone at this site (data from the Levitus Web sitehttp://ingrid.ldeo.columbia.edu/SOURCES/.LEVITUS/), that provide a constraint to the ratios of export from the upper mixed layer.
15
Phosphorus fluxes are seldom reported in sediment trap studies, and indeed the extremely high C:P and N:P ratios found in the particulate fraction only (Table 1) are difficult to interpret. Even accounting for the more rapid remineralisation and loss of phosphorus from sinking particles compared to carbon and nitrogen, mid-water phos-phate values present a constraint to loss rates that are far below those implied by N:P 20
ratios of over 50:1 at the base of the mixed layer (Table 2). At the OMEX sites, re-vising the elemental export values to account for particle-associated dissolved fluxes brings the values in agreement with mid-water N:P and N:Si ratios of 16:1 and 3:1 re-spectively (calculated from the Levitus data set). The ability to measure the N:P and C:P ratios of export is useful especially in regions where nitrogen is in chronic under-25
supply to the euphotic zone, and in coastal regions where phosphorus can limit growth. The commonly assumed excess carbon over nitrogen and nitrogen over phosphorus in winter mixed layer export reported from sediment traps may largely be an artifact of the measurements though more data are needed to confirm this conclusion from other
BGD
2, 275–302, 2005
Revising the stochiometry of mixed layer export
A. N. Antia Title Page Abstract Introduction Conclusions References Tables Figures J I J I Back Close
Full Screen / Esc
Print Version Interactive Discussion
EGU sites.
Biogeochemical studies investigating the efficiency of the biological pump in atmo-spheric CO2sequestration concentrate on the export of carbon to the limiting nutrient in excess of the Redfieldian value since this would supposedly enhance the oceans’ role in the current climate debate. Should much of the “excess” fixed carbon be labile and 5
respired near the surface, as is thought for the carbon-rich polysaccharide exudates of phytoplankton (Passow, 2002) this will have little effect on net carbon export. Possible sites of over-Redfield carbon export to below the mixed layer are thus most likely in the upwelling and high-productivity regions of the Tropical Ocean, where annual mixing is shallow and highest net sequestration fluxes are found (Antia et al., 2001). If sediment 10
traps can be used to more reliably estimate the stochiometry of export, a range of other analyses in the sedimenting particles they collect could give valuable insight into the biological control of export and regional deviations from the global mean. This warrants attention in further studies.
Acknowledgements. I am grateful to S. Krug and P. Fritsche for help with sample analyses
15
and to K. Nagel and D. Schulz-Bull for DOC/DON analyses. Comments by A. K ¨ortzinger and U. Riebesell improved the manuscript and are gratefully acknowledged. I thank T. Trull and R. Peinert for generously providing trap data in electronic form.
References
Alldredge, A. L.: Interstitial dissolved organic carbon (DOC) concentrations within sinking
ma-20
rine aggregates and their potential contribution to carbon flux, Limnology and Oceanography, 45(6), 1245–1253, 2000.
Alldredge, A. L. and Cohen, Y.: Can microscale chemical patches persist in the sea? Micro-electrode study of marine snow, fecal pellets, Science, 235, 689–691, 1987.
Anderson, L. A. and Sarmiento, J. L.: Redfield Ratios of remineralisation determined by nutrient
25
data analysis, Global Biogeochem. Cycles, 8, 65–80, 1994.
Antia, A. N., von Bodungen, B., and Peinert, R.: Particle flux across the mid-European conti-nental margin, Deep-Sea Res., 46(12), 1999–2024, 1999.
BGD
2, 275–302, 2005
Revising the stochiometry of mixed layer export
A. N. Antia Title Page Abstract Introduction Conclusions References Tables Figures J I J I Back Close
Full Screen / Esc
Print Version Interactive Discussion
EGU Antia, A. N., Koeve, W., Fischer, G., et al.: Basin-wide particulate carbon flux in the Atlantic
Ocean: regional export patterns and potential for atmospheric CO2 sequestration, Global Biogeochem. Cycles, 15, 845–862, 2001.
Armstrong, R. A., Lee, C., Hedges, J. I., Honjo, S., and Wakeham, S. G.: A new, mechanistic model for organic carbon fluxes in the ocean based on the quantitative association of POC
5
with ballast minerals, Deep-Sea Res., 49, 219–236, 2001.
Bauerfeind, E., Garrity, C., Krumbholz, M., Ramseier, R. O., and Voss, M.: Seasonal vari-ability of sediment trap collections in the northeast water polynya, part 2. biochemical and microscopic composition sedimenting matter, J. Mar. Sys., 10(1-4), 371–389, 1997.
Bidle, K. D. and Azam, F.: Bacterial control of silicon regeneration from diatom detritus:
sig-10
nificance of bacterial ectohydrolases and species identitiy, Limnology Oceanography, 46, 1606–1623, 2001.
Bray, S., Trull, T., and Manganini, S.: SAZ project moored sediment traps: results of the 1997– 1998 deployments, Antarctic CRC Research Report No. 15, 2000.
Brzezinski, M. A., Alldredge, A. A., and O’Bryan, L. M.: Silica cycling within marine snow,
15
Limnology Oceanography, 42, 1706–1713, 1997.
Buesseler, K. O.: Do upper-ocean sediment traps provide an accurate record of particle flux?, Nature, 353(6343), 420–423, 1991.
Engel, A., Goldthwait, S., Passow, U., and Alldredge, A.: Temporal decoupling of carbon and nitrogen dynamics in a mesocosm diatom bloom, Limnology and Oceanography, 47(3), 753–
20
761, 2002.
Fowler, S. W. and Knauer, G. A.: Role of large particles in transport of elements and organic compounds through the oceanic water column, Progress in Oceanography, 16, 147–197, 1986.
Gardner, W. D., Hinga, K. R., and Marra, J.: Observations on the degradation of biogenic
25
material in the deep ocean with implications on the accuracy of sediment trap fluxes, J. Mar. Res., 41, 195–214, 1983.
Gardner, W. D.: Sediment trap dynamics and calibration: A laboratory evaluation, J. Mar. Res., 38, 17–39, 1980.
Gardner, W. D.: Sediment trap technology and sampling in the surface waters, in: The changing
30
ocean carbon cycle: midterm synthesis of the Joint Global Ocean Flux Study, edited by: Hanson, R. B., Ducklow, H. W., and Fields, J. G., p. 240–281, Cambridge, 2000.
BGD
2, 275–302, 2005
Revising the stochiometry of mixed layer export
A. N. Antia Title Page Abstract Introduction Conclusions References Tables Figures J I J I Back Close
Full Screen / Esc
Print Version Interactive Discussion
EGU Wiley-VCH, Weinheim, 1999.
Grossart, H. and Ploug, H.: Microbial degradation of organic carbon and nitrogen on diatom aggregates, Limnology and Oceanography, 46, 267–277, 2001
Gust, G., Bowles, W., Giordano, S., and H ¨uttel, M.: Particle accumulation in a cylindrical sedi-ment trap under laminar and turbulent steady flow: An experisedi-mental approach, Aquatic
Sci-5
ences, 58(4), 297–326, 1996.
Gust, G., Byrne, R. H., Bernstein, R. E., Betzer, P. R., and Bowles, W.: Particle fluxes and moving fluids: Experience from synchronous trap collection in the Sargasso sea, Deep-Sea Res., 39(7-8A), 1071–1083, 1992.
Hansell, D. A. and Newton, J. A.: Design and evaluation of a “swimmer”-segregating particle
10
interceptor trap, Limnology and Oceanography, 39(6), 1487–1495, 1994.
Heiskanen, A.-S., Haapala, H., and Gundersen, K.: Sedimentation and pelagic retention of particulate C, N and P in the coastal northern Baltic Sea, Estuarine, Coastal and Shelf Science, 46, 703–712, 1998.
Honjo, S. and Manganini, S.: Annual biogenic particle fluxes to the interior of the north Atlantic
15
ocean; studied at 34◦N 21◦W and 48◦N 21◦W, Deep-Sea Res., 31, 221–243, 1993.
Honjo, S., Dymond, J., Collier, R., and Manganini, S. J.: Export production of particles to the interior of the equatorial pacific ocean during the 1992 EqPac experiment, Deep-Sea Res., 42(2–3), 831–870, 1995.
Honjo, S., Manganini, S. J., and Cole, J. J.: Sedimentation of biogenic mater in the deep ocean,
20
Deep-Sea Res., 29, 609–625, 1982.
Hopkinson, C. S. and Vallino, J. J.: Efficient export of carbon to the deep ocean through dis-solved organic matter, Nature, 433, 142–145, 2005.
Jenkins, W. J.: Oxygen utilization rates in North Atlantic subtropical gyre and primary produc-tion in oligotrophic systems, Nature, 300, 246–248, 1982.
25
K ¨ahler, P. and Bauerfeind, E.: Organic particles in a shallow sediment trap: Substantial loss to the dissolved phase, Limnology and Oceanography, 46(3), 719–723, 2001.
Kioerboe, T., Ploug, H., and Thygesen, U. H.: Fluid motion and solute distribution around sinking aggregates, 1. small-scale fluxes and heterogeneity of nutrients in the pelagic envi-ronment, Marine Ecology Progress Series, 211, 1–13, 2001.
30
Klaas, C. and Archer, D. E.: Association of sinking organic matter with various types of mineral ballast in the deep sea: implications for the rain ratio, Global Biogeochem. Cycles, 116, doi:10.1029/2001GB001765, 2002.
BGD
2, 275–302, 2005
Revising the stochiometry of mixed layer export
A. N. Antia Title Page Abstract Introduction Conclusions References Tables Figures J I J I Back Close
Full Screen / Esc
Print Version Interactive Discussion
EGU Knauer, G. A., Redalje, D. G., Harrison, W. G., and Karl, D. M.: New production at the VERTEX
time-series site, Deep-Sea Res., 37, 1121–1134, 1990.
Knauer, G. A., Karl, D. M., Martin, J. H., and Hunter, C. N.: In situ effects of selected preser-vatives on total carbon, nitrogen and metals collected in sediment traps, J. Mar. Res., 42(2), 445–462, 1984.
5
Kohly, A.: Diatom flux and species composition in the Greenland Sea and the Norwegian Sea in 1991-1992, Mar. Geol., 145(3–4), 293–312, 1998.
K ¨ortzinger, A., Schulz-Bull, D. E., Petrick, G., and Duinker, J. C.: Evidence for dissolution of fatty acids in sediment traps: impact on flux estimates, J. Geophys. Res., 99, 3407–3415, 1994.
10
K ¨ortzinger, A., Hedges, J. I., and Quay, P. D.: Redfield ratios revisited: Removing the biasing effect of anthropogenic CO2, Limnology and Oceanography, 46(4), 964–970, 2001b
K ¨ortzinger, A., Koeve, W., K ¨ahler, P., and Mintrop, L.: C: N ratios in the mixed layer during the productive season in the northeast Atlantic Ocean, Deep-Sea Res., 48(3), 661–688, 2001a. Lampitt, R. S., Noji, T., and Bodungen, B.: What happens to zooplankton faecal pellets?
impli-15
cations for material flux, Mar. Biol., 104(1), 15–23, 1990.
Lampitt, R. S., Raine, R. C. T., Billett, D. S. M., and Rice, A. L.: Material supply to the European continental slope: A budget based on benthic oxygen demand and organic supply, Deep-Sea Res., 42(11–12), 1865–1880, 1995.
Lee, C. and Cronin, C.: Particulate amino acids in the sea: Effects of primary productivity and
20
biological decomposition, J. Mar. Res., 42(4), 1075–1097, 1984.
Lee, C., Hedges, J. I., Wakeham, S. G., and Zhu, N.: Effectiveness of various treatments in retarding microbial activity in sediment trap material and their effects on the collection of swimmers, Limnology and Oceanography, 37(1), 117–130, 1992.
MacCready, P. and Quay, P.: Biological export flux in the southern ocean estimated from a
25
climatological nitrate budget, Deep-Sea Res., 48, 4299–4322, 2001.
Martin, J. H., Knauer, G. A., Karl, D. M., and Broenkow, W. W.: VERTEX: Carbon cycling in the northeast pacific, Deep-Sea Res., 34, 267–285, 1987.
McCave, I. N.: Vertical flux of particles in the ocean, Deep-Sea Res., 22, 491–502, 1975. Neuer, S., Ratmeyer, V., Davenport, R., Fischer, G., and Wefer, G.: Deep water particle flux in
30
the Canary Island region: Seasonal trends in relation to long-term satellite derived pigment data and lateral sources, Deep-Sea Res., 44, 1451–1466, 1997.
BGD
2, 275–302, 2005
Revising the stochiometry of mixed layer export
A. N. Antia Title Page Abstract Introduction Conclusions References Tables Figures J I J I Back Close
Full Screen / Esc
Print Version Interactive Discussion
EGU sinking particles can be crucial for estimates of vertical carbon flux, Sarsia, 84(2), 129–135,
1999.
Pace, M. L., Knauer, G. A., Karl, D. M., and Martin, J. H.: Primary production, new production and vertical flux in the eastern Pacific, Nature, 394, 266–269, 1987.
Passow, U.: Transparent exopolymer particles (TEP) in aquatic environments, Progress in
5
Oceanography, 55(3–4), 287–333, 2002.
Peterson, W. and Dam, H. G.: The influence of copepod “swimmers” on pigment fluxes in brine-filed and seawater-filled sediment traps, Limnology and Oceanography, 35, 448–455, 1990.
Ploug, H., Hietanen, S., and Kuparinen, J.: Diffusion and advection within and around sinking,
10
porous diatom aggregates, Limnology and Oceanography, 47(4), 1129–1136, 2002.
Pohl, C., L ¨offler, A., and Hennings, U.: A sediment trap flux study for trace metals under sea-sonal aspects in the stratified Baltic Sea (Gotland Basin; 57◦19.200N; 20◦03.000E), Mar. Chem., 84, 143–160, 2004.
Redfield, A. C., Ketcham, B. H., and Richards, F. A.: The influence of organisms on the
com-15
position of sea-water, in: The Sea, vol. 2, edited by: Hill, M. N., Interscience, New York, 1963.
Reigstad, M., Heiskanen, A.-S., and Wassmann, P.: Seasonal and spatial variation of sus-pended and sedimented nutrients (C,N,P) in the pelagic system of the Gulf of Riga, J. Mar. Sys., 23, 211–232, 1999.
20
Rickert, D., Schl ¨uter, M., and Wallmann, K.: Dissolution kinetics of biogenic silica from the water column to the sediments, Geochimica et Cosmochimica Acta, 66, 439–455, 2002. Schl ¨uter, M., Sauter, E. J., Schulz-Bull, D., Balzer, W., and Suess, E.: Organic carbon and
biogenic silica cycle of surface sediments: a comparison of northern and southern latitudes of the Atlantic Oceans, in: North Atlantic: A changing environment, edited by: Sch ¨afer, P.,
25
Ritzuau, W., Schl ¨uter, M., and Thiede, J., Springer Heidelberg, 2000.
Schneider, B., Schlitzer, R., Fischer, G., and N ¨otig, E.-M.: Depth-dependent elemental com-positions of particulate organic matter (POM) in the ocean, Global Biogeochem. Cycles, 17, 1032, doi:10.1029/2002GB001871, 2003.
Scholten, J., Fietzke, J., Koeve, K., Van der Loeff, M. R., Mangini, A., Waniek, J., Antia, A. N.,
30
et al.: Trapping efficiencies of deep sediment traps in the eastern north Atlantic and in the Arabian sea: Evidence from radionuclide studies, Deep-Sea Res., 48, 243–268, 2001. Shanks, A. L. and Trent, J. D.: Marine snow: Sinking rates and potential role in vertical flux,
BGD
2, 275–302, 2005
Revising the stochiometry of mixed layer export
A. N. Antia Title Page Abstract Introduction Conclusions References Tables Figures J I J I Back Close
Full Screen / Esc
Print Version Interactive Discussion
EGU Deep-Sea Res., 27, 137–143, 1980.
Silver, M. W. and Alldredge, A. L.: Bathypelagic marine snow: deep-sea algal and detrital community, J. Mar. Res., 39, 501–530, 1981.
Simon, M., Grossart, H., Schweitzer, B., and Ploug, H.: Microbial ecology of organic aggregates in aquatic ecosystems, Aquatic Microbial Ecology, 28(2), 175–11, 2002.
5
Smith, K. L., Kaufmann, R. S., Baldwin, R. J., and Carlucci, A. F.: Pelagic-benthic coupling in the abyssal eastern north pacific: An 8-year time-series study of food supply and demand, Limnology and Oceanography, 46(3), 543–556, 2001.
Steinberg, D. K., Pilskaln, C. H., and Silver, M. W.: Contribution of zooplankton associated with detritus to sediment trap “swimmer” carbon in Monterey Bay, CA, Marine Ecology Progress
10
Series, 164, 157–166, 1998.
Struck, U., Pollehne, F., Bauerfeind, E., and von Bodungen, B.: Sources for nitrogen for the vertical particle flux in the Gotland Sea (Baltic Proper)-results from sediment trap studies, J. Mar. Sys., 45, 91–101, 2004.
Takahashi, T., Broecker, W. S., and Langer, S.: Redfield ratio based on chemical data from
15
isopycnal surfaces, J. Geophys. Res., 90(C4), 6907–6924, 1985.
Urban-Rich, J.: Release of dissolved organic carbon from copepod fecal pellets in the Green-land Sea, Journal of Experimental Marine Biology and Ecology, 232(1), 107-124, 1999 von Bodungen, B., Wunsch, M., and F ¨urderer, H.: Sampling and analysis of suspended
par-ticles in the North Atlantic, in: Marine Parpar-ticles: Analysis and Characterisation, edited by:
20
Hurt, D. W. and Spencer, D. W., Geophysical Monograph Series, American Geophysical Union, Washington, D.C., 1991.
Yu, E., Francois, R., Bacon, M. P., and Fleer, A. P.: Fluxes of230th and231pa to the deep sea: Implications for the interpretation of excess230th and231pa/230th profiles in sediments, Earth and Planetary Science Letters, 191(3–4), 219–230, 2001.
BGD
2, 275–302, 2005
Revising the stochiometry of mixed layer export
A. N. Antia Title Page Abstract Introduction Conclusions References Tables Figures J I J I Back Close
Full Screen / Esc
Print Version Interactive Discussion
EGU
Table 1. The contribution of dissolved carbon, nitrogen, phosphorus, calcium and silica to total
(particulate+ excess dissolved) fluxes in sediment traps below the winter mixed layer.
Site Depth DOC (%TC) DON(%TN) DIN (%TN) DIP(%TP) dCa(%totCa) dSi (%total Si) Brine Poison (m) Mean±SD Mean±SD Mean±SD Mean±SD Mean±SD Mean±SD
European Continental Margin1 600 29.9±6.6 44.5±10.5 2.8±2.5 85.8±18.6 7.7±4.9 42.9±20.0 no HgCl 2 “ 1100 28.3±9.0 44.4±10.8 3.9±1.1 70.6±18.3 7.5±5.3 33.2±11.6 no HgCl2 “ 600 28.2±8.2 45.4±45.4 1.7±1.0 90.4±6.4 7.5±5.0 60.9±7.4 no HgCl2 “ 1440 17.2±9.2 29.4±9.8 5.4±1.6 61.6±20.4 9.9±3.4 35.9±16.5 no HgCl2 “ 3200 9.3±6.8 12.0±7.3 4.5±2.6 34.4±22.7 8.0±5.4 21.9±10.4 no HgCl2 “ 4000 7.1±3.6 16.7±2.9 1.5±0.4 15.5±3.4 3.9±2.1 6.7±2.4 no HgCl2 46.45◦S; 142.4ci rc E2 1000 24.5±10.1 yes HgCl 2 “ 2000 18.6±7.6 yes HgCl2 “ 3800 23.8±9.4 yes HgCl2 51.0◦S; 141.44◦E2 3300 9.9±5.5 yes HgCl2 53.44◦S; 141.45◦E2 800 4.9±2.3 yes HgCl2 “ 1500 8.3±3.7 yes HgCl2 34◦N; 21◦W3 1071/1248 33.2±21.5 19.8±13.5 no Formalin “ 2067/1894 26.1±18.9 9.8±5.4 no Formalin “ 4564/4391 10.1±6.1 6.7±3.0 no Formalin 48◦N; 21◦W3 1081/1202 51.1±15.1 10.2±4.4 no Formalin “ 2018/2200 31.8±12.5 7.7±4.9 no Formalin “ 3718/3749 17.3±10.8 6.1±2.9 no Formalin Norwegian Basin4 500 79.6±13.6 34.9±21.1 no HgCl 2 “ 800 72.5±19.7 37.9±21.6 no HgCl2 “ 3000 68.6±18.4 12.3±6.3 no HgCl2
East Greenland Sea4 500 78.4±16.5 35.0±17.7 no HgCl2
“ 1000 64.7±36.1 35.7±18.7 no HgCl2
“ 2200 39.7±23.0 22.9±15.0 no HgCl2
“ 500 no HgCl2
“ 1000 no HgCl2
“ 2200 no HgCl2
Equatorial Pacific5 700 56.0 yes NaN3
“ 800 18.7 yes NaN3 “ 800 21.7 yes NaN3 “ 800 21.4 yes NaN3 Equatorial Pacific6 1095 74±3 “ 1895 70±3 “ 3495 50±13 “ 700 70±8 “ 1600 49±16 “ 3000 26±10 Greenland Basin7 180/275 33 no HgCl2 “ 775/900 50 no HgCl2 “ 1735/2100 63 no HgCl2 Greenland Sea8 500 7.8–38 94–98 45–55 no HgCl 2 1
This study and Antia et al. (1999);2Bray et al. (2000);3Honjo and Mangannini (1993);4Special Research Project (SFB313), Universtiy of Kiel, available athttp://www.ifm.uni-kiel.de/jgofs/dm/.5Dymond and Collier (1989);6Dymond and Collier (1989);7Noji et al. (1999);8von Bodungen et al. (1991)
BGD
2, 275–302, 2005
Revising the stochiometry of mixed layer export
A. N. Antia Title Page Abstract Introduction Conclusions References Tables Figures J I J I Back Close
Full Screen / Esc
Print Version Interactive Discussion
EGU
Table 2. POC:PIC and atomic N:Si ratios from the particulate fraction only and total (particulate
+ particle-associated dissolved) material in sediment traps.
Site Depth (m) Ratio in partiCles only Ratio in total material
POC:PIC N:Si Corg:Cinorg N:Si
European Continental Margin 600 2,0±1,2 2,2±1,1 6,1±3,3 2,4±1,3
” 1100 2,1±1,9 1,3±0,9 6,4±3,5 1,3±0,8
” 580 2,1±0,6 3,4±1,9 8,0±1,7 2,5±1,3
” 1440 2,8±2,5 0,9±0,6 4,3±1,7 1,0±0,5
” 3220 1,3±0,8 0,4±0,2 2,6±1,1 0,4±0,2
BGD
2, 275–302, 2005
Revising the stochiometry of mixed layer export
A. N. Antia Title Page Abstract Introduction Conclusions References Tables Figures J I J I Back Close
Full Screen / Esc
Print Version Interactive Discussion
EGU
Table 3. Atomic C:N:P ratios from the particulate fraction only and total (particulate+
particle-associated dissolved) material in sediment traps and from chemical analyses along isopycnals.
Site Depth (m) Ratio in Particles Only Ratio of Total Flux
C: N: P C:N C: N: P C:N
European Continental Margin1 600 724±353 85±30 1 8.3±2.0 104±70 17±7,9 1 5,6±1,6
” 1100 464±291 56±33 1 9.1±2.0 187±110 25±8,4 1 6,5±1,6 ” 580 915±426 94±44 1 9.2±2.1 107±69 15±8,0 1 6,1±1,2 ” 1440 524±338 52±32 1 9.6±2.9 206±130 30±17,6 1 6,9±1,9 ” 3220 317±181 33±16 1 9.7±2.4 236±112 29±12,5 1 7,8±2,1 ” 4000 282 26 1 11.3 196 28 1 8,1 Norwegian Basin2 400 730 49 1 16.3 ” 800 321 25 1 13.1 ” 2950 345 17 1 22.6 East Greenland Current3 500 647 59 1 9.6
” 500 1053 84 1 9.4 ” 500 622 71 1 8.2 ” 1000 331 33 1 8.5 ” 2200 226 30 1 8.9 ” 2310 171 19 1 10.3 Gulf of Riga4 30 426 49 1 9.3 Gotland Sea5 140 82 9 1 9.3 N. Baltic Sea6 40 9 to 13 5 to 22 1 SargassoSea7 150 457 46 1 8.6 ” 150 340 42 1 8.3 ” 300 429 58 1 7.4 ” 300 382 62 1 14.0 Tasmanian Sea8 300 159 15 1 10.8 ” 1000 129 13 1 9.7 ” 300 193 22 1 8.8 ” 1000 232 22 1 10.5 48◦N9 1000 968 110 1 8.8 34◦N9 1000 430 74 1 5.8 Sargasso Sea10 3694 104 10 1 10.4 tropical Atlantic10 389 182 21 1 8.8 ” 976 274 31 1 8.9 ” 3755 180 18 1 10.3 ” 5068 202 20 1 10.3 East Hawaii10 378 1 9.0 ” 978 1 9.2 ” 2778 303 30 1 10.1 ” 4280 243 10 1 10.4 ” 5582 1 9.2 Panama Basin10 667 318 33 1 9.6 ” 1268 226 26 1 8.8 ” 2700 210 25 1 9.2 ” 3700 243 23 1 10.2 Estimates from chemical data along isopycnals:
N. Atlantic11 200–500 97±9 17.6±0.6 1 5,5
” 500–680 88±6 16.8± 0.5 1 5,2 Atlantic, Indian, Pacific Ocean12 500–1000 117±14 16±1 1
N. Atlantic13 200–500 101±12 14.4± 0.7 1 7.2±0.4
” 500–680 131±18 16.8±1.3 1 7.8±0.5
1This study,2,3Special Research Project (SFB313), Universtiy of Kiel, available athttp://www.ifm.uni-kiel.de/jgofs/dm/.4Reigstad et al. (1999)5Struck et
al. (2004).6Heiskanen et al. (1998)7Oceanic Flux Program of WHOI, (urlstylesamehttp://www.whoi.edu/science/MCG/ofp/)8Bray et al. (2000)9Honjo and Mangannini (1993)10Honjo et al. (1982)11Takahashi et al. (1985)12Anderson and Sarmiento (1984)13K ¨ortzinger et al. (2001)
BGD
2, 275–302, 2005
Revising the stochiometry of mixed layer export
A. N. Antia Title Page Abstract Introduction Conclusions References Tables Figures J I J I Back Close
Full Screen / Esc
Print Version Interactive Discussion
EGU Figure 1: Relationship between particulate organic phosphorus (POP) and excess dissolved
phosphate (DIPex) in sediment trap samples at different sites and depths as listed in Table 1.
Particulate organic phosphorus Flux (POP, µmol/cup)
E xc es s ph os ph at e in s up er na te nt ( D IP , µ m ol /c up ) ex 0 20 40 60 80 100 0 5 10 15 20 600 m 1050 m OMEX 2 0 20 40 60 80 100 0 5 10 15 20 580 m 1440 m 3220 m OMEX 3 0 200 400 600 800 0 200 400 600 500 m 800m 3000 m Norwegian Basin 0 200 400 600 800 0 200 400 600 500 m 1100 m 2200 m Greenland Sea 0 50 100 150 200 250 0 200 400 600 1100 m 2000 m 4500 m 34°N; 21°W 0 50 100 150 200 250 0 200 400 600 1100 m 2100 m 3700 m 47°N; 21°W
Fig. 1. Relationship between particulate organic phosphorus (POP) and excess dissolved
BGD
2, 275–302, 2005
Revising the stochiometry of mixed layer export
A. N. Antia Title Page Abstract Introduction Conclusions References Tables Figures J I J I Back Close
Full Screen / Esc
Print Version Interactive Discussion
EGU Figure 2: Relationship between particulate biogenic silica (PSi) and excess dissolved silicic
acid (DSiex, left axes) in sediment trap samples at different sites and depths as listed in table 1.
The absolute concentration of silicate in supernatant water is given on the right axes.
0 100 200 300 400 500 0 2000 4000 6000 0 300 600 900 1200 580 m 1440 m 3220 m OMEX 3 0 100 200 300 400 500 0 2000 4000 6000 0 300 600 900 1200 600 m 1050 m OMEX 2 0 100 200 300 400 0 2000 4000 6000 0 300 600 900 1200 1100 m 2000 m 4500 m 34°N; 21°W 0 100 200 300 400 0 2000 4000 6000 0 300 600 900 1200 1100 m 2100 m 3700 m 47°N; 21°W 0 100 200 300 0 4000 8000 12000 0 300 600 900 1200 800 m 1500 m 3300 m 51/54°S; 142°E 0 100 200 300 0 2000 4000 6000 0 300 600 900 1200 1000 m 2000 m 3800 m 47°S; 142°E 0 100 200 300 400 0 2000 4000 6000 0 300 600 900 1200 500 m 1100 m 2200 m Greenland Sea 0 100 200 300 400 0 2000 4000 6000 0 300 600 900 1200 500 m 800 m 3000 m Norwegian Basin
Particulate Silica Flux (PSi, µmol/cup)
23
Fig. 2. Relationship between particulate biogenic silica (PSi) and excess dissolved silicic acid
(DSiex, left axes) in sediment trap samples at different sites and depths as listed in Table 1. The absolute concentration of silicate in supernatent water is given on the right axes.
BGD
2, 275–302, 2005
Revising the stochiometry of mixed layer export
A. N. Antia Title Page Abstract Introduction Conclusions References Tables Figures J I J I Back Close
Full Screen / Esc
Print Version Interactive Discussion
EGU
Figure 3: Relationship between particulate organic nitrogen (PON) and excess dissolved inorganic nitrogen (ammonium and nitrate) (DINex) in sediment trap sampls at different sites
and depths as listed in table 1.
Particulate Organic Nitrogen (PON, µmol/cup)
E xc es s D IN in s up er na te nt ( D IN , µ m o l/c up ) e x 0 50 100 150 200 250 0 500 1000 1500 600 m 1050 m OMEX 2 0 50 100 150 200 250 0 500 1000 1500 580 m 1440 m 3220 m OMEX 3 0 100 200 300 400 500 0 3000 6000 9000 500 m 800 m 3000 m Norwegian Basin 0 100 200 300 400 500 0 3000 6000 9000 500 m 1100 m 2200 m Greenland Sea
Fig. 3. Relationship between particulate organic nitrogen (PON) and excess dissolved
inor-ganic nitrogen (ammonium and nitrate) (DINex) in sediment trap sampls at different sites and depths as listed in Table 1.
BGD
2, 275–302, 2005
Revising the stochiometry of mixed layer export
A. N. Antia Title Page Abstract Introduction Conclusions References Tables Figures J I J I Back Close
Full Screen / Esc
Print Version Interactive Discussion EGU DOC (µmol/cup) DON (µmol/cup) a) b) c) 0 4 8 12 16 0 50 100 150 Particulate Ca (mmol/cup) D C ae x (mmo l/c up ) 0 100 200 300 400 500 600 700 0 500 1000 1500 PON (µmol/cup) 0 1000 2000 3000 4000 5000 0 10000 20000 30000 POC (µmol/cup) 600m 1100m 3200m 4000m
Fig. 4. Relationship between particulate organic carbon (a) and nitrogen (b) to the excess
dissolved concentrations of organic carbon and nitrogen respectively. Relationship between particulate calcium and excess dissolved calcium in trap samples(c). All data are from the