O
pen
A
rchive
T
OULOUSE
A
rchive
O
uverte (
OATAO
)
OATAO is an open access repository that collects the work of Toulouse researchers and makes it freely available over the web where possible.This is an author-deposited version published in :
http://oatao.univ-toulouse.fr/
Eprints ID : 16404
To cite this version : Targetti, Stefano and Viaggi, Davide and Cuming, David and Sarthou, Pierre and Choisis, Jean-Philippe Towards a cost-effectiveness analysis of the measurement
of biodiversity indicators. (2011) In: 122nd EAAE Seminar
"Evidence-based agricultural and rural policy making:
methodological and empirical challenges of policy evaluation", 17 February 2011 - 18 February 2011 (Ancona, Italy). (Unpublished)
Any correspondence concerning this service should be sent to the repository administrator:
[email protected]
Copyright 2011 by Stefano Targetti, Davide Viaggi, David Cuming, Pierre Sarthou,
Jean-Ancona, February 17-18, 2011
Towards a cost-effectiveness analysis of the measurement of
biodiversity indicators
Targetti S.1, Viaggi D.1, Cuming D.1, Sarthou J.P.2 and Choisis J.P.2
1 DEIAgra, University of Bologna, Bologna, Italy 2 UMR Dynafor, INRA-INP/ENSAT, France
Towards a cost-effectiveness analysis of the measurement of
biodiversity indicators
Targetti S., Viaggi D., Cuming D., Sarthou J.P., Choisis J.P. Abstract
A comprehensive quantification of biodiversity in farming systems would require a very significant amount of work (and funds) even for a small area. Therefore, biodiversity indicators are needed to solve the problem of the measurement feasibility. Even though the issue of cost and effectiveness is central for the evaluation of the indicators, only the latter is discussed in detail in the scientific literature.
This work presents a cost analysis based on the direct gathering of records from a farm-scale biodiversity survey (EU-FP7, BioBio - “Indicators for biodiversity in organic and low-input farming systems”) where the analysis of costs is part of the project. It is a simple method for comparing different indicators by their ratio of cost/effectiveness. Here we present the results from the French case study (Gascony Hills, Midi-Pyrenees Region).
Keywords: biodiversity, cost-effectiveness, indicator costs JEL classification: Q2
1. INTRODUCTION
Biodiversity loss is defined as the quantitative or qualitative reduction in components of the biological diversity and their potential to provide goods and services (Convention on Biological Diversity, adopted 1992). Agriculture is acknowledged as being among the main human activities responsible for the rapid acceleration of species extinction over the past 50 years (Polasky, et al., 2005). Agro-environmental policies seek to balance agriculture production and ecosystem services such as biodiversity conservation or pollination, but the difficulties in assessing the benefits stemming from various agriculture practices constitute a significant limitation to the adoption and ex-post evaluation of agro-environmental schemes. The evaluation of the effects of farming activities on biodiversity is limited mainly by the difficulty in proposing efficient and widely-applicable indicators of biodiversity at farm-scale. Although the identification of the most efficient indicators of biodiversity should be based on a cost-effectiveness analysis, literature and data on the cost analysis of the measurement of biodiversity are currently lacking (Juutinen and Mönkkönen, 2004). Thus, cost-effectiveness analysis could be one of the main tools able to improve environmental policies and optimise the limited budgets available for biodiversity measurement and conservation.
This study is based on the cost analysis results from the measurement of a set of biodiversity indicators at farm-scale. Cost data relates to the fieldwork activities of the French research unit involved in the BioBio research project (EU-FP7, BioBio - “Indicators for biodiversity in organic and low-input farming systems”) which is endeavouring to develop sound and useful biodiversity indicators for organic and low-input farming in and out of Europe.
Ancona - 122nd EAAE Seminar
"Evidence-Based Agricultural and Rural Policy Making”
Page 2 of 12
The case study is located in the Gascony Hills and Valleys and straddles the Gers and Haute-Garonne Departments, in a sub-Mediterranean climate.
Our objective is to propose a methodology for a cost-effectiveness analysis of the indicator measurement that allows for the comparison of different indicators and their protocol of sampling and to identify the most efficient methods of biodiversity measurement. Our results highlight significant differences between fieldwork effort, cost per sample and cost per farm for the indicators studied. These differences are employed further to discuss the effectiveness of measurement.
This work begins with a general description of the problems inherent in the cost analysis of biodiversity indicators and a brief review of the literature on cost-effectiveness analysis of biodiversity measurement. Section 3 focuses on our approach for the assessment of the costs of the indicator measurement. In this section we propose a simple method for the estimation of the cost-effectiveness of the measurement. Section 4 addresses the cost assessment results and evaluates how the different costs influence the effectiveness of the indicators. Section 5 provides a discussion of the results and conclusions.
2. BACKGROUND
Indicators of biodiversity translate an economic input (cost of the measurement) into an ecological output (value of the information on biodiversity). The cost of the measurement of the indicators can be estimated through the assessment of the monetary costs of efforts and resources spent in the gathering and processing of information (Chambers, 1988). The goal of this analysis is the optimisation of resources employed in the measurement and the assessment of the cost of the information, both are necessary e.g. for monitoring activities linked to environmental policies or for the assessment of the effectiveness of a given conservation programme.
A significant amount of literature is available on biodiversity indicators and their ecological performance. Despite the fact that the feasibility and cost-effectiveness of sampling methods are among the key attributes acknowledged to choose good indicators of biodiversity (OECD, 2001; Millennium Ecosystem Assessment, 2005; Mace and Baillie, 2007), the amount of works focusing on the costs and effectiveness of indicator measurement is particularly limited. This field of research is generally dominated by naturalists and biologists who tend to focus more on the ecological issues related to indicators than on economic aspects. The lack of interdisciplinary studies in this area has lead to a penury of data, methodologies and papers integrating ecological and economic approaches aimed at the assessment of biodiversity indicators and the improvement of environmental policies (Münier et al., 2004; Wätzold and Schwerdtner, 2005).
Few examples exist in the literature directly concerning the cost-assessment of biodiversity measurement and, to our knowledge, no cost data based on direct recording are available for studies covering large areas.
Carlson and Schmiegelow (2002) proposed a cost-effectiveness analysis design for the large-scale monitoring of birds in the province of Alberta (Canada). The effectiveness of sampling was assessed through a power analysis applied to a simulated sampling design, and costs were estimated through a simplified model accounting for transport, labour and equipment costs. The work aimed at designing low cost and high informative monitoring programs. The authors highlighted how the power of detection and the costs of the surveys were not linearly related and that great differences of cost-effectiveness existed depending on the bird species targeted.
Bisevac and Majer (2002) measured the costs and effectiveness of different indicators of biodiversity. Costs were expressed as time required to perform the phases of the measurement per plot. The effectiveness was assessed through a multivariate analysis of the different indicators and their capacity to reflect indicator variability. The authors demonstrated how invertebrate data could be cost-effective compared, for example, to vegetation data thanks to their high information content.
Franco et al. (2007) proposed a sub-sampling method able to compare the effort-effectiveness of two different techniques for the assessment of a bird species population. The authors proposed a reliable method for comparing the effort involved in sampling (cost) and the ecological effectiveness of indicators.
Qi et al. (2008) undertook a study of cost-efficacy in measuring farmland diversity based on operational data from a vast scale study concerning genetically modified crops in the United Kingdom. The authors analysed operational data to determine the financial and time related costs of the study’s protocols for 113 experimental sites. In their cost analysis, the authors focused on the direct costs of the ecological measurement protocols used in the research excluding the government and industry costs involved in establishing the project. The costs assessed were between £217 and £4548 per site depending on the protocol adopted. The paper concluded with a hypothesis concerning the possibility of optimising the measurement protocols with the aim to enhancing the efficiency of the indicators.
Gardner et al. (2008) compared the costs and benefits of different indicators of biodiversity in the Amazonian Forest with the aim of identifying “high performance indicators”. These were meant to be species or groups of species that combined feasibility (in terms of survey efforts) and ecological value or, in other words, that maximised “the amount of information returned for any given investment”. The authors considered standardised costs and split the analysis between field and laboratory work. Surprisingly, the results indicated that, from an ecological point of view, the inexpensive indicators were often the most effective. The authors concluded that biodiversity conservation and decision-making could gain significant benefits from a locally-designed cost-effectiveness analysis of measurement protocols.
Cantarello and Newton (2008) sought to identify cost-effective indicators and evaluate their suitability for evaluating the conservation status of forested habitats that are part of the Natura 2000 framework. The authors concluded that the indicators should be adapted to the different characteristics of individual sites.
Ancona - 122nd EAAE Seminar
"Evidence-Based Agricultural and Rural Policy Making”
Page 4 of 12
3. METHODOLOGY
The cost assessment was applied to the field measurement of four different indicators of biodiversity: wild, domestic and bumble bees, hereinafter called bees (B), earthworms (EW), spiders (S) and vegetation (V).
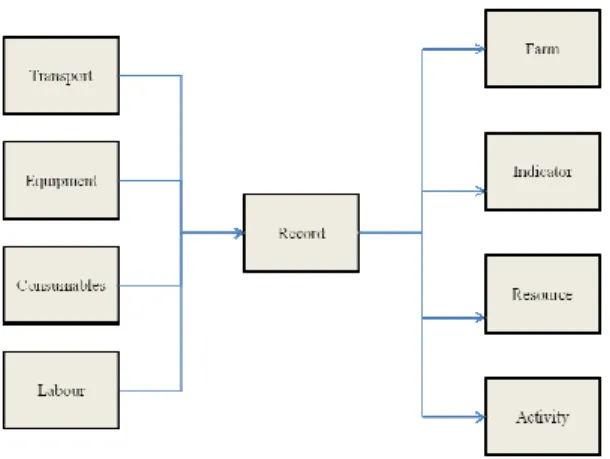
Cost data collection was performed from March to December 2010 through the gathering of records related to staff time, distance and duration of travel, consumables and equipment. Cost data for the measurement efforts were gathered on a weekly basis by the research field unit and stored in a relational data-base which was organised in order to trace the effort costs per indicator, farm, activity and type of resource. Each record contained the following information: date, identification of farm site, staff qualification level, time spent per field worker and was linked to different tables indicating the salary band of staff, the distance of the farm site from the research centre, transport time, equipment and consumable costs, and the type of work (fieldwork, deskwork, laboratory, taxonomy - Figure 1).
Figure 1: Structure of the database for the assessment of costs of biodiversity measurement.
Fieldwork included the cost of field sampling activities and the cost of transportation to and from the sampling plots (vehicle + labour time spent in travel). Taxonomy included the cost of identifying the invertebrate species (bees, earthworms and spiders); the identification of vegetation species was accounted for in the labour costs. The equipment and consumables included all of the materials used during the fieldwork as well as the field lunches for staff. The cost of equipment was assessed as the cost per use = cost new of the equipment / lifetime expressed in the same unit of use. Labour included the cost of taxonomy identification of invertebrate species (bees and bumblebees, earthworms and spiders) performed by specialists, the labour time devoted to measurement activities and the transportation of the field team to and from the plots. Transport included only vehicle costs (fuel + car insurance and maintenance per km). Costs related to general organisation, selection of sampling plots (stratification), and reporting are not included in the present analysis. All costs are related to 2010.
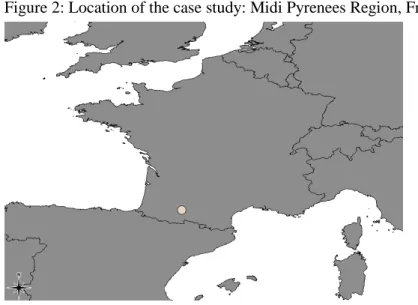
The survey concerns the measurement of biodiversity on 16 arable farms in the Midi-Pyrénées Region of France (Figure 2) where wheat and sunflower were the main crops. A biodiversity assessment was performed through a selected set of indicators following the defined protocol of the BioBio project.
Figure 2: Location of the case study: Midi Pyrenees Region, France.
Bees sampling was carried out during 15 minutes along a journey covering the main attractive points of a habitat and within 2 m of distance on each side of the journey, catching insects with an hand entomological net during 15 minutes. Captured specimens were transferred to a jar containing potassium cyanide and stored in a cool box. Bees were then frozen in laboratory until taxonomic identification (only difficult specimens to identify were then prepared and pined, the others were identified without any physical preparation). The measurement protocol needed only one person and there were three sessions in the season (spring, summer, autumn).
Earthworm sampling was carried out following two successive and complementary methods: 1) pouring an allyl-isothiocyanate plus ethanol solution diluted with water, into wood frames (30 cm x 30 cm x 20 cm) which were placed on the ground (a person standing on it to provide a good contact between frame and soil), and collecting the earthworms that came upward during the first 20 minutes; 2) extracting the soil core delimited by the wood frame (20 cm depth) and hand-sorting the earthworms on a plastic sheet. This way of sampling was realised simultaneously (or repeated in the same session if less than three workers available) three times in each plot. Samples were placed in cool boxes containing formalin and transferred to refrigerators in the laboratory. The measurement protocol assumed ideally a sampling team of 5 persons and there was only one session in the season for earthworms.
Spider sampling was carried out with the aid of a modified vacuum/blower shredder (Stihl SH 86-D), and 5 suction samples were taken on each plot (each suction had an area of 0.1 m² and lasted 30 seconds). The samples were sorted (i.e. the spiders were separated from other
Ancona - 122nd EAAE Seminar
"Evidence-Based Agricultural and Rural Policy Making”
Page 6 of 12
material such soil or organic matter) and placed in vials with 70% alcohol during the fieldwork. The protocol of measurement considered ideally a sampling team of 3-4 persons and there were three sessions in the season (spring, summer, autumn).
Vegetation sampling was carried out by recording the vascular plants present in each plot (with the exception of lichens and bryophytes) and assessing the percentage of coverage for each species using 5% categories (for further details on the indicator protocols of measurement see Dennis et al., 2010).
We propose a cost-effectiveness analysis assessed as the ratio between cost and effectiveness C/E, where the measurement of the effectiveness is performed through the following equation (equation 1):
Eq. 1
where Ei = effectiveness of the indicator i,
xi= biodiversity value for the x sample,
R = value of biodiversity of reference (see eq. 2),
ni = number of samples gathered for the indicator i.
R is the average value of biodiversity assessed through the set of indicators and is calculated following the equation (equation 2).
Eq. 2
where Bb, Be, Bs and Bv are respectively the mean values of biodiversity assessed through the B, EW, S and V indicators. The values of biodiversity are expressed in the same unit of measure e.g. Shannon and Wiener index (Margalef, 1958) or others and measured in the same plots.
The equation 2 gives the same weight to each indicator regardless of their accuracy. Therefore, a meaningful estimation of effectiveness through this method implies the comparison of sound and validated protocols of measurement of biodiversity (this is the case of the BioBio indicators).
4. RESULTS
The records gathered by the research field unit for the analysis of costs were 1.306 in total and included 31 types of resources: 9 for consumables, 15 for labour and 6 for transport; only 1 type of equipment (the vacuum/blower) was recorded (Table 1). Sixteen farms (8 organic and 8 conventional) were sampled to test the performance of the various biodiversity indicators of. The average area per farm was 79 ha (range 8-222 ha), and the survey covered an aggregate area of 1.260 ha. An average of 17 plots per farm (range 5-32 plots per farm) and 270 plots in aggregate were sampled, and a total of 5.940 samples were gathered and processed for the study (371 samples on average per farm – with a range of 110-704 samples per farm). More than 100 visits to the farms were necessary to complete the field activities with an average of 130 minutes of transportation time spent to get to the farms per visit (time for go and back).
Table 1: General information about the sampling activity accomplished by the research unit in the case study (numbers in brackets are respectively 1st and 3rd quartiles).
Records 1.306
Number of farms 16
Total farm hectares 1.260
Hectares per farm 79 (24-112)
Total plots sampled 270
Number of plots per farm 17 (11-23)
Total number of samples 5.940
Number of samples per farm 371 (231-506)
The total cost for the measurement of the four biodiversity indicators was €119.165. Evident differences in costs among the categories of activity and resources were highlighted in the analysis. The largest share of costs was devoted to the fieldwork sampling, which accounted for 75% of total costs (€89.934 - Figure 3-A). Together, taxonomy identification of invertebrate species (€23.602) and fieldwork accounted for the 95% of total costs of the survey. The analysis pointed to the secondary importance of deskwork and laboratory activities (€5.629 on aggregate). Laboratory work (€3.652) was required mainly for the B, EW and S indicators, whereas deskwork (€ 1.977) was necessary only for the vegetation indicator.
As expected, labour was by far the highest resource cost (€105.391 on aggregate – Figure 3-B), accounting for almost 90% of total costs. The research unit needed 3.757 labour hours to complete the measurement of the four biodiversity indicators (470 person days with 8 hours work per day; hours spent in taxonomy are not included in the hours amount as they were not paid in hours of labour). The cost share of the other resources was always under 7%: transport and consumables costs (€5.516 and €8.246 respectively) were less than 12% of costs on aggregate, whereas equipment accounted for a negligible portion of costs.
Ancona - 122nd EAAE Seminar
"Evidence-Based Agricultural and Rural Policy Making”
Page 8 of 12
Figure 3: Percentage of total costs per category of activity (A) and type of resource (B) spent by the research unit for the measurement of the biodiversity indicators of.
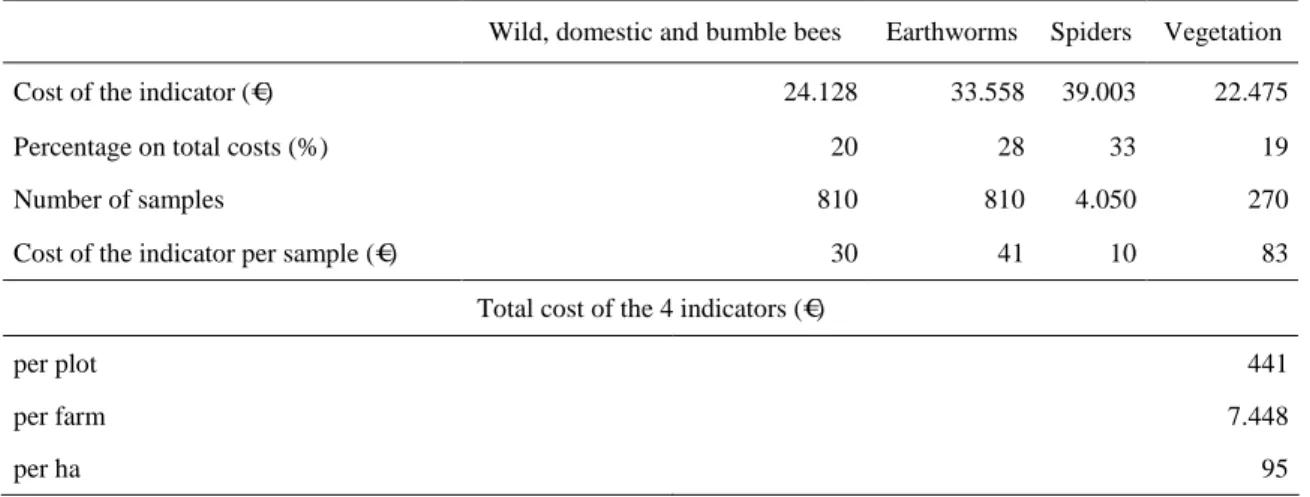
The range of costs for the measurement of the indicators was between €22.475 (vegetation indicator) and €39.003 (spider indicator - Table 2). The cost of the earthworm indicator was close to that of the spiders but the number of samples gathered for the latter was 5 times higher than for EW. These two indicators together accounted for 61% of total costs. The cost of the wild, domestic and bumble bee indicator was comparable to the vegetation costs, even though the sampling intensity of the B indicator was three times higher than the V indicator. The total measurement cost of the four indicator set was considerable and was assessed at €441 per plot, €7.448 per farm and €95 per hectare.
Table 2: Cost of the measurement of the four biodiversity indicators, number of samples gathered in the case study and average cost of the indicators per sample, total cost of the aggregate measurement for the four indicators per plot, farm, and hectare.
Wild, domestic and bumble bees Earthworms Spiders Vegetation
Cost of the indicator (€) 24.128 33.558 39.003 22.475
Percentage on total costs (%) 20 28 33 19
Number of samples 810 810 4.050 270
Cost of the indicator per sample (€) 30 41 10 83
Total cost of the 4 indicators (€)
per plot 441
per farm 7.448
Considering the case of an equivalent cost-effectiveness scenario for the four indicators and given the costs of the measurement assessed in the present work, we present in Table 3 the effectiveness of B, EW and V compared to the spiders indicator. In the first column of the table the effectiveness are presented by way of a value = 1 for the effectiveness of the spiders indicator. In the second column the values of the squared deviation from R are presented by way of a value for S = 1. In an equivalent cost-effectiveness scenario, the effectiveness of the B, EW and V indicators should be respectively 38%, 14% and 42% lower than S. Employing equation 1 as proposed in the methodology, we can assess the squared deviation from R per sample for the different indicators. This could be used to compare the average efficiency per sample necessary for the indicators to reach equivalent values of cost-effectiveness. Because of the high number of samples, the spider indicator should reach a squared deviation from R per sample three times lower than the V indicator, 2,6 times lower than the B indicator and 1,4 times lower than the EW indicator. In other words, following the analysed protocol of measurement, the spider indicator samples should be able to assess the R value with an estimated precision three times higher than the vegetation samples to reach an equivalent value of cost-effectiveness.
Table 3: Values of effectiveness calculated by equation 1 in an equivalent cost-effectiveness scenario for the four indicators. The measurement costs assessed in the present work are included in the calculation.
Effectiveness ∑(xi - R)2/ni
S - Spiders 1 1
B - Wild, domestic and bumble bees 0,62 2,6
EW - Earthworms 0,86 1,4
V - Vegetation 0,58 3,0
5. DISCUSSION AND CONCLUSIONS
Indicators were originally proposed to solve the problem of the feasibility of the measurement of biodiversity. The ability of indicators to fulfil such task is however dependent on their cost, particular if a day to day use in regular policy evaluation is to be envisaged. Therefore, in light of budgetary constraints, a reliable cost-effectiveness analysis should be developed in order to assess the best set of indicators given a budget constraint and a specific policy evaluation issue.
One of the aims of this work was to develop a suitable and reliable methodology for the assessment of the costs generated by the measurement of biodiversity. This task was accomplished by combining the expertise from both the fields of ecology and economics. This method was based on the direct recording of effort data in ad-hoc built cost-forms. To our knowledge, this approach is largely absent in existing literature, where the common method for the assessment of these costs is indirect (ex post) or by estimation based on proxies (such as labour effort) or expert judgement.
Ancona - 122nd EAAE Seminar
"Evidence-Based Agricultural and Rural Policy Making”
Page 10 of 12
The significant costs assessed for this survey can be justified in part by the scientific targets of the research which could lead to oversampling. On the other hand, the research unit could employ lower-cost labour (e.g. students) in order to contain costs. Moreover, the total costs should be higher when also considering organisation, reporting and the preparation of sampling activities. Given the costs assessed in this work, the employment of this set of indicators for periodical monitoring should be evaluated carefully. Most likely, a detailed organisation of the work could improve the efficiency of the measurement. For example, the high costs of taxonomy identification lead one to reflect on the possibility of testing indicators based on groups of species and which require less involvement of specialists. This issue is not only related to the identification costs but also the increasing difficulty in finding taxonomists for some groups of species which leads to a taxonomy impediment (MacLeod, 2010).
The analysis of costs pointed out noteworthy differences between the types of activity and resource spent in the measurement. This kind of analysis turns out to be a valid tool for the optimisation of the utilisation of available resources. This evidence is of significant importance considering the gap between the need for, and the availability of funds for biodiversity. An increased availability of reliable cost data concerning the measurement of biodiversity will be of primary importance for the development of cost-effectiveness analysis and in the enhancement of biodiversity assessments and conservation programmes.
The diversity of costs per sample and per plot in the studied indicators should stress the importance of cost-effectiveness analyses for the organisation of biodiversity surveys and for the implementation of measurement protocols.
In this work, the high cost of the spider indicator requires greater effectiveness to reach a comparable level of efficiency with respect to the other indicators. The possibility of reducing the number of samples for S could reduce the total costs for this indicator, but from our analysis the higher costs are mainly linked to the three measurement sessions scheduled in the protocol. Three separate visits to each farm necessarily result in high costs for labour time spent in transportation. On the contrary, the use of the vacuum/blower tool allowed for the gathering of a high number of samples with low equipment use costs . This evidence, for example, points to the possibility of optimising the spider indicator through the gathering of a higher number of samples per travel. Even though the wild, domestic and bumble bee indicator required three sessions of sampling, the costs for this indicator were considerably lower than for S. This is likely related to the lower time effort for the bee collection which allowed the team to visit many farms in one single trip.
The Millennium Ecosystem Assessment points to the enhancement of cost-effectiveness among the main future targets of biodiversity conservation. This can be accomplished by improving the effectiveness of the measurement together with a more rational utilisation of funds. A thorough analysis of reliable cost data will undoubtedly be a fundamental part of this process.
This methodology of cost-effectiveness analysis favours low-cost and high precision indicators, but no conclusions can be drawn from these results with regard to the accuracy of the
indicators given that we do not have information about the accuracy of the value of reference of biodiversity (R) for the case study, e.g. the method employed for the assessment of R (equation 2) gives the same weight to the indicators regardless of the number of samples gathered. Nevertheless, our objective was to propose a cost-effectiveness analysis that allowed for the comparison of different indicators of biodiversity (and their protocol of measurement) considering the cost of the measurement weighed against its effectiveness. By that way, this method should be able to assess the most efficient indicator within a given set of indicators.. The next step is to test and improve the performance of the methodology with both cost and biodiversity data from the BioBio project.
ACKNOWLEDGMENT
This work was supported by a grant from UE-FP7, BioBio – Indicators for biodiversity in organic and low input farming systems.
REFERENCES
Bisevac, L. and Majer, J. (2002). Cost effectiveness and data-yield of biodiversity surveys. Journal of the Royal Society of Western Australia. 85: 129-132.
Cantarello, E. and Newton, A.C. (2008). Towards cost-effective indicators to maintain Natura 2000 sites in favourable conservation status. Preliminary results from Cansiglio and New Forest. iForest – Biogeosciences and Forestry. 1: 75-80.
Carlson, M. and Schmiegelow, F. (2002). Cost-effective sampling design applied to large scale monitoring of boreal birds. Conservation Ecology. 6(2): 11.
Chambers, R.G. (1988). Applied production analysis. Cambridge University Press, UK: Cambridge.
Dennis, P., Herzog, F. and Jeanneret, P., (Eds.), Arndorfer, M., Bogers. M., Bunce, R.G.H., Bailey, D., Choisis J.-P., Choisis N., Cuming, D., Ehrmann, O., Fjellstad, W., Franck, T., Fraser, M.D., Friedel, J., Geijzendorffer, I., Gomiero, T., Jongman, R., Kainz, M., Kölliker, R., Last L., Lüscher, G., Moreno, G., Nicholas, P., Paoletti, M.G., Papaja-Hülsbergen, S., Pelosi, C., Pointereau, P., Sarthou, J.-P., Schneider, M., Siebrecht, N., Targetti, S., Viaggi, D., Wilkes J. and Wolfrum, S. (2010). Selection and field validation of candidate biodiversity indicators, including field manual. Handbook for testing candidate indicators of organic/low-input farming and biodiversity. Deliverable 2.2; Project no. 227161 BioBio “Indicators for biodiversity in organic and low-input farming systems”.
Franco, A.M.A., Palmeirim, J.M. and Sutherland, W.J. (2007). A method for comparing effectiveness of research techniques in conservation and applied ecology. Biological Conservation. 134: 96-105.
Gardner, T.B., Barlow, J., Araujo, I.S., Avila-Pires, T.C., Bonaldo, A.B., Costa, J.E., Esposito, M.C., Ferreira, L.V., Hawes, J., Hernandez, M.I.M., Hoogmoed, M.S., Leite, R.N., Lo-Man-Hung, N.F., Malcolm, J.R.,. Martinus, M.B., Mestre, L.A.M., Miranda-Santos, R., Overal, W.L., Parry, L., Peters, S.L., Ribeiro-Junior, M.A., Da Silva, M.N.F., Da Silva Motta, C. and Peres, C.A. (2008). The cost-effectiveness of biodiversity surveys in tropical forests. Ecology Letters. 11: 139-150.
Juutinen, A. and Mönkkönen, M. (2004). Testing alternative indicators for biodiversity conservation in old-growth boreal forests: ecology and economics. Ecological Economics. 50: 35-48.
Mace, G.M. and Baillie, J.M.E. (2007). The 2010 biodiversity indicators: challenges for science and policy. Conservation Biology. 21(6):1406-1413.
MacLeod, N. (2010). Alternative 2D and 3D form characterization approaches to the automated identification of biological species. In Nimis, P.L. and Vignes Lebbe, R. (eds.), Tools for identifying biodiversity: progress and problems. Paris. 225-229.
Ancona - 122nd EAAE Seminar
"Evidence-Based Agricultural and Rural Policy Making”
Page 12 of 12
Margalef, R. (1958). Information theory in ecology. General Systems. 3: 36-71.
Millennium Ecosystem Assessment (2005). Ecosystems and Human Well Being: Global Assessment Report.Island Press. Washington DC.
Münier, B. Birr-Pedersen, K. and Schou, J.S. (2004). Combined ecological and economic modelling in agricultural land use scenarios. Ecological Modelling. 174: 5-18.
OECD, (2001). OECD expert meeting on agri-biodiversity indicators. Zurich..
Polasky, S. Nelson, E. Lonsdorf, E. Fackler, P. and Starfield A. (2005). Conserving species in a working landscape: land use with biological and economic objectives. Ecological Applications 15(4): 1387-1401.
Qi, A., Perry, J.N., Pidgeon, J.D., Haylock, L.A. and Brooks, D.R. (2008). Cost-efficacy in measuring farmland biodiversity – lessons from the Farm Scale Evaluations of genetically modified herbicide-tolerant crops. Annals of Applied Biology. 152: 93–101.
Wätzold, F. and Schwerdtner, K. (2005). Why be wasteful when preserving a valuable resource? A review article on the cost-effectiveness of European biodiversity conservation policy. Biological Conservation. 123: 327-338.