Université de Sherbrooke
Faculté de génie
Département de génie chimique et de génie biotechnologique
Estimation de paramètres et modélisation de piles au
lithium et aux ions lithium
Parameter estimation and modeling of lithium and
lithium-ion batteries
Thèse de doctorat
Spécialité : génie chimique
Barzin Rajabloo
Jury : Marin Désilets (directeur)
Pierre Proulx
Marcel Lacoix
Daniel Bélanger
II To my parents
III
Résumé
Les batteries au Li-ion (BLI) figurent parmi les technologies les plus prometteuses pour le design de systèmes de stockage d’énergie à cause de leurs caractéristiques intrinsèques. Leur grand voltage de travail, leur grande densité énergétique et leur impact écologique positif expliquent l’intérêt soutenu de l’utilisation des BLI pour remplacer par exemple les moteurs à explosion dans les applications de transport terrestre. Il n’est donc pas surprenant de constater que ces technologies ont eu une attention scientifique importante et que plusieurs auteurs ont développé des modèles numériques simulant leur comportement. Il reste cependant difficile de représenter tous les phénomènes multiphysiques qui se déroulent à l’intérieur des batteries rechargeables par des modèles mathématiques. Des compromis importants doivent être faits lorsqu’on doit choisir un modèle représentant les principaux phénomènes physico-chimiques tout en restant assez simple pour pouvoir l’utiliser dans des études s’échelonnant sur de larges périodes temps. Représentant à la fois la cinétique électrochimique et le transport de masse, les modèles électrochimiques ont été introduits pour prendre en compte les phénomènes les plus importants. Ces modèles demandent cependant de connaître tous les paramètres électrochimiques, des données qui sont difficiles à obtenir expérimentalement. Les techniques d’estimation de paramètres simplifient l’obtention de ces données critiques pour représenter le comportement de la pile. Dans cette étude, une méthode d’estimation de paramètres a été introduite pour estimer les paramètres électrochimiques des BLI les plus influents, en prenant en compte différents matériaux d’électrode positive. La méthode proposée repose sur une amélioration du modèle à particule unique, qui représente lui-même une simplification du modèle pseudo-2D, le modèle électrochimique le plus connu et le plus complexe dans le domaine de la simulation de piles à électrodes poreuses. Les paramètres électrochimiques les plus importants ont été identifiés en négligeant la micro-structure de la batterie au Li-ion. Une étude de sensibilité a ensuite permis d’identifier les domaines temporels et les courants de décharge les plus favorables pour l’identification de chaque paramètre. Étant donné que le comportement des BLI dépend fortement des matériaux actifs utilisés pour la fabrication des électrodes, la méthodologie proposée a été testée sur 3 matériaux actifs différents (LiCoO2,
LiMn2O4 and LiFePO4) employés dans la fabrication industrielle d’électrodes positives.
Finalement, une autre amélioration du modèle à particule unique a été proposée et testée afin de mieux représenter le comportement spécifique du LiFePO4 (LFP), un matériau actif parmi les
plus prometteurs pour l’électrode positive. Plus précisément, un modèle électrochimique simplifié incluant une équation représentant la variation de résistance en fonction du degré de décharge a été développé et les coefficients de cette équation ont été déterminés au moyen de la méthode d’estimation de paramètres proposée.
Mots-clés: Batteries au Li-ion, cellule Li/LFP, estimation de paramètres, modèle à particule
IV
Abstract
Specific characteristics of Li-ion batteries (LIBs) make them promising candidates for energy storage systems when compared with the others. High working voltage and energy density as well as green technology of LIBs are the reasons for increasing interest to use these electrochemical systems as the substitute of conventional combustion engine of automobiles. Consequently, the interest to study these technologies has increased recently and several models have been introduced to simulate their behavior. However, it is difficult to model all multiphysics phenomena happening inside such rechargeable batteries. Some important choices need to be made when one wants to select an appropriate model for considering the main physics elements and yet be simple enough for large time scale studies. Combining chemical/electrochemical kinetics and transport phenomena, electrochemical models have been introduced to tackle most important principles inside the cell. These models, however, require known electrochemical parameters which most of the time are hard to get experimentally. Parameter estimation (PE) techniques simplify extracting these representative parameters of the cell behaviour. In this study, a PE methodology has been introduced to estimate the most influential electrochemical parameters of LIBs considering different positive electrode materials. The methodology starts with simplifying the well-known pseudo-two-dimensional (P2D) model, the most complex and the most popular electrochemical engineering models for simulating porous electrodes and introducing an enhanced single particle model (SPM). Neglecting the micro-structure of LIB, major electrochemical parameters are detected at the cell level. Next, the best time domains and discharge current rates to estimate each parameter are estimated by virtue of sensitivity analyses. Owing to the fact that the behavior of LIBs depends on the active materials employed in the electrode, the proposed methodology is verified for three different positive electrode active materials including LiCoO2, LiMn2O4 and LiFePO4.
Furthermore, focusing on LiFePO4 (LFP), as the most promising positive electrode active
material, a new modification is proposed to the model to address special features of this material. In this regard, a simplified electrochemical model is equipped with a variable resistance equation whose coefficients are estimated by means of PE.
V
Acknowledgments
Foremost, I would like to express my sincere gratitude to my advisor Prof. Martin Désilets for his helpful advices, motivation, and continuous support. I will remember all the moments he was encouraging me during the hard times when I had lost my motivation.
My sincere thanks also goes to my thesis committee: Prof. Daniel Bélanger, Prof. Pierre Proulx and Prof. Marcel Lacroix, for their helpful comments and encouragement.
I am highly indebted to Prof. Gessie Brisard, Yves Choquette and Prof. Gaétan Lantagne, for their guidance and for providing valuable information regarding this research.
I express my special thanks and love to my friends, Mohsen Ariana, Mohammad Gholami and Ali Jokar and all other friends who have helped me during these years.
Last but not the least; I would like to thank my family: my parents, my wife and my sister for supporting me. There is no way to thank you enough. I will be always grateful to you for everything you have done for me.
VI
Table of Contents
Résumé... III Abstract ... IV Acknowledgments ...V List of figures ... VIII List of tables...X List of symbols ... XI List of abbreviations ... XIII
1. Introduction ... 1
1.1 Lithium ion batteries ... 1
1.2 BMS ... 3
1.3 Parameter estimation ... 4
1.4 Research project description ... 5
1.5 Research project objectives ... 6
1.5.1 Principal objectives ... 6
1.5.2 Specific objectives ... 6
1.6 Contribution, originality of this study ... 6
1.7 Thesis plan ... 7
2. State of the art ... 9
2.1 Lithium-ion batteries modeling ... 9
2.1.1 Pseudo-two-dimensional (P2D) model ... 10
2.1.2 Single particle model (SPM) ... 13
2.2 Parameter estimation (PE) ... 14
2.2.1 Parameter estimation process ... 16
CHAPITRE 3 : AVANT-PROPOS ... 20
3. An inverse method for estimating the electrochemical parameters of lithium-ion batteries, Part II: Implementation ... 22
3.1 Abstract ... 22
3.2 Introduction ... 22
3.3 Direct model ... 24
3.4 The parameter estimation process ... 25
3.5 The reference data and the parameters ... 27
3.5.1 The Reference data ... 27
3.5.2 The parameters ... 28
3.6 Sensitivity analysis ... 29
VII
3.8 Conclusion ... 38
Acknowledgements ... 38
Appendix ... 38
CHAPITRE 4 : AVANT-PROPOS ... 41
4. A new variable resistance single particle model for lithium iron phosphate electrode ... 42
4.1 Abstract ... 42
4.2 Introduction ... 42
4.3 Experimental ... 45
4.4 Model development ... 46
4.5 Results and discussion ... 52
4.6 Conclusion ... 58 Acknowledgements ... 58 Nomenclature ... 58 5. Conclusion ... 60 5.1 Future work ... 61 References ... 62
VIII
List of figures
Figure 1.1: Ragone plot for different secondary batteries [1] ... 1
Figure 1.2: Different types of lithium secondary batteries based on their shape: (a) cylindrical, (b) coin, (c) prismatic and (d) pouch [2] ... 2
Figure 1.3: Movement of Li+ in an electrolyte and insertion/extraction of Li+ within electrodes in a lithium ion battery ... 2
Figure 1.4: Schematic of BMS ... 4
Figure 1.5: Parameter estimation process ... 5
Figure 2.1: SPM for discharge process ... 13
Figure 2.2: Different time domains for estimating electrochemical parameters ... 18
Figure 3.1: Solution procedure for inverse problems [40] ... 26
Figure 3.2: Schematic curve of sensitivity analysis for graphite/LiCoO2 (presented in Part I) 30 Figure 3.3: Schematic curve generated from a sensitivity analysis for graphite/LiMn2O4 ... 31
Figure 3.4: Schematic curve of sensitivity analysis for graphite/LiFePO4 ... 32
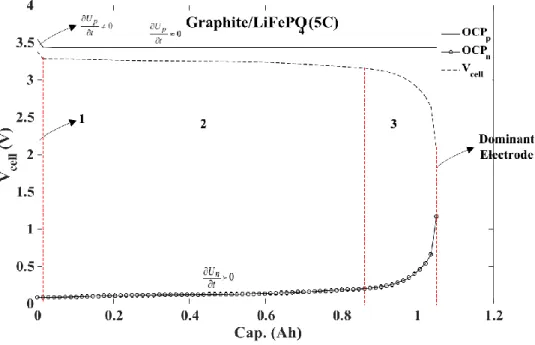
Figure 3.5: Cell potential and open circuit potential of two electrodes (graphite/LFP) for a discharge current of 5C ... 32
Figure 3.6: Simulated (solid lines) and experimental (symbols) discharge curves for the graphite/LiCoO2 cell ... 34
Figure 3.7: Simulated (solid lines) and experimental (symbols) discharge curves for the graphite/LiMn2O4 cell ... 35
Figure 3.8: Current-dependent radius of particles in graphite electrode... 36
Figure 3.9: Simulated (solid lines) and experimental (symbols) discharge curves for the graphite/ LiFePO4 cell ... 37
Figure 4.1: (a) Schematic of the cell (b) SEM image of the cross section of the positive electrode and current collector cross section ... 46
IX
Figure 4.2: Schematic of the simulated and experimental discharge curves of Li/LFP half-cell with (a) thin positive electrode, and (b) thick positive electrode. OCP is depicted in its plateau condition. ... 48 Figure 4.3: (a) Schematic of an experimental discharge potential and corresponding OCP, and (b) XRD analysis of disassembled LFP electrode after discharge process. Two phases exist in LFP active material discharged with 1C rate. ... 49 Figure 4.4: Simulated (solid lines) and experimental (symbols) discharge curves for high-power cell ... 54 Figure 4.5: Simulated (solid lines) and experimental (symbols) charge curves for high-power cell ... 54 Figure 4.6: Apparent particle radius in each charge/discharge current from the PE and the SPM ... 55 Figure 4.7: Simulated (solid lines) and experimental (symbols) potential of high-power Li/LFP half-cell for a variable load ... 56 Figure 4.8: Simulated (solid line) and experimental (symbols) discharge curves for high-energy cell ... 56
X
List of tables
Table 2.1: Best time domains for PE of different electrochemical parameters of a graphite/LCO
cell ... 19
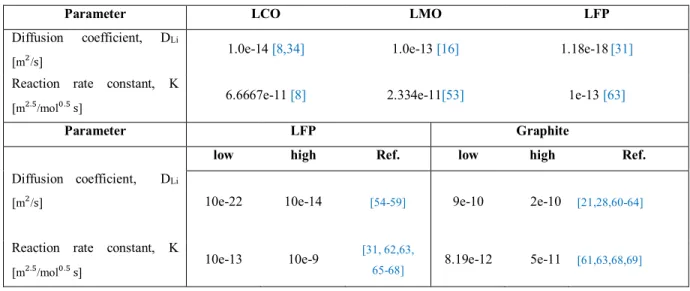
Table 3.1: Range of the diffusion coefficients and of the reaction rate constants for Li-ion batteries ... 29
Table 3.2: Estimated parameters for the graphite/LiCoO2 cell ... 34
Table 3.3: Estimated parameters for the graphite/ LiMn2O4 cell ... 35
Table 3.4: Estimated parameters for the graphite/LiFePO4 cell ... 36
Table 3.5: the specific error values of all discharge curves for each cathode material ... 37
Table 4.1: Measured and assumed parameters for the Li/LiFePO4 cell ... 53
Table 4.2: Estimated parameters for the high-power Li/LFP half-cell ... 53
Table 4.3: Estimated parameters for the high-energy Li/LFP half-cell ... 57
XI
List of symbols
𝑎𝑖 Specific surface of electrode 𝑖 (𝑖 = 𝑝, 𝑛), m2/m3𝑐 Electrolyte concentration, mol/m3
𝑐𝑠,𝑖 Concentration of lithium ions in the particle of electrode 𝑖 (𝑖 = 𝑝, 𝑛), mol/m3
𝑐𝑠,𝑖,0 Initial concentration of lithium ions in the particle of electrode 𝑖 (𝑖 = 𝑝, 𝑛), mol/m3
𝑐𝑠,𝑖𝑚𝑎𝑥 Maximum concentration of lithium ions in the particle of electrode 𝑖 (𝑖 = 𝑝, 𝑛), mol/m3
𝐷 Electrolyte diffusion coefficient, m2/s
𝐷𝑠,𝑖 Lithium ion diffusion coefficient in the particle of electrode 𝑖 (𝑖 = 𝑝, 𝑛), m2/s
𝐹 Faraday’s constant, C/mol
𝐼 Superficial current density, A/cm2
𝑖0 Exchange current density, A/cm2
𝑖𝑛 Transfer current normal to the surface of the active material, A/m2
𝑗𝑖 Wall flux of Li+ on the particle of electrode 𝑖 (𝑖 = 𝑝, 𝑛), mol/m2s
𝑛 Negative electrode 𝑝 Positive electrode 𝑟 Radial coordinate, m
𝑅 Universal gas constant , J/(mol K)
𝑅𝑖 Radius of the particle of electrode 𝑖 (𝑖 = 𝑝, 𝑛), m 𝑠 Separator
𝑠 Stoichiometric coefficient, positive for anodic reactants
𝑡+0 Li+ transference number with respect to the velocity of solvent
𝑇 Absolute temperature, K
𝑈𝑖 Open-circuit potential of electrode 𝑖 (𝑖 = 𝑝, 𝑛), V 𝑥 Spatial coordinate, m
𝑥𝑖0 Initial state of charge at the electrode 𝑖 (𝑖 = 𝑝, 𝑛)
Greek
XII 𝜀𝑖 Porosity of region 𝑖 (𝑖 = 𝑝, 𝑠, 𝑛)
𝜏 Tortuosity
𝜑1 Solid-phase potential, V
XIII
List of abbreviations
BDS Battery Design StudioBMS Battery Management System DOD Depth-Of-Discharge
EC Ethylene Carbonate ECM Equivalent Circuit Model
EIS Electrochemical Impedance Spectroscopy EOCV End Of Charge Voltage
EV Electric Vehicle
HEV Hybrid Electric Vehicle
HPPC Hybrid Pulse Power Characterization LIB Lithium Ion Battery
MCMB Mesocarbon microbeads P2D Pseudo 2 Dimensional
POD Proper Orthogonal Decomposition PSS Pseudo Steady State
SEI Solid Electrolyte Interface SOC State-Of-Charge
SOH State-Of-Health SPM Single Particle Model
1
1. Introduction
1.1 Lithium ion batteries
Lithium ion batteries (LIBs) have become one of the most appropriate candidates for energy storage because of their specific characteristics in comparison with alternative technologies. In fact, their prime position in the Ragone plot (Figure 1.1) and other features including long service life, high energy-to-weight ratios, no memory effect and low self-discharge are the reasons for their success.
Figure 1.1: Ragone plot for different secondary batteries [1]
Figure 1.2 illustrates different types of LIBs according to cell shape and component materials. A battery consists of five regions: positive electrode, negative electrode, a separator that prevents electron to flow directly between the electrodes and two current collectors on the outside of each electrode. Usually, lithium ion batteries use a transition metal oxide as a positive electrode, carbon as the negative electrode, and a lithium salt dissolved in a nonaqueous organic solvent as the electrolyte.
During discharge, the lithium ions are shuttled from the negative electrode (anode) to the positive electrode (cathode) whereas the reverse process occurs during charge (Figure 1.3). During the discharging process, the anode undergoes an oxidation reaction and lithium ions leave the negative electrode (e.g. carbon) towards positive electrode (e.g. LFP) while electrons move in the same direction in the external circuit. Meanwhile, a reduction reaction happens at the cathode when the lithium ions and electrons combine. The reverse process takes place during the charging process.
2
Figure 1.2: Different types of lithium secondary batteries based on their shape: (a) cylindrical, (b) coin, (c) prismatic and (d) pouch [2]
Figure 1.3: Movement of Li+ in an electrolyte and insertion/extraction of Li+ within electrodes in a lithium ion battery
The following characteristics are vital for different parts of a secondary battery. For anode materials, the potential of the electrochemical reaction should be close to the reduction potential of lithium metal. This characteristic makes it possible to provide continuous redox reactions and to maximize the performance of the cell by increasing cell voltage. Carbon-based materials are good candidates to obtain continuous, repeated redox reactions due to their stable structure. The
3
electrolyte should have an electrochemical and thermal stability within the range of the working conditions. For example, the temperature inside which the liquid electrolyte should be stable ranges from -20 to 60℃. Polymer electrolyte, on the other hand, is needed to be stable until 4.5 V because the typical metal oxide positive electrodes of Li-ion batteries such as LiCoO2,
LiNiO2, and LiMn2O4 have a voltage of 4.3V in fully charged state [3]. The separator, which prevents short circuit caused by the electrical contact between the cathode and the anode, should keep its integrity at high temperatures. Stable transition metal oxides are typically used as positive electrodes to minimize the expansion/contraction caused by intercalation /deintercalation of lithium ions within lattice structure. Common cathode materials are lithium transition metal oxides such as layered LiMO2 (M=Ni, Co, Mn) and spinel LiM2O4 (M=Ti, V, Mn) and lithium transition metal phosphates such as olivine LiMPO4 (M=Fe, Co, Ni, Mn).
Among various olivine composites, LiFePO4 (LFP) has found to be the most promising because of its structural and chemical stabilities. However, this active material suffers from poor electronic conductivity and low apparent lithium diffusivity. Another specific behavior of the LFP active material is a two-phase process of intercalation/deintercalation. The special treatments to overcome LFP deficiencies and its complex two-phase intercalation/ deintercalation process make it difficult to simulate this challenging technology.
1.2 BMS
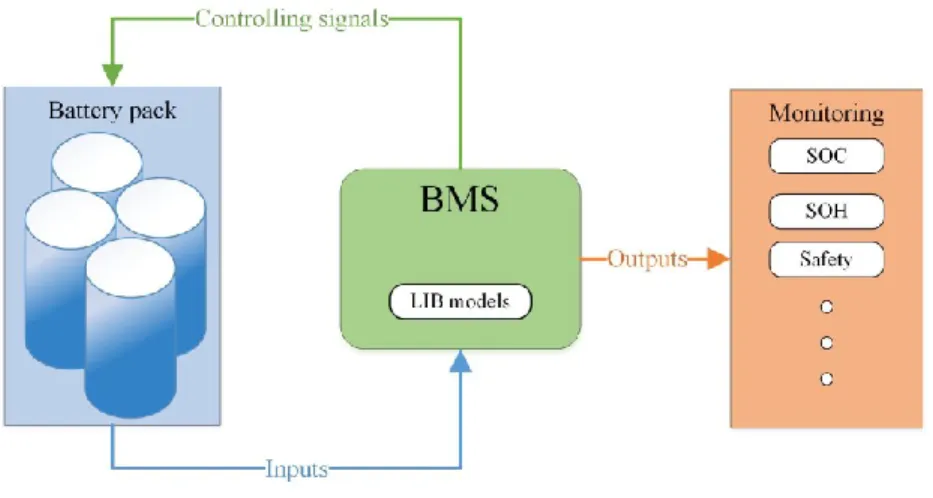
To meet the power and the energy required for various applications, especially in electrical vehicle (EV), large numbers of LIBs are usually used in series and/or in parallel configurations. Monitoring the operation and controlling the working conditions of such a pack of batteries is vital. A Battery Management System (BMS) is responsible to receive input data such as the surface temperature and terminal potential from the battery pack, and to simulate the electrical behaviour of the batteries by virtue of a mathematical model (Figure 1.4). This intelligent system provides valuable information such as the State of Charge (SOC) and State of Health (SOH) of the battery pack. In addition, an active BMS can change the working conditions of batteries to optimize their lifespan and performance.
4
Figure 1.4: Schematic of BMS
LIB models, at the heart of BMS, can be divided into two general types: empirical-based models and electrochemical-based models. The former, which are usually used in automotive industries, are simple and fast. In fact, empirical-based models typically use previous responses of the batteries to predict the most probable future behaviors of these energy storage devices. Although they deliver a fast response, they are not able to simulate the performance of cells in working conditions that are different from the conditions used for calibrating the models.
Electrochemical-based models, on the other hand, are capable to simulate the behavior of the batteries in a wide range of operating conditions and applications. These models take into account the chemical/electrochemical kinetics and transport equations to simulate all physical phenomena happening inside the cells. Electrochemical-based models, however, are more complex and they need larger number of parameters including physical and chemical parameters. Some parameters, such as the physical dimensions and the chemistry of materials are obtainable from experimental measurements. However, some other parameters including design parameters, electrode specific parameters, kinetic parameters, etc. are hardly accessible from measurements. Parameter Estimation (PE) techniques are introduced to get around these difficulties. These techniques can also be implemented to study several dimensions of LIB performance, such as their thermal behavior and lifespan predictions.
1.3 Parameter estimation
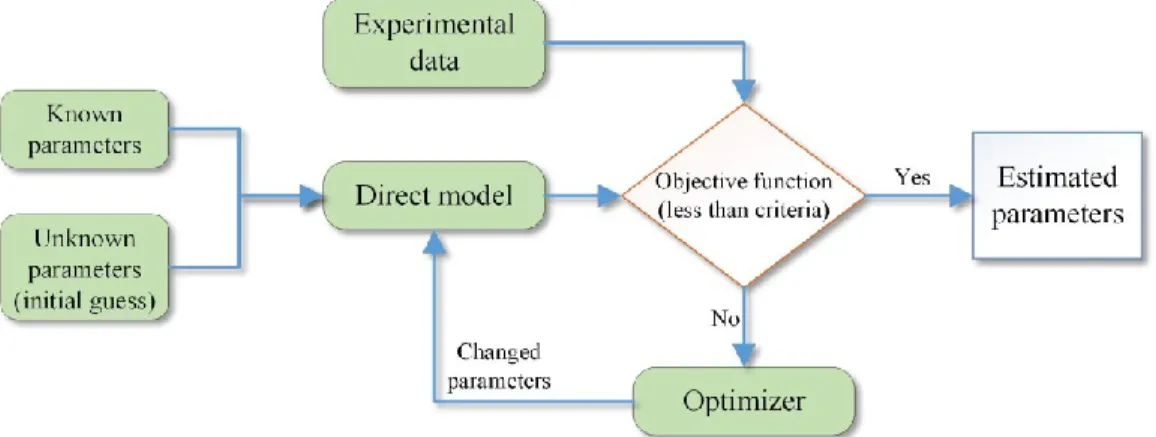
Inverse methods are developed to estimate the unknown parameters of a system based on its measured behaviour. The idea is to minimize the difference between the experimental data reflecting the performance of the system and the simulated results. This optimization is conducted by changing the parameters systematically and iteratively (Figure 1.5). When this difference (objective function) is less than an a priori established criterion, the estimated parameters are assumed to be representative of the real physical parameters. To verify the
5
results, the estimated parameters should be examined in conditions beyond the ones used for PE process.
Figure 1.5: Parameter estimation process
Parameter estimation, as one of the most important deliverables of an inverse problem, depends on several factors. Initial guesses and boundaries for the estimated parameters play a vital role in PE. In addition, a well-suited direct model significantly alters the PE process. This model should be fast and simple enough to be efficiently used inside an iterative loop. At the same time, it should be accurate enough to consider important physical phenomena inside the cells. PE process also relies on the optimization process. Choosing an appropriate solution method can help to guaranty the reliability of the parameters obtained from this process.
1.4 Research project description
Generally speaking, the study of the behavior of LIBs demands to understand and implement all dominant physical phenomena happening inside the cell by virtue of a well suited electrochemical model. The governing equations to be included in such a comprehensive model need to rely on some significant parameters. These parameters, which are not facile to extract from experiment, can be estimated by PE.
Beside common major parameters found in all electrode active materials, the special features of LFP like resistive-reactant characteristics of these favorable positive electrode active materials, add more complexities to the electrochemical model. Complex models are typically not well suited for time consuming study such as predicting the life of the cell. On the other side, the importance to estimate cell parameters with a high reliability, which calls for the effectiveness of the PE procedure, and the urge to introduce a convenient model for LFP material lead us to define the basic question of the research project: ‘Can we develop a simple electrochemical model that represents the behavior of LFP positive electrode in Li-ion batteries and use it inside an inverse method in order to estimate the most influential parameters?’
6
The focus of this study will be on the electrochemical models introduced to simulate LIB at the cell level. In other words, the micro-structure of LIB and physical phenomena taking place in a very small time and length scale are ignored. Working on the most general yet accurate electrochemical model, PE methodology developed in this study is a good seeding point for future studies at large time and length scale such as predicting the life of LIBs or performance of LIBs in pack configuration.
1.5 Research project objectives
1.5.1 Principal objectives
The principal objectives of this study are: 1. developing a PE methodology which works for different chemistries of electrode materials used in representative working conditions, 2. introducing a simple still precise model for LFP active material using PE methodology developed as the first objective to identify the hard to get parameters.
This study will take into account the modifications of an applicable electrochemical model and using a proper optimizer.
1.5.2 Specific objectives
In order to fulfill the principal goals, other objectives should be accomplished:
1. Find and adapt a befitting direct model which includes the most important phenomena occurring inside the cell. This model needs to be as simple as possible to guaranty the convergence of the time consuming PE process.
2. Perform sensitivity analyses to detect the important electrochemical parameters and the way they influence the performance of the cell.
3. Choose an appropriate optimizer and develop a well-designed and efficient PE procedure. 4. Modify the electrochemical model to represent the special features of LFP active material while avoiding complex models. It is necessary to consider the special features of LFP through simple equations whose constants can be obtained by PE.
1.6 Contribution, originality of this study
As discussed earlier, the simulation of LIBs is of a great importance due to the increasing demand related to these technologies, especially in the automotive industries. Although
7
numerous researches are focusing in this field, a better understanding of this device is still of great scientific value. Moreover, varieties of electrode materials and their peculiar features call for developing specialized models. It is worth noting that the need to use more accurate and complex models than empirical relations entrains the need to find a systematic way to extract the required parameters.
The contribution and the originality of this study comprise two different aspects of the research question. In PE methodology, a systematic inverse method is applied to decipher all main electrochemical parameters. These parameters are estimated from the domains where they have higher influence on the simulated results. Incorporating a mathematical sensitivity analysis in PE procedure for the first time has strengthen the effectiveness of the procedure and the reliability of the obtained parameters. This unique methodology can be applied for any electrode active materials to efficiently estimate inaccessible parameters of the cells. The original PE process developed in this study has been verified for three different positive electrode chemistries.
For the second part of the research question, a new modification has been proposed to one of the prevalent electrochemical model in order to consider the special features of LFP as the positive electrode material. In this regard, an equation representing a variable resistance of LFP has been proposed and its coefficients have been estimated by virtue of the PE. This unique and efficient model can be incorporated into larger numerical studies without compromising accuracy and reliability.
1.7 Thesis plan
The thesis contains five chapters as follow:
State of art, as the second chapter, reviews other related studies. Besides, more detailed explanations about different LIB models have been included in this chapter. The selection of a proper electrochemical model is demonstrated. Simplifications of complex models to build a quick, simpler but accurate one are also illustrated. The PE methodology, as the first part of research question, is clarified here. Finally, to understand the importance and the influences of the main parameters on the simulation results, a sensitivity analysis is introduced and conducted in this chapter three.
The third chapter presents the implementations of the PE methodology explained in the second chapter. The methodology for estimating the needed electrochemical parameters is verified for three different positive electrode active materials including LiCoO2, LiMn2O4 and LiFeO4.
8
In chapter 4, an electrochemical model is modified to consider the peculiar specifications of LFP as positive electrode active material. In fact, a variable resistance equation is coupled with the electrochemical kinetics and transport equations. This resistance is representing two phenomena observed at the end of the discharge process of LIBs using LFP as the positive active material including: 1. higher diffusion overpotential as Li+ ions are intercalated inside larger
particles, 2. higher ohmic resistance based on resistive-reactant feature of LFP material. The proposed model is verified for two different Li/LFP cells, designed respectively for high-energy and high-power applications. The simplicity of the model allows one to use it as an alternative of complex and time consuming models especially in large time and length scales studies. The final chapter summarizes the conclusions of this research project. In addition, the perspectives of the project are described and subsequent objectives are briefly proposed for future works.
9
2. State of the art
There have been many studies on LIBs to analyze various problems such as underutilization, capacity fade, lower energy density, thermal runaway, etc. To address these issues, various experimental and computational studies have been done in different time and length scales. The first part of following section focuses on models introduced to simulate the performance of LIBs. Pseudo-two-dimensional (P2D) model and single particle model (SPM) are explained as they are the most popular electrochemical models. The second part of this chapter reviews PE studies. The methodology of PE used in this project is finally presented.
2.1 Lithium-ion batteries modeling
There are different categories for LIB modeling including empirical models, electrochemical engineering models, multiphysics models, and molecular/atomistic models.
Empirical models [4, 5] apply various functions such as polynomial, exponential, power law, logarithmic, etc. to fit experimental data. Ignoring physicochemical principles, empirical models provide fast responses and predict the future behavior of lithium-ion batteries based on historical data. Although they are easy to implement, they only work inside a specific set of operating conditions. Therefore, their predictions can be very poor when estimating other battery operating conditions.
Electrochemical engineering models provide, on the other hand, predictions that are more precise at the cost of higher complexity and longer computation time. These models incorporate chemical/electrochemical kinetics and transport phenomena and their predictions are valid inside a wide range of operating conditions. They are divided into different sub-models such as single particle models (SPM), ohmic-porous electrode models and pseudo-two-dimensional models (P2D).
Developed by Atlung et al. [6] and later expanded by Haran et al. [7], SPM is the most simplified electrochemical engineering model. It ignores the local concentration and potential in the solution phase. More precisely, the most important assumption in the SPM is about the uniform current distribution along the thickness of the porous electrodes, which results to treat the porous electrodes as a large number of single particles, all of which are subjected to the same conditions. SPMs are applicable for low applied current densities, thin electrodes, and highly conductive electrodes [8], where the overpotential is only affected by the diffusion [9, 10].
Ohmic porous-electrode models, which are more complex that SPM, consider the potential in both solid and electrolyte phases. Additional phenomena can be addressed by virtue of these
10
models, such as considering the conductivities as a function of the porosity [11]. Such a model has been used to design the separator and electrode thicknesses [12-14]. However, these models neglect the spatial variation in the concentration of Li+; a similar assumption is done in SPMs.
As the most comprehensive electrochemical model, pseudo-two-dimensional (P2D) models are developed based on the concentrated solution theory. When compared to ohmic porous-electrode models, predictability was improved in P2D models by considering the diffusion in electrolyte and solid phases as well as a Butler-Volmer kinetics at both electrodes. P2D models solve the electrolyte concentration, electrolyte potential, solid-state potential, and solid-state concentration within the porous electrodes. It also solves the electrolyte concentration and potential within the separator. Similar models have been developed based on the P2D model [10, 15-22].
Combining the electrochemical behavior of batteries with other aspects of these systems such as thermal and mechanical features leads to another category of LIB modeling, called multiphysics models. Among different multiphysics models, thermal modeling includes Joule heating effects into one of the electrochemical engineering models while the stress-strain models consider expansion and contraction due to the intercalation/deintercalation of lithium into/from the electrode active material.
At smaller time and length scales, the molecular/atomic models are introduced using a stochastic approach to simulate the diffusion of lithium from site to site within an active particle [23-25].
2.1.1 Pseudo-two-dimensional (P2D) model
The equations required to simulate the electrochemical performance of porous electrodes with concentrated electrolytes are based on the porous electrode and concentrated solution theories. The basis of these theories has been reviewed by Newman and Tiedemann [26]. In the porous electrode theory, instead of taking into account the exact position and shapes of all particles and pores, properties are averaged over a control volume big enough with respect to the pores so as to use continuity equations, but small enough with respect to the overall volume of the electrode. The electrode is treated as a superposition of active material, filler, and electrolyte, and these phases coexist at every point in the model, each of with known volume fraction. Without considering the detailed pore geometry, the porous electrode is described by specific (interfacial) area, 𝑎, and volume fraction of each phase 𝜀. The electrochemical reaction at the surface becomes a homogeneous reaction because of the existence of the interface between the two phases at each point in the volume of the electrode.
11
The effective parameters, such as the effective diffusivity of electrolyte in this porous structure, 𝐷𝑒𝑓𝑓, can be calculated by
eff
D D (2.1)
Where D is the intrinsic diffusivity (bulk value) of the Li ions in the electrolyte, 𝜀 is volume fraction of the porous structure and 𝜏 is the tortuosity of active material , which is usually related to the porosity by the Bruggeman relation [27].
0.5
(2.2)
Generally, the particles of the active material can be treated as spheres. The interfacial area (𝑎) is equal to the surface area of each sphere times the number of spheres per unit volume (𝑁𝑝):
4 2
p
aN R (2.3)
The volume fraction occupied by the solid material (𝜀𝑠) is equal to the volume per sphere times the number of spheres per unit volume:
4 3 3
p
N R
(2.4)
Eliminating 𝑁𝑝, the interfacial area can be solved from known quantities like volume fraction of solid material and particle radius:
3 /
i i i
a R (2.5)
Where 𝑖 = 𝑝 , 𝑛 as positive and negative electrode respectively.
P2D model consists of a set of six equations, to be solved for the following variables [28]:
1
Solid Phase Potential
2
Solution Potential
c Lithium ion concentration in the solution
s
c Lithium concentration in the electrode at the electrode/electrolyte interface
n
i Reaction rate
2
12
As mentioned earlier, the focus of this project is on SPM, inside which the potential and concentration of Li+ in the solution are assumed as constants. Therefore, only two variables, the
reaction rate and concentration of ions inside the solid phase, and the corresponding equations that need to be solved in the SPM, will be explained here.
2.1.1.1 Reaction rate
The dependency of the local electrochemical reaction rate on the concentration and potential is usually determined by the Butler-Volmer rate equation:
1 2
1 2
0 a c n F U F U i i exp exp RT RT (2.6)The surface overpotential, 𝜙1− 𝜙2− 𝑈, is the deviation from the thermodynamic potential difference between the solid and the solution at the existing surface concentrations. 𝑈 is the open-circuit potential of the solid material evaluated at the surface concentration (a function of intercalant concentration). The 𝛼𝑎, 𝛼𝑐 are the anodic and cathodic transfer coefficients, respectively. The exchange current density, 𝑖0, is the reference current for the system based on
kinetics of the reaction. It is a function of the lithium concentrations in electrolyte and solid active materials, i.e:
0 , , , a a c a a a c s max s e s e i F K K c c c c (2.7)Where 𝑐 and 𝑐𝑠 are the volume-averaged lithium concentration in the electrolyte and solid
phases, respectively, 𝑐𝑠,𝑒 is the area-averaged solid-state lithium concentration at the electrode/electrolyte interface, and 𝑐𝑠,𝑚𝑎𝑥 is the maximum concentration of lithium in the solid
phase. 𝐾𝑎 and 𝐾𝑐 are the rate constants for the anodic and cathodic directions of a reaction, respectively.
2.1.1.2 Transport in the solid
The porous electrode is approximated as a collection of evenly sized spheres. Neglecting the effects of stress, anisotropic diffusion and volume changes in the solid and assuming a good electrical conductivity of active material as well, the transport of lithium ions can be described by the Fick’s law in spherical coordinates:
2 2 1 s s s c c D r t r r r (2.8)
13 With the boundary conditions:
0 0 s s Li r r R c c and D j r r (2.9)
And with the following initial condition:
0,
0s s
c t r c (2.10)
Where 𝑗𝐿𝑖+ is the flux of lithium at the particle surface due to the electrochemical reaction and
𝐷𝑠 is the diffusion coefficient. The boundary condition at the interface of solid particles and electrolyte is responsible for the coupling between the electrochemical reaction rate and the mass balance in the solid.
2.1.2 Single particle model (SPM)
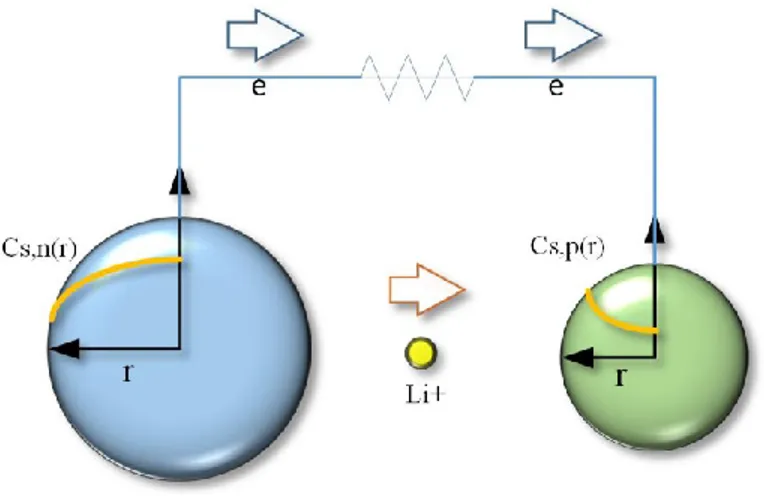
Aiming to simplify the P2D model, the single particle model (SPM) has been introduced based on two main assumptions: First, a uniform current distribution is assumed along the thickness of the porous electrode. Second, the electrolyte potential and concentration are supposed to be constant. These assumptions allow representing the entire porous electrode by a single intercalation particle [8]. Figure 2.1 demonstrates SPM for the discharge process schematically.
14
In SPM, the material balance for the lithium ions inside the electrode active material can be represented by the Fick’s law in spherical coordinates (Eq. 2.8). Like in P2D model, the Butler-Volmer kinetics equation (Eq. 2.6) is also representing the reaction rate.
The molar flux of lithium ions in SPM is related to the total current I passing through the cell:
j j I J FS (2.11)
Where 𝐹 is Faraday’s constant and S is the total electroactive surface area of electrode j 𝑗 3 j j j j V S R (2.12)
Where j is the volume fraction of the solid phase active material in electrode 𝑗 and 𝑉𝑗 is the
total volume of that electrode.
Simplicity and minimum computational requirements make SPM a good candidate for time-consuming studies such as life modeling [29, 30] and where a fast response is needed such as online estimation [10]. It is also more facile to implement some modifications in SPM. For example, Safari et al. [31] assumed four groups of particles with different connectivities to the matrix to address the resistive-reactant feature of LFP as the positive active material. Adding electrolyte concentration [32] and potential [33] inside SPM model improves the results for higher rates of charge or discharge simulations.
2.2 Parameter estimation (PE)
Electrochemical models need known parameters to simulate the behavior of the cells. The number of these parameters reflects the complexity of the model. PE is an applicable tool to find the parameters that are difficult to measure or to extract from experiments. Here, some studies using PE are summarized and the methodology for this technique is later described.
In 2007, Santhanagopalan et al. [34] performed a PE to estimate internal parameters of a lithium cobalt oxide/carbon (MCMB) cell. These parameters were the diffusivity of Li+ ions in the
positive electrode (Ds,p), the reaction rate constants at the electrodes/electrolyte interfaces (Kn
and Kp) and the initial State Of Charge of negative and positive electrodes (SOCn,0 and SOCp,0).
15
rates (<1C). However, the P2D model provides accurate results for the charge/discharge rates up to 2C at the cost of longer simulation times.
An interesting application for PE is to study the variation of influential parameters during the life of batteries. PE finds the parameters value by analyzing the experimental data after a determined period or cycle numbers in specific working conditions. Then, these parameters are introduced as functions of time or/and cycle numbers. Using an appropriate model, which is a representative of the behavior of batteries, this methodology can even help to determine and understand the origin of aging in particular conditions.
With the aim of quantifying the capacity fade of a MCMB/LiCoO2 battery, Santhanagopalan et al. [35] estimated some significant parameters of the cell including the SOC of the negative and
positive electrodes (SOCn,0 and SOCp,0) and the active material loading of electrodes (wp and
wn). They studied the loss of active material and the loss of cyclable lithium under different
temperature conditions.
In 2011, Ramadesigan et al. [36] applied a PE with a simplified P2D model to clarify the changes in significant parameters as the cell is aged. The estimated parameters in this work were the effective diffusion coefficient of lithium ion in the solution phase (𝐷), effective diffusion coefficient of lithium in the solid phase for the negative and positive electrodes (𝐷𝑠𝑛and 𝐷𝑠𝑝), and the electrochemical reaction rate constants for the negative and positive electrodes (𝑘𝑛 and
𝑘𝑝). Monotonic reduction of the effective solid-phase diffusion coefficient and of the electrochemical reaction rate constant at the negative electrode with cycle number illustrated the influence of negative electrode properties on the aging of battery. Ramadesigan et al. were able to extrapolate the change in those parameters with cycle number to predict the capacity fade.
In 2013, Marcicki et al. [37] introduced a modified SPM considering concentration and potential dynamics of the liquid phase. They estimated the electrochemical parameters and their Arrhenius temperature dependence in various steps. First, the active material volume fractions and utilization windows were estimated from OCP data. In the next step, the resistance parameters were determined, and finally diffusion parameters related to the model were extracted. They also included a time-variable resistance to capture the resistive-reactant feature of LFP positive electrode material.
Utilizing multi-objective genetic algorithm, Zhang et al. [38] identified the parameters of LiCoO2 and LiFePO4 Li-ion batteries. Considering the experimental results obtained at two
16
voltage and surface temperature to estimate 25 parameters. A good agreement was achieved between the experimental data and the simulated results in low discharge rates.
PE studies differ in terms of the optimizers used to minimize the error between experimental data and simulated results and of the direct models implemented inside the resolution of the inverse problem. Some well-known optimizers in Li-ion battery parameterizations are Levenberg-Marquardt method [34, 35], Genetic Algorithm [38-40], Homotopy optimization method [41], and Particle Swarm optimization [42]. In regards of the direct model, most of the studies use a simplified/reduced P2D model or a modified SPM [36, 37, 41, 42]. In fact, the complexity of the resolution process and the accuracy needed for PE demand the use of a simple yet reliable model. In the first part of this study, a modified SPM was implemented to simulate the behaviour of Li ion batteries with different cathode materials. The resistivity of the electrolyte is considered by virtue of a time and current varying resistance. Moreover, as one of the most suitable optimizer, Genetic Algorithm was applied to perform PE. In the following, the important features about PE are summarized.
2.2.1 Parameter estimation process
In general, PE is an inverse problem in which the unknown parameters are estimated by means of comparisons between the experimental data and simulated results (see Figure 1.5). The difference between the experiments and predictions becomes the objective function. An optimizer is used as a mathematical tool to minimize the objective function and to compute the vector of parameters, which are the output of a PE study.
The experimental data in Li-ion battery parameterization is most of the time the values of the terminal voltage extracted from charge/discharge process in N time intervals from zero to cutoff time (tc) as shown in Eq. (2.13)
* 1 * * 2 1 2 * 1 , ,..., , 0 cell N N N V V t t t t c V t V (2.13)
Typically, the objective function (S) is defined as the ordinary least-squares function of the measured data (Vcell* ) and the calculated values (Vcell) [43]:
17
*
*
*
2 , , 1 N Tcell cell cell cell cell i cell i i
S V V
V V P V V P
P (2.14)The superscript T indicates the transpose. When the experimental data are collected from M charge/discharge processes, the objective function becomes:
2 * * * , 1 1 , M N Tcell cell cell cell cell i m n
S V Vcell i
V V P V V P
P (2.15)The vector of parameters, P, is a set of required parameters such as diffusion coefficients, initial SOC, reaction rates and porosity of electrode. This vector is estimated by minimizing the objective function in the following conditions:
minSS P subject to Pj low, Pj,1Pj high, (2.16) Pj,low and Pj,high are the minimum and maximum of the Pj values respectively.
Choosing an appropriate optimizer is important in PE studies. High number of parameters rise the risk of finding local minimum instead of determining a global one. It is worth noting that the optimizer types can be divided in two categories: 1- deterministic and 2- stochastic methods. Both categories have their positive points and drawbacks. Deterministic methods are faster than stochastic ones. However, they are more complex to implement and the risk of finding local extremum is higher in these methods. Stochastic techniques, on the other hand, are the better candidates for PE of a system with numerous unknown parameters because of their random-based operation functions [44].
To increase the speed of optimization, especially when one of the stochastic method is used, sensitivity analysis is an effective technique to be used in a preliminary step to increase the performance of the method. It helps to detect the most influential parameters and the best time domains for their estimation. Recently, Jokar et al. [40] performed sensitivity analyses to evaluate the parameters of a SPM representing graphite/LiCoO2 Li-ion battery. Implementing a
GA optimizer, they estimated 10 parameters of a simplified P2D model. The unknown parameters include the solid diffusion coefficients (Ds,n and Ds,p), the
intercalation/deintercalation reaction-rate constants (Kn and Kp), the initial SOC (SOCn,0 and
SOCp,0), the electroactive surface areas (Sn and Sp) and two unknown variables used in the
formulation of the electrolyte potential drop function. In addition, they performed six scenarios to illustrate the improvements achieved with the use of a sensitivity analysis and their special methodology. In general, the sensitivity or the Jacobian matrix (J) is the first order partial
18
derivatives of the calculated cell potential (Vcell P ) with the respect to the unknown parameters
(Pj):
cellT T j j V J P P (2.17)The Jacobian value for each parameter changes with the discharge time and discharge rate. Therefore, it is possible to find the period and the rate when the voltage of the cell is more sensitive to a specific parameter.
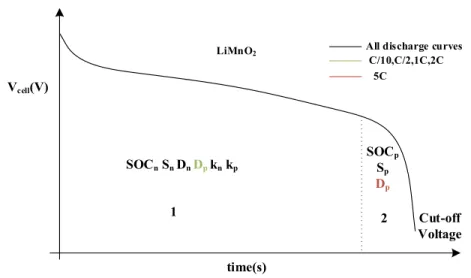
Jokar et al. [40] divided the galvanostatic discharge curves of a graphite/LCO battery into three distinct regions (Figure 2.2): 1. the beginning of discharge curve; 2. the discharge cell voltage plateau; and 3. the end of discharge process.
Figure 2.2: Different time domains for estimating electrochemical parameters
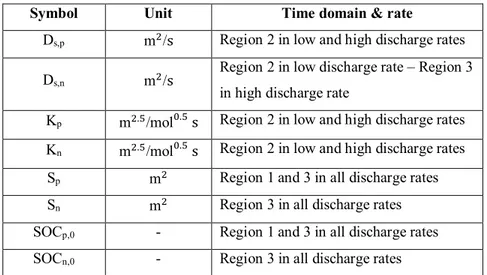
According to their sensitivity analysis, Jokar et al. [40] allocated each region to estimate particular parameters. Table 2.1 summarizes the outcomes of their study.
To validate their methodology, Jokar et al. [40] used reference data generated from a P2D model available in COMSOL® Multiphysics V. 5.1. To make the data even more close to reality, they
19
Table 2.1: Best time domains for PE of different electrochemical parameters of a graphite/LCO cell Symbol Unit Time domain & rate
Ds,p m2/s Region 2 in low and high discharge rates
Ds,n m2/s
Region 2 in low discharge rate – Region 3 in high discharge rate
Kp m2.5/mol0.5 s Region 2 in low and high discharge rates
Kn m2.5/mol0.5 s Region 2 in low and high discharge rates
Sp m2 Region 1 and 3 in all discharge rates
Sn m2 Region 3 in all discharge rates
SOCp,0 - Region 1 and 3 in all discharge rates
SOCn,0 - Region 3 in all discharge rates
The methodology introduced by Jokar et al. [40] was later verified by Rajabloo et al. [45] and applied to various cathode positive electrode active materials. The next chapter deals with implementation of PE process for LiCoO2, LiMn2O4 and LiFePO4.
20
CHAPITRE 3 : AVANT-PROPOS
Auteurs et affiliation:
Barzin Rajabloo: étudiant au doctorat, Université de Sherbrooke, Faculté de génie, Département de génie chimique et de génie biotechnologique.
Ali Jokar: étudiant au doctorat, Université de Sherbrooke, Faculté de génie, Département de génie chimique et de génie biotechnologique.
Martin Désilets: professeur, Université de Sherbrooke, Faculté de génie, Département de génie chimique et de génie biotechnologique.
Marcel Lacroix: professeur, Université de Sherbrooke, Faculté de génie, Département de génie mécanique.
Date d’acceptation: 10 Décembre 2016 État de l’acceptation: version finale publiée Revue: Journal of The Electrochemical Society Référence: [45]
Titre français: Méthode inverse pour l’estimation de paramètres électrochimiques de piles au
Li-ion. Partie II : Mise en œuvre.
Contribution au document: Cet article démontre la performance d’une nouvelle méthode
d’identification de paramètres de modèles électrochimiques représentant le comportement de piles au Li-ion. La méthode est appliquée avec succès à 3 types de piles différentes ce qui prouve la validité du modèle simplifié et de la méthode inverse.
Résumé français : Cet article est la deuxième partie d’une étude portant sur l’estimation de
paramètres de piles au Li-ion. La méthodologie avait été développée au préalable dans la partie I. Dans la partie II, la méthodologie est testée pour trois piles utilisant des matériaux d’électrodes positives différents : LiCoO2, LiMn2O4 et LiFePO4. Une méthode inverse combinée à une
version simplifiée du modèle P2D est utilisée pour identifier les paramètres électrochimiques suivants : Coefficients de diffusion (Ds,n and Ds,p), constantes de réaction d’intercalation /
désintercalation (Kn and Kp), état de charge initial (SOCn,0 and SOCp,0) et les surfaces
21
des condition de décharge lentes et rapides ont été utilisées comme données de référence au sein de la fonction objective de la méthode inverse en utilisant le meilleur intervalle de temps, celui identifié dans l’étude de sensibilité. Pour tous les cas simulés, les prédictions numériques représentent de façon fidèle les données expérimentales.
22
3. An inverse method for estimating the
electrochemical parameters of lithium-ion
batteries, Part II: Implementation
3.1 Abstract
This paper is the second part of a two part study on parameter estimation of Li-ion batteries. The methodology was developed in Part I. In Part II, the methodology is tested for LiCoO2,
LiMn2O4 and LiFePO4 positive electrode materials. An inverse method combined to a simplified
version of the Pseudo-two-Dimensional (P2D) model is used to identify the solid diffusion coefficients (Ds,n and Ds,p), the intercalation/deintercalation reaction-rate constants (Kn and Kp),
the initial SOC (SOCn,0 and SOCp,0), and the electroactive surface areas (Sn and Sp) of Li-ion
batteries. Experimental cell potentials for both low and high discharge rates provide the reference data for minimizing the objective function in the best time interval. For all cases simulated, the numerical predictions show excellent agreement with the experimental data.
Keywords: Parameter estimation; Inverse method; Li-ion battery; Simplified P2D model;
Sensitivity analysis, Genetic Algorithm (GA); LFP
3.2 Introduction
Lithium-ion (Li-ion) batteries are increasingly employed for energy storage. Their working voltage and energy density are higher than those of similar energy storage technologies. Their service life is longer. They exhibit high energy-to-weight ratios and low self-discharge. As a result, they have become the preferred energy storage devices in the electronics and the automotive industries.
Mathematical modeling of Li-ion batteries is an essential engineering tool for their design and operation. Two different approaches are usually adopted to predict their behavior. These approaches may be divided, broadly speaking, into empirical models and electrochemical models.
Empirical models are the simplest mathematical models. They are relatively easy to implement and they provide fast responses. This is why they are mostly suited for control systems used in the high tech industry and in the automotive industry. The scope of applications of empirical models is however narrow. Empirical models ignore the physical phenomena that take place in the cell. Consequently, they cannot predict the life and the capacity fading of the battery. Furthermore, they are only valid for the battery for which they have been developed [46-48].
23
Electrochemical models provide, on the other hand, reliable responses of the battery under a wide range of operating conditions and for different applications. They account for the chemical/electrochemical kinetics and the transport phenomena. Electrochemical models are unequivocally superior to empirical models. But they are also more complex and require longer computation times.
Among the electrochemical models, the Pseudo-two-Dimensional (P2D) model stands out. The P2D model rests on the porous electrode theory, the concentrated solution theory and the use of appropriate kinetics equations [4-6]. A simplified and computationally efficient version of the P2D model is the Single Particle Model (SPM). In the SPM, it is assumed that the current distribution along the thickness of the porous electrode remains uniform and that the electrolyte properties are constant [11, 50].
Both empirical and electrochemical models need to be calibrated in order to simulate faithfully the Li-ion cells. Moreover, due to their complexity, electrochemical models require extensive data such as the chemical/electrochemical parameters and the physical properties of the battery. Some of these parameters are readily available. They are provided by the manufacturer or can be determined experimentally. Others like the mass transport properties, the charge transfer and the kinetics parameters are more difficult to determine. This is the case of internal parameters such as the diffusivity of Li+ ions in the electrodes (D
s,n and Ds,p), the reaction rate constants at
the electrodes/electrolyte interface (Kn and Kp), the initial State Of Charge of the electrodes
(SOCn,0 and SOCp,0) and the volume fraction of active material in the electrodes (εn and εp), etc
[34-39,42 , 51]. In this case, the collected experimental data must be processed with optimization methods in order to reveal unknown parameters and properties. A literature review of the methods applied to Li-ion batteries, i.e., the Parameter Estimation methods (PE), is provided in the first part of this study [40]. An innovative inverse PE method for identifying the electrochemical parameters of Li-ion batteries was also proposed in Part I. This inverse PE method rests on a simplified version of the P2D model combined with an inverse method and sensitivity curves of the expected parameters. The PE method may predict the solid diffusion coefficients (Ds,n and Ds,p), the intercalation/deintercalation reaction-rate constants (Kn and Kp),
the initial SOC (SOCn,0 and SOCp,0), and the electroactive surface areas (Sn and Sp) of the
Li-ion battery. A Genetic Algorithm (GA) is used to minimize the objective functLi-ion. The results displayed in Part I show good agreement between the predicted discharge curves and the noisy reference data at both low and high discharge rates.
The present paper follows Part I by verifying the proposed methodology for Li-ion cells made of different active cathode materials. The noisy reference data that were generated with the P2D model and used for validating the PE model in Part I are now substituted with actual experimental data. These data come from Li-ion batteries made of different positive electrode materials: LiCoO2 (LCO), LiMn2O4 (LMO) and LiFePO4 (LFP).
24
In the following section, the simplified P2D model, introduced in starting of paper, is reviewed. Next, the Parameter Estimation method is presented. The reference data and the expected parameters are discussed afterward. Sensitivity analysis section focuses on the sensitivity analysis of the Li-ion batteries. The features of the LFP and the challenges of simulating this positive electrode active material are discussed in Results and discussion section. Finally, the PE results are presented in Conclusion section.
3.3 Direct model
Empirical and electrochemical models are the preferred approaches for simulating the State of Charge (SOC) and the State of Health (SOH) of Li-ion batteries [11, 46, 52].
Empirical models rely on polynomial, exponential, power law, logarithmic, and trigonometric functions to match the experimental data. These models are simple and computationally inexpensive. They are however solely applicable to the battery for which they were calibrated. As a result, the scope of applications of empirical models is limited [4, 5].
Electrochemical models are, on the other hand, unquestionably superior to empirical models for predicting the behavior of Li-ion batteries. These models take into account the chemical/electrochemical kinetics and the transport phenomena that take place into the battery. But their complexity may be a drawback. They are also CPU time consuming.
The P2D model is a popular electrochemical model [6]. The P2D model considers both the diffusion and the potential in the solid and in the electrolyte phases. The kinetics is described by the Butler-Volmer expression. The P2D model solves the electrolyte concentration, the electrolyte potential, the solid-state potential, and the solid-state concentration within the porous electrodes. It also predicts the electrolyte concentration and the electrolyte potential within the separator. The transport phenomena, the electrochemistry, and the thermodynamics are portrayed by coupled nonlinear partial differential equations (PDEs) in space and time [15-21, 28, 50].
Most P2D models are, however, elaborate and CPU time consuming. A simplified version of the P2D model is the SPM, which was developed by Atlung et al. [6] and later improved by Haran et al. [7] The SPM accounts for a lumped solution resistance and it ignores the local concentration and potential in the solution phase. It also assumes that the current distribution along the thickness of the porous electrode is uniform. As a conclusion, each electrode is modeled as one spherical particle. Intercalation and de-intercalation phenomena happens through a reaction at the surface and a diffusion inside spherical particle. It should be noted that assuming uniform current distribution and ignoring concentration and potential in the solution
25
phase are not always possible. As a result, the SPM is most suitable for simulating Li-ion batteries with thin and highly conductive electrodes subjected to low current densities [8]. As a compromise between the simplicity of the SPM model and the accuracy of P2D models, a simplified version of the P2D model was introduced in Part I. It rests on the following equations:
2 2 2 0 1 2 4 4 2 2 ln ln 2 2 ... p p n n cell p n m m m m RT RT I V U U F F a a It a It (3.1) where
, 0.5 0.5 max max 0.5 , , 3 ; , 1 surf p p s p p p p s p p p s p e p p V c I m S SOC R c FK S c c SOC SOC p (3.2) , max 0.5 0.5 0.5 max , , 3 ; , 1 surf s n n n n n n n n s n e n n s n c V I m S SOC R FK S c c SOC SOC n c (3.3) 2 , , 2 2 2 1 1 23 exp ;sin cos 0
,0 max 5 , , s k s k k k k k k k k k D D J Rk k SOCk SOCk t t R R cs k Ds k (3.4)
SPM differs to simplified P2D model in last term of potential equation (Eq.1) where a lump solution resistance has been replaced by a varying resistance as a function of capacity. The derivation of the potential equation is explained in paper Part I.
The potential equation is applied in the PE process for which the electrochemical parameters and the unknown variables of the electrolyte potential drop function are estimated.
The proposed simplified P2D model improves the results of the SPM particularly at high C-rate charge/discharge. Moreover, the number of parameters needed for the simplified P2D model is less than that for the P2D model. As a result, the proposed simplified P2D model is befitting online simulation and optimization.
3.4 The parameter estimation process
Inverse problems belong to a class of ill-posed mathematical problems. Their solution is strongly dependent on the initial conditions, on the boundary conditions and on the measured signals. This makes the solution of inverse problems more challenging than that of direct problems.
26
In PE problems, the unknown parameters of a system can be determined with an inverse method. Of course, the parameters should be measurable and identifiable. Figure 3.1 depicts a schematic of the PE procedure [40]. Direct Model Objective Function f=f(Y-Y*) Experimental Data + -Optimization Process Y Y* Input Parameters Feedback System’s Parameters
Figure 3.1: Solution procedure for inverse problems [40]
The objective function for the identification of the Li-ion parameters is defined as the difference between the experimental data for the time-varying cell potential and the numerical predictions generated by the direct model.
The vector of experimental data (Vcell* ) is comprised of N time intervals between zero and the cut-off time (0 < 𝑡 ≤ 𝑡𝑐). It is expressed as
* 1 * * 2 1 2 * 1 ; , ,..., cell N N N V V t t t t V V (3.5)
The objective function (S) is defined as the ordinary least-square function of the experimental data (Vcell* ) and the numerical predictions (Vcell) [43] for one charge or discharge cycle:
*
*
*
2 , , 1 N Tcell cell cell cell cell i cell i i
S V V
V V P V V P
![Figure 1.1: Ragone plot for different secondary batteries [1]](https://thumb-eu.123doks.com/thumbv2/123doknet/3115254.88471/14.918.226.710.364.661/figure-ragone-plot-different-secondary-batteries.webp)
![Figure 1.2: Different types of lithium secondary batteries based on their shape: (a) cylindrical, (b) coin, (c) prismatic and (d) pouch [2]](https://thumb-eu.123doks.com/thumbv2/123doknet/3115254.88471/15.918.186.758.105.450/figure-different-types-lithium-secondary-batteries-cylindrical-prismatic.webp)
![Figure 3.1: Solution procedure for inverse problems [40]](https://thumb-eu.123doks.com/thumbv2/123doknet/3115254.88471/39.918.170.773.204.388/figure-solution-procedure-inverse-problems.webp)