Science Arts & Métiers (SAM)
is an open access repository that collects the work of Arts et Métiers Institute of
Technology researchers and makes it freely available over the web where possible.
This is an author-deposited version published in: https://sam.ensam.eu
Handle ID: .http://hdl.handle.net/10985/10307
To cite this version :
Amine MEHEL, Céline GABILLET, Henda DJERIDI - Bubble effect on the structures of weakly turbulent couette taylor flow - Journal of Fluids Engineering - Vol. 128, p.1-14 - 2006
BUBBLE EFFECT ON THE STRUCTURES OF WEAKLY TURBULENT COUETTE TAYLOR FLOW
Amine MehelResearch Institute of French Naval Academy (IRENav) Ecole Navale BP 600
29240 BREST ARMEE, France
Celine Gabillet
Research Institute of French Naval Academy (IRENav) Ecole Navale BP 600
29240 BREST ARMEE, France
Henda Djeridi
Research Institute of French Naval Academy (IRENav) Ecole Navale BP 600
29240 BREST ARMEE, France
ABSTRACT
In industrial applications, rotating flows have been recognized to enhance mixing and transfer properties. Moreover, bubbly flows are also used to improve transfers. Therefore, it is interesting to study the effects of the dispersed phase on the structure of a Couette Taylor flow. Experiments are conducted for the quasi-periodic (Ta=780) and the weakly turbulent (Ta=1000) flow regimes. Bubbles (0.035 times as small as the gap) are generated by agitation of the upper free surface (ventilated flow). Larger bubbles (0.15 times as small as the gap) are generated by injection at the bottom of the apparatus and by applying a pressure drop (gaseous-cavitating flow). Void fraction, bubble size and velocity, as well as axial and azimuthal velocity components of the liquid are investigated. The bubble location in the gap clearly depends on the bubble size. For α>0.1%, there is evidence of bubble induced modifications of axial transfers and wall shear stress, the observed trends being different according to the bubble location in the gap.
INTRODUCTION
Flows induced by rotation of the inner of two concentric cylinders are the basis of numerous chemical, biomedical and nuclear applications. Because of the presence of Taylor vortices, the mixing is enhanced and depends on the quality of the exchange between these vortices. This particular flow is also relevant for phase separation technology. Indeed, because of the centrifugal effect, any foreign material, solid or gas, will be ejected towards the outer or inner part of the vortices respectively.
It is then necessary to investigate how a gas-liquid bubbly flow behaves in a concentric annulus whose shearing force is induced by the rotation of the inner cylinder, for various flow
regimes from laminar to turbulent flow, according to the Taylor number Ta.
Shiomi et al. [1] analysed the bubbles arrangement in a turbulent Couette Taylor flow for 3000<Ta<25000. The bubbly flow was obtained by injection of a gas liquid mixture (bubbles size equal to 1/5 of the gap) at the bottom of the apparatus. According to respective gas-liquid axial volumetric fluxes, they observe different flow patterns: dispersed bubbly flow, ring form and spiral flow. Atkhen et al. [2] also conducted experiment in a two phase air-water turbulent Couette Taylor with a superimposed axial flux. In this experiment, for 2000<Ta<13000, bubbles were generated by the agitation of the upper free surface (ventilation). Authors observed that air bubbles remained in the outflow regions near the inner cylinder and behave as tracers of the flow. For very high Taylor number the axial wave length is reduced by 20% owing to the axial flux. For lower Taylor numbers in the wavy vortex flow regime (86<Ta<200), Djeridi et al. [3] conducted experiments in a bubbly Couette Taylor flow without superimposed axial flux. Bubbles were generated by ventilation and size was approximately 1/5 of the gap. For this flow regime, air bubbles generated by the overturning breaking waves at the free surface, are driven from the upper to the deepest vortices and captured by the Taylor vortices. There is no significant effect of the bubbles on the liquid flow patterns. For this particular state of the flow, Djeridi et al. [4] obtained similar results with vapor bubbles generated in the core of the Taylor vortices by decreasing the pressure (cavitation). But for larger Taylor numbers (320<Ta<600) in the wavy vortex flow and in the modulated wavy vortex flow, for bubbles of the same size, authors observed a change in bubble arrangement. Bubbles were located in the outflow regions, near the inner cylinder wall. These particular bubble locations are expected to be responsible for observed modifications in the primary instabilities. Indeed, ventilation and cavitation lead to a significant growth in the axial wave length (45 % and 25 %
respectively) and a premature change in the second instability’s wave number.
This non exhaustive overview shows the discrepancy with the previous results according to the regime of the Couette Taylor flow. This gives rise to the following questions: do the bubble induced effects depend on the bubble size and their localization in the gap rather than on the flow regime? To furnish some elements of response and complete a general background, experiments were conducted in a bubbly Couette Taylor flow for different bubble size and for unstudied flow regimes. Bubbles of different size are generated either by ventilation or by injection and pressure drop (gaseous-cavitation). Experiments were conducted at Ta=780 and Ta=1000, corresponding to quasi-periodic and weakly turbulent flows. In these conditions, what does the bubble arrangement looks like and are there any effects of the bubble on the flow patterns? Particular attention is paid to the transition between the two regimes studied. To have a good insight into the bubbly flow patterns, it is necessary to quantify locally the void fraction, bubble size and velocity. Consequently, a large experimental apparatus was especially built, in order to introduce optical probes. Detailed information about the liquid flow properties is given by LDV measurements and visualizations. To our knowledge, here are the first measurements of the dispersed phase characteristics achieved in a bubbly Couette Taylor flow.
Bubble induced effects are evident from comparison between the single phase flow and bubbly flow patterns. The present paper is organized as follows: The experimental setup and measuring technics are firstly described. Results concerning the dispersed phase are then presented for the ventilated and gaseous-cavitating flows respectively and discussed afterwards. An overview of the liquid flow properties is then given for ventilated and gaseous-cavitation conditions respectively. Bubble induced effects are then discussed according to the bubble size, by comparing the ventilated and gaseous-cavitating flow patterns.
EXPERIMENTAL DETAILS
Apparatus
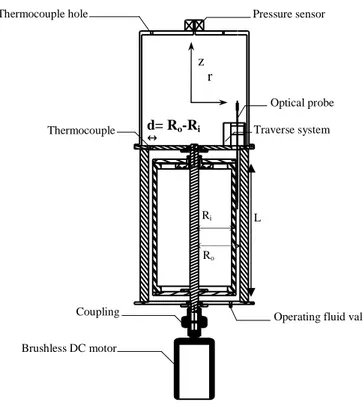
The experiments were conducted in a vertical circular Couette apparatus having an inner rotating cylinder of 200 mm radius Ri, an outer fixed cylinder of 220 mm radius Ro. The
characteristics of the apparatus are defined by the radius ratio
η= Ri/Ro=0.91, the clearance ratio d/Ri=0.1 and the aspect ratio Γ=L/d=44.3, the height of the gap L being 886 mm. The general schematic of the apparatus is given in Fig. 1. The gap is filled with a mixture of glycerol and water and the rotating angular velocity is denominated Ωi. The Taylor number
2 3 i 2 i a ν d R Ω
T = can be varied by changing the velocity of the
inner cylinder or the viscosity of the fluid ν. The relative uncertainty in the Taylor number is due to the geometric dimensions, the viscosity and the rotational velocity uncertainties. The Taylor number can be estimated with an accuracy of 0.8%. Particular attention was paid to observing the
same start up procedures and limiting the acceleration of the inner cylinder, in order to ensure the same flow state.
Figure 1: General schematic of the apparatus
In the Couette Taylor flow, the transition from laminar to turbulent flow occurs throughout a sequence of well defined instabilities. For all configurations, the critical Taylor numbers corresponding to the three first instabilities and to the weakly turbulent flow are given in Table 1.
In order to obtain a two phase Couette Taylor flow for different bubble sizes, the dispersed phase was either generated by the agitation of the free surface (submillimetric bubbles), or generated both by upward injection and pressure drop (millimetric bubbles). Due to its design, the bottom of the flow domain is a fixed wall and the top is a free surface.
For the ventilated flow, the natural ventilation is obtained with sufficiently high rotation speed Ωi =2.45 rps
corresponding to Ta = 750 for a mixture water glycerol of 80%. Bubbles are generated at the crest of the overturning breaking wave and driven into the liquid.
For the cavitating flow, a mixture of water-glycerol 65% is used in order to avoid ventilation. The averaged pressure, Pe, is decreased by using a vacuum pump and measured with a sensor of an absolute accuracy of 200 Pa. A special airtight box on the top of the apparatus was built in order to integrate the pressure sensor, optical probes and associated traverse system, necessary for the bubbly flow measurements. In the gap, a local pressure decrease is encountered both in the Taylor vortices due to vorticity and, near the inner cylinder, due to the rotation of the cylinder. Because of the height of the water column in the gap, and because the local pressure decrease for the present experimental device is not sufficient, it was not possible to Operating fluid valve Ri
Pressure sensor Thermocouple hole
Optical probe Thermocouple Traverse system
Coupling Brushless DC motor L Ro d= Ro-Ri r z ↔ ↔ ↔ ↔
obtain millimetric bubbles with cavitation of the mixture nuclei content. Therefore millimetric bubbles are injected in the middle of the gap, through a tube of diameter 200 µm and length 5 cm. This tube discharges in a cavity at the bottom of the apparatus. In this framework, it is more judicious to speak about gaseous cavitation, the sensitivity of the bubble size to the local pressure being quite insignificant (around one tenth of millimeter). Pressure drop is used here preferentially to inject bubbles through the tube and accelerate their migration from the bottom to the top of the gap. Special care was taken in order to have the same leak rate for a same Ta.
The phase arrangement and flow pattern are described in details for Ta =780 and 1000 both for the ventilated and cavitating flows. For this apparatus set up, Ta=780 corresponds to a quasi-periodic flow, whereas Ta=1000 corresponds to a weakly turbulent flow. It is therefore interesting to analyse how bubbles of different size (obtained by ventilation or gaseous-cavitation)and different localization in the flow can influence the state of the flow, in the transition to turbulence.
Critical Reynolds number
Flow regimes Flow characteristics
Typical frequencies 43.3
≤
Ta<49.6 Taylor VortexFlow (TVF) λ=2d ncells=44 49.6
≤
Ta<260 Wavy Vortex Flow (WVF) λ=2.5d m=3 to 9 ncells=35 mfo, fo for Ta>69 mfo=3.5Ωi, fo=0.39Ωi 260≤
Ta≤
700 Modulated Wavy Vortex Flow(MWVF) m= 4 λ=3.1d ncells=29 mfo=1.55Ωi, f’=0.45Ωi f’1=mfo-f’ f’2=mfo+f’ 700≤
Ta≤
850 Quasi-periodic Flow m= 4 λ=3.1d ncells=29 mfo=1.55 Ωi broadband spectrum of frequencies f’=0.44 Ωi, f’1=mfo-f’ and f’2=mfo+f’ Ta>860 to 1200 Weakly Turbulent Flow λ=3.1d ncells=29 disappearance of mfo broadband spectrum of frequency f’=0.44 Ωi Table 1: Critical Taylor numbers (λ is the axial wave length, ncellsis the number of Taylor vortices in the gap, m and f0 are the wave number and the celerity of the azimuthal wave, f’ is an incommensurable frequency)
Measurements
The main focus of this study is placed on the modification of the flow structures due to the presence of the bubbles. To compare the single phase flow patterns with those observed in the ventilated or cavitating flow, an investigation of the liquid velocity fields and characteristic frequencies is made. A two component, three beam, LDV Dantec system was used to measure azimuthal and axial velocities. The system was operated in back scattering mode and was coupled with two Dantec enhanced burst spectrum analysers. The liquid was seeded with micron size Iriodine® particles. The largest dimension of the measuring volume in the radial direction corresponded to 1/25th of the gap. Due to the refractive index variation and the geometry of the interface of the outer
cylinder, the deviation of the laser beams is systematically recalculated to determine the focal position of the measuring volume. A remote mechanical positioning system, with a minimum translation step of 10µm allowed measuring the velocity field in the (x,z) plane for a non dimensional radial position x, defined as x=r/d-(Ri+Ro)/2d. The positioning accuracy of the measuring volume in the gap is defined as 1.6 %.
Measurements in radial and axial directions of the azimuthal and axial liquid velocity components were performed for the Taylor number range Ta =750-1200. Very good visibility of the signal was achieved with a very high signal-to-noise ratio. The time histories were registered with a data rate of 2500 points per 5-35 seconds. This corresponds to a sample frequency of 70-500 Hz and is sufficient to obtain the mean and RMS values of the axial and azimuthal velocity components. The uncertainty in the measurements of the mean and RMS values is estimated to be 1%.
A spectral analysis was performed on a time series of signals using a sample and hold interpolation method before applying a fast Fourier transform algorithm. This classical post treatment is used for randomly sampled signals, to remove the difficulty caused by the non equidistant successive time stepping obtained by the LDV measurements. Spectra were performed with a maximum data rate of 300 Hz, for a measurement time of 470 seconds. The spectral resolution, ∆f, was 0.01 Hz.
A special dual fibre-optic probe was designed for this experiment by RBI industry. The immerged part of the probe is made of a bent tube of 2mm diameter. The bent part of the tube is 0.6mm large and 12 mm long. Each fibre has a cone shaped tip of 10 µm. The distance between the two tips is 1.5 mm in the azimuthal direction of the flow. The probe is connected to an electronic system providing an output voltage signal between 0 and 10V. The spatial resolution of the probe is estimated following the results of Cartelier [5]. The latency length is expected to be 420 µm. This is the critical size of the bubbles to ensure a good detection.
The sampling frequency is 20 kHz for the cavitating flow and 40 kHz for the ventilated flow. With these frequencies, the relative void fraction uncertainty is ±6% and ±12% for cavitating and ventilated conditions respectively. The mean bubble velocity in the azimuthal direction is determined with a relative accuracy of ±7% for both flows. For the cavitating flow, bubble chord length can be determined with a relative uncertainty of ±13% whereas, for the ventilated flows, bubbles are too small to have a good estimation of their chord length and size.
Bubbles were detected by using a double threshold of the output voltage. The low threshold enables to detect the beginning of the dewetting process. It is calculated by making the same additional charge on the averaged voltage, so that the passage due to bubbles could be distinguished from noise. The high threshold enables the detection of the beginning of the rewetting process. It is calculated for each bubble and corresponds to a percentage of the maximum tension observed in each bubble.
Whenever the output voltage was greater than the threshold levels, the gas characteristic function was set to 1, otherwise to 0. The characteristic transit time, ttrans, of the bubbles between
function of the two gas characteristic functions. Two interfaces were deemed to correspond to the same bubble if their time delay is found in the range [(1-c1) ttrans: (1+c2) ttrans], according
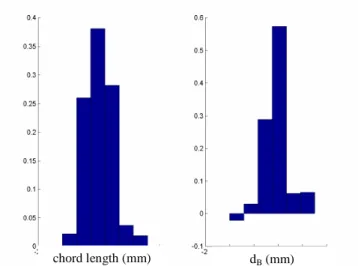
to Gabillet et al. [6]. The bubble velocity was determined for each bubble detected on both tips of the probe. The chord length of a bubble is the length of the bubble viewed by the tip and is deduced from the bubble velocity and its residence time on the upstream tip. The mean bubble velocity was deduced from the average velocity weighted by the chord length of each bubble. The chord length distribution is used to determine the bubble size distribution, following the inverse method developed by Clark and Turton [7]. Bubbles located near the walls of the apparatus can be elongated in the azimuthal direction by the shear flow, leading to ellipsoidal bubbles. In this case, the inverse method makes it possible to obtain the large axis distribution of ellipsoidal bubbles, otherwise the diameter distribution of spherical bubbles is found. As an example, the bubble distribution obtained for Ta=1000 in cavitating flow, can be seen in Fig. 2.
The measurement time (50 s, 25 s for the cavitating and ventilated conditions respectively) was limited by the number of samples that can be recorded by the data-acquisition device (1e6). For each value of void fraction and mean bubble velocity that are displayed in the figures, errors corresponding to the reproducibility of the measurement, due to the measurement time are also indicated.
The dual fibre optic probe is moved in the radial and axial directions by a mechanical traverse system of absolute accuracy ±0.3 µm. The probe can be immersed down 6 to 8 Taylor vortices under the upper free surface. For the Taylor range investigated, the effect of the intrusion of the probe on the instabilities was investigated. There is a slight increase of the axial wavelength of about 4% in the upper part of the flow, above the probe. For the lower part of the flow, there is no significant effect of intrusion of the probe, on the axial and radial mean velocities. For both parts of the flow (above and under the probe), spectra are similar with and without the intrusion of the probe. Nevertheless, the liquid flow patterns were investigated without the intrusion of the probe.
Figure 2: bubble size distribution for Ta=1000 in the vortices core (calculation is performed for 273 bubbles)
CHARACTERISTICS OF THE DISPERSED
PHASE
The arrangement of the bubbly phase in the gap obtained by vizualisation, as well as void fraction profiles are presented for ventilated and cavitating flows. The localization of the dispersed phase is obviously different according to the size of the bubble, either in ventilated flow or in cavitating flow. Physical interpretation is further given.
Characteristics of the bubbly phase in
ventilated Flow
For the ventilated flow, bubbles produced by the agitation of the free surface are driven into the gap, by “jumping” from vortex to vortex. As anticipated by Atkhen et al. [2] with a superimposed axial flow, bubbles are arranged as strings of individual spherical bubbles localized in the outflow regions near the inner cylinder. After waiting for at least 30 min, the flow reaches a steady state in which the string spacing and the void fraction do not seem to change with time. This arrangement is shown in Fig. 3 for Ta=780 and 1000.
a) b)
Figure 3: Visualization of the bubble arrangement for ventilated flow
a) Ωi =2.45 rps (Ta=780) b) Ωi=3.07 rps (Ta=1000)
The string spacing is identified as the axial wave length. As in single phase flow, the wave length is homogeneous in the gap. But it is increased in the entire gap by 5% and 7% in ventilated flow for Ta=780 and 1000 respectively, by comparison to the single phase flow.
Although the bubble size was of the same order as the resolution of the optical probe, chord length inversion enables a rough approximation. By this way, bubble mean diameter dB is
estimated to be, approximaely, 700 µm (0.035d).
Figure 4 shows the radial distribution of the void fraction measured in the outflow region for Ta=780 and Ta=1000, two wavelengths below the free surface (z/d=6.51 for Ta=780 and z/d=6.63 for Ta=1000). Measurements started at 2,5 mm (x=-0.375) from the inner cylinder’s wall, exhibit an increase in the void fraction near the inner cylinder. The void fraction obviously increases with Ωi and Ta. Indeed, ventilation is more
pronounced when increasing Ωi, leading to more bubbles
chord length (mm) dB (mm)
captured in the gap. 10 bubbles/s and 30 bubbles/s are detected in the outflow region for Ωi =2.45 and 3.07 rps respectively,
two wavelengths below the free surface. For the Ta range studied, the bubble size is quite independent of the inner cylinder’s velocity.
Figure 4: Radial profiles of void fraction for ventilated flow : Ωi =2.45 rps (Ta=780) : Ωi=3.07 rps (Ta=1000)
x=r/d-(Ri+Ro)/2d
Although there is no stratification of the axial wave length in the gap, there is obviously an axial stratification of the void fraction. This stratification was qualified in the four first strings below the free surface. It seems that the void fraction in the outflow region expands almost exponentially with the axial wave length. α
( )
iλ =Ae−ikλ approximately for both Ta with k=7 m-1. i denotes the number of the bubble string (i=1 is thestring right below the free surface).
Characteristics of the bubbly phase in
gaseous-cavitating Flow
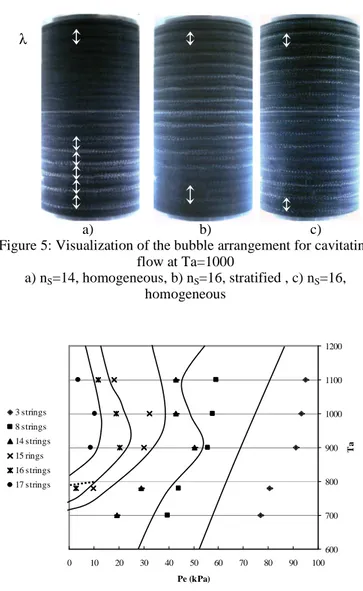
For the gaseous-cavitating flow, bubble arrangement is characterized by strings of individual bubbles partly localized in the outflow regions near the inner cylinder and partly localized in one in two Taylor vortex cores. This arrangement is shown in Fig. 5 for Ta=1000. The flow pattern is then characterized by a number of strings ns and their localization in
the gap. Notice that ns is representative of the averaged axial
wave length λ in the gap deduced from
5 . 0 n L S+ . This number of strings is observed in the outflow region. It can be seen that ns evolves with the pressure decrease as it is summarized in the
regime diagram in the coordinates (Pe, Ta) presented in Fig. 6.
a) b) c) Figure 5: Visualization of the bubble arrangement for cavitating
flow at Ta=1000 a) nS=14, homogeneous, b) nS=16, stratified , c) nS=16, homogeneous 600 700 800 900 1000 1100 1200 0 10 20 30 40 50 60 70 80 90 100 Pe (kPa) T a 3 strings 8 strings 14 strings 15 rings 16 strings 17 strings
Figure 6: Evolution of the bubble strings number in cavitating flow
When decreasing the pressure, there are more bubbles spread out into more strings. A similar trend is encountered when increasing Ta for a constant pressure.
ns=14 corresponds to the gap entirely filled by bubble strings.
Decreasing the pressure, new strings appear at the bottom of the gap and a linear stratification of the axial wave length is observed. Each new string leads to a new stratification. This organization of the flow corresponds to a particular regime called the transitional stage. At this stage, stabilizing the pressure leads to a reorganization of the flow with an homogeneous axial wave length. The duration of this reorganization is called transitional time and depends on Ta and ns.
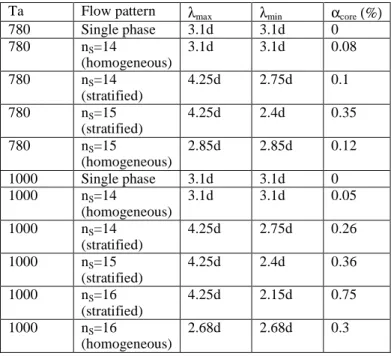
Table 2 summarizes the value of the axial wave length for different states of the bubbly flow (homogeneous and stratified). λmax and λmin represent the axial wave length
observed at the bottom and top of the gap, respectively. λmax
can reach 4.25d at the bottom of the apparatus. This value corresponds to the maximum stretching of the Taylor vortices that can be observed in turbulent flow.
0 0,2 0,4 0,6 0,8 1 1,2 1,4 1,6 1,8 2 -0,5 -0,3 -0,1 0,1 0,3 0,5 x α ( % ) α ( % ) α ( % ) α ( % ) λ
The void fraction measured in the core of a Taylor vortex in the third string below the free surface is also given in Table 2. For a given Taylor number, the void fraction increases with the increase of ns. For αcore> 0.1%, there is a change in the
length of the Taylor vortices and hence in the flow pattern. Stabilization of the flow (i.e. the disappearance of stratification) is accompanied with a decrease in void fraction.
The spatial void fraction distribution has been characterized only for ns=15 atTa=780 and ns=16 at Ta=1000
where the transitional time is sufficient to investigate the stratified flow. Radial measurements started at 2.5 mm (x=-0.375) from the inner cylinder’s wall were performed in the core of the Taylor vortex and in the outflow regions. Figures 7 and 8 display the radial distribution in the third string below the free surface, for Ta=780 and Ta=1000, respectively.
0 0,05 0,1 0,15 0,2 0,25 0,3 0,35 0,4 -0,5 -0,3 -0,1 0,1 0,3 0,5 x α ( % ) α ( % ) α ( % ) α ( % ) core, nS=15 (s tratified) outflow, ns =15 (s tratified) core, nS=15 (homogeneous ) outflow, nS=15 (homogeneous )
Figure 7: Radial profiles of void fraction for cavitating flow in the 3rd bubble stings (Ta=780)
x=r/d-(Ri+Ro)/2d 0 0,15 0,3 0,45 0,6 0,75 0,9 -0,5 -0,3 -0,1 0,1 0,3 0,5 x α ( % ) α ( % ) α ( % ) α ( % ) core, nS=16 (s tratified) outflow, nS=16 (s tratified) core, nS=16 (homogeneous ) outflow, nS=16 (homogeneous )
Figure 8: Radial profiles of void fraction for cavitating flow in the 3rd bubble stings (Ta=1000)
x=r/d-(Ri+Ro)/2d
In the core of the Taylor vortices, bubbles are rather located at about 5.6mm (x=-0.22) from the inner cylinder. In the outflow, the void fraction slightly increases near the inner cylinder. This increase is expected to be more pronounced in the region closer to the wall, where the probe is unable to take the measurements. What is surprising, is the void fraction peak observed in the outflow region for the homogeneous flow at Ta=1000 as observed in the core of the vortices. This denotes an important axial oscillation of the Taylor vortices, and bubbles captured in the core contribute to the void fraction measured in a static region, corresponding to a time-averaged outflow region. As stratification is known to inhibit movement in the same direction, the vortex axial oscillation is more pronounced in the case of homogeneous flow, than in the case of axial stratified flow.
Ta Flow pattern λmax λmin αcore (%)
780 Single phase 3.1d 3.1d 0 780 nS=14 (homogeneous) 3.1d 3.1d 0.08 780 nS=14 (stratified) 4.25d 2.75d 0.1 780 nS=15 (stratified) 4.25d 2.4d 0.35 780 nS=15 (homogeneous) 2.85d 2.85d 0.12 1000 Single phase 3.1d 3.1d 0 1000 nS=14 (homogeneous) 3.1d 3.1d 0.05 1000 nS=14 (stratified) 4.25d 2.75d 0.26 1000 nS=15 (stratified) 4.25d 2.4d 0.36 1000 nS=16 (stratified) 4.25d 2.15d 0.75 1000 nS=16 (homogeneous) 2.68d 2.68d 0.3
Table 2: Cavitating flow patterns
To investigate a possible axial stratification of the void fraction in the core of the Taylor vortices, axial measurements of the void fraction were performed in the core for the first three bubble strings below the free surface. Measurements exhibit an inverse axial stratification of the void fraction, which evolves linearly with the axial distance, the void fraction being more important at the top of the gap. The stratification is all the more important as the Taylor number increases (dα/dz=-0.1%/λ for Ta=780 and dα/dz=-0.5%/λ for Ta=1000). Axial stratification was also investigated in the outflow regions near the inner cylinder. In this region of the flow, the void fraction is maximum at the top of the gap and decreases linearly with the axial distance, the rate of expansion being four times as small as in the core of the Taylor vortices. This lets suppose that the void fraction is more important in the outflow region than in the core of the Taylor vortices at the bottom of the gap and conversely at the top of the gap. When the flow is stabilized (ie the axial wave length is homogeneous), no axial void fraction
stratification is encountered both in the vortices cores and in the outflow regions.
The bubble size can be confidently obtained in the core of the Taylor vortices. In the third string, bubble mean diameter dB
is estimated to be 3.1mm (≈0.15d). In the outflow region, bubbles are ellipsoidal bubbles. The determination of the bubble size is very biased because bubbles are localized very close to the inner cylinder wall where the probe is unable to measure. Nevertheless, the bubble size distribution can be deduced from image processing. The average large axis lθB, in
the azimutal direction, is around 6 mm (lθB≈0.3d), larger than
the bubble diameter in the core of the Taylor vortices and the average small axis lxB is around 2.6mm (lxB ≈0.13d). No
noticeable stratification of the bubble size is found for the first three bubble strings below the free surface, the expected global stratification between the bottom and the top of the gap due to hydrostatic pressure being less than one tenth of millimetre. As a summary, the bubble size is homogeneous, independent of both the Ta number and the state of the flow (stratified and homogeneous)
Discussion about the bubble arrangement in
the flow
To understand the localization of the bubbles, it is necessary to underline the role of the predominant forces acting on the bubbles.
For the ventilated flow, small bubbles (size 0.035d) are located in the outflow regions near the inner cylinder. A good explanation was given by Atkhen et al. [2] for the ventilated flow with superimposed axial flux. Indeed, if the terminal velocity of the bubbles, obtained by the equilibrium between the buoyancy and the drag force, is lower than the downward velocity fluctuation, they can be captured in the separatrix regions. If the drag due to both the radial mean and fluctuating velocities compensates the centrifugal acceleration of the flow at the separatrix, an equilibrium position can be found. This condition is realized in the outflow separatrix and not in the inflow separatrix.
As far as larger bubbles are considered, no real equilibrium position is found in the outflow separatrix, bubbles are either agglomerated near the inner cylinder in the outflow regions or captured in the core of the Taylor vortices.
Indeed, for the cavitating wavy vortex flow studied by Djeridi et al. [4], for Ta<307, bubbles are found in the Taylor vortices, with alternative distance between two bubble rings of 1.2d and 0.8d. For this particular flow, for Ta>307 or above a critical bubble size of 0.3d, equilibrium positions no longer exist in the core of the vortices. This corresponds to a migration of the bubbles towards the inner cylinder in the outflow region.
For the cavitating Couette Taylor flow presently studied, for quasi-periodic and weakly turbulent flows conditions, bubbles of mean size 0.15d are localized in one in two Taylor vortex cores. Bubbles are captured in these particular vortices, for which rotation induces lift and drag forces opposed to the buoyancy force. As expected from [2] or [4], smaller bubbles or larger bubbles are not captured by the Taylor vortices and migrate into the outflow region, near the inner cylinder.
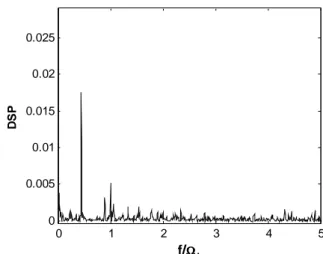
In single phase flow, at Ta=700, the modulation of frequency f’ becomes chaotic and as energetic as the azimutal wave of frequency mf0. Beyond Ta=700, for the quasi-periodic flow, the azimutal wave is expected to yield some of its energy to the chaotic modulation, until the azimutal wave switches off (Table 1) at Ta=850. It is then interesting to determine which one of the two waves, play a determinant role in the bubbles capture by the vortices. To have a better understanding, spectra of the gas characteristic function are determined in the core of the vortices. Spectra, up to 20Hz, are deduced from sub-sampling the auto-correlation of the gas characteristic function, measured with the upstream probe of the dual fibre-optic probe. The spectrum presented in fig. 9 for Ta=780 show a periodicity of the bubble arrangement at frequency f’. This gives the evidence that bubbles follow the more energetic wave of minor frequency to be captured by the vortices.
0 1 2 3 4 5 0 0.005 0.01 0.015 0.02 0.025 f/ΩΩΩΩi D S P
Figure 9: Spectrum of the gas characteristic function obtained at Ta=780 for cavitating homogeneous flow (nS=15).
CHARACTERISTICS OF THE LIQUID PHASE
To answer the above question relative to the bubbles effects on the flow pattern, LDV measurements of the liquid phase in both ventilated and cavitating flows have been performed and compared to the single phase flow.
Characteristics of the liquid phase in the
ventilated flow
For the ventilated flow, the particular localization of the bubbles near the inner cylinder in the outflow regions enables LDV measurements elsewhere in the gap. Thus, to provide an accurate velocity measurement of the liquid phase, spectra and axial profiles were investigated near the outer cylinder (x=0.25). However, to compare azimuthal velocity of bubbles and azimuthal velocity of the liquid, radial profiles must be performed in the outflow regions. Then, the contribution of the bubbles induces an error in the measurement of the liquid azimuthal velocity. This error is approximately 2%.
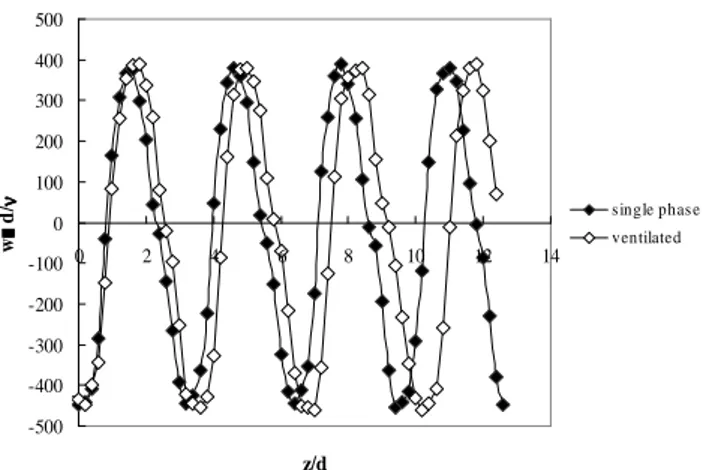
Axial profiles of the dimensionless axial velocity (wLd/ν)
are plotted in Fig. 10 for Ta=1000. Profiles confirm a slight increase of the axial wavelength for the ventilated flow, by comparison to the single phase flow, depending on the inner cylinder’s velocity and thus on the void fraction. The same value of the Taylor vortices expansion is obtained with LDV as with visualization of the gaseous phase in the gap, leading to
λ=3.26d and λ =3.32d for Ta=780 and Ta=1000 respectively, instead of 3.1d in single phase flow. Nevertheless, no significant change is found in the value of the axial velocity at x=0.25, assuming that the vorticity is slightly decreased in ventilated flow. -500 -400 -300 -200 -100 0 100 200 300 400 500 0 2 4 6 8 10 12 14 z/d w d /ν ν ν ν s ingle phas e ventilated
Figure 10: Comparison between single phase flow and ventilated flow axial profiles of axial velocity for Ωi=3.07 rps
(Ta=1000)
Figure 11 shows both the radial profiles of the liquid mean azimuthal velocity in single phase and ventilated flow for Ta=1000. The velocity is normalized by Vi=2ΠRiΩi. To
compare with the azimuthal velocity of the bubbles vB, radial
profiles obtained with optical probe are superimposed. It can be noticed that near the inner cylinder, bubbles move a little slower than the liquid. For Ta=1000, the drift velocity vL-vB
can reach 10% of the liquid velocity. For Ta=780, it is 7% of the liquid velocity.
Concerning the comparison between the single phase and ventilated flow, there is a small deceleration of the liquid azimuthal velocity (4% and 6% for Ta=780 and 1000 respectively). This is due to momentum exchange, which is expected to increase with α, dB and (vL-vB).
Note that the complementary spectral analysis of the axial velocity performed in single phase flow and in ventilated flow shows that the spectra are similar for both quasi-periodic flow (Ta=780) and weakly turbulent flow (Ta=1000). Thus, there is no influence of the bubbles on the transition to weakly turbulent flow. 0 0,1 0,2 0,3 0,4 0,5 0,6 0,7 0,8 0,9 1 -0,5 -0,4 -0,3 -0,2 -0,1 0 0,1 0,2 0,3 0,4 0,5 x V / V i s ingle phas e ventilated bubbles
Figure 11: Radial profiles of azimuthal velocity in the outflow region of both the liquid phase and the bubbles for Ta=1000.
x=r/d-(Ri+Ro)/2d
Characteristics of the liquid phase in the
gaseous-cavitating flow
To quantify the bubble effect on the flow patterns in cavitating flow, mean velocity components of the liquid and spectra obtained in cavitating flow are compared with those obtained in single phase flow. As for the ventilated flow, axial profiles and spectra of axial velocity were measured near the outer cylinder (x=0.25) where no bubbles can contribute to the LDV signal. For the measurement of radial profiles of azimuthal velocity performed in the core of the Taylor vortices, the bubble induced error is not as disadvantageous as in the outflow region. However, for the measurement of radial profiles of azimuthal velocity performed in the outflow regions, the bubble induced error remains small (< 1%).
In the case of cavitating stratified flow, the Taylor vortices tend to shift axially with time. Therefore, axial profiles and radial profilesof velocity components are only investigated in the case when the flow is homogeneous.
The axial profile of mean axial velocity plotted in Fig. 12 for Ta=1000 (nS=16), shows clearly that the axial wave length
is reduced with the vapour phase, by comparison to the single phase flow. The axial wave length values investigated by LDV are in agreement with the values obtained by the visualizations and reported in Tab. 2. In homogeneous cavitating flow, there is both a flattening of the Taylor vortices (
phase single λ λ ∆ =-8.5% at Ta=780, nS=15 and -15.5% at Ta=1000, nS=16) and a
decrease of the tangential velocity (
phase single L w w ∆ =-2% at Ta=780, nS=15 and -11.5% at Ta=1000, nS=16). This trend is
more pronounced in the Taylor vortices where bubbles are captured and reinforced when both Ta and the void fraction increase. Globally, when combining reduction of both size and tangential velocity of the vortices, it seems that the vorticity slightly increases with the vapour phase for both Ta.
-500 -400 -300 -200 -100 0 100 200 300 400 500 0 2 4 6 8 10 12 14 z/d w d /ν ν ν ν s ingle phas e nS=16 (homogeneous )
Figure 12: Axial profiles of axial velocity for Ta=1000. Comparison between single phase flow and homogeneous
cavitating flow (nS=16)
A squeezing of the Taylor vortices was also observed by Atkhen et al. [2] in weakly and high turbulent Couette Taylor flow with a superimposed axial flow. Indeed, according to their measurements, at Ta=1000, the axial wave length is reduced by 20% for a volumetric flux of the liquid corresponding to JL=0.034m/s (ie JL/Vi=0.044Vi). Due to the difference between
the inertia of vapor and liquid, same volumetric flux of vapor would lead to less important modification of the flow patterns. This gives rise to the question: is there any influence of the transitional axial flow superimposed during the stratification stage on the axial reduction in wavelength observed in cavitating homogeneous flow? The superficial velocity JG due
to the axial volumetric flux was roughly estimated as
(
)
( )
2 rdr t L r R R 1 o i R R d 2 i 2 0 π ∫ α −π , with td the time necessary for
the bubbles to migrate from the bottom to the top of the apparatus. From the radial profile of void fraction measured in the third string below the free surface of the stratified flow at Ta=1000, we obtain JG equal to 0.006mm/s (ie 3 10-6Vi).
Compared with [2], this value is too small to ensure a modification of the flow patterns. Same conclusion is drawn, by comparison with Shiomi et al. [1]. Indeed, they underline, that there is no significant influence of a two-phase axial flux on the axial wavelength for a superficial velocity (ie liquid+gas) less than 0.35 Vi, from Ta=3000 up to 25000. Thus, the squeezing of the Taylor vortices is likely to be due to the bubbles effect, in terms of momentum exchange and not to the superimposed gas flux during pressure drop.
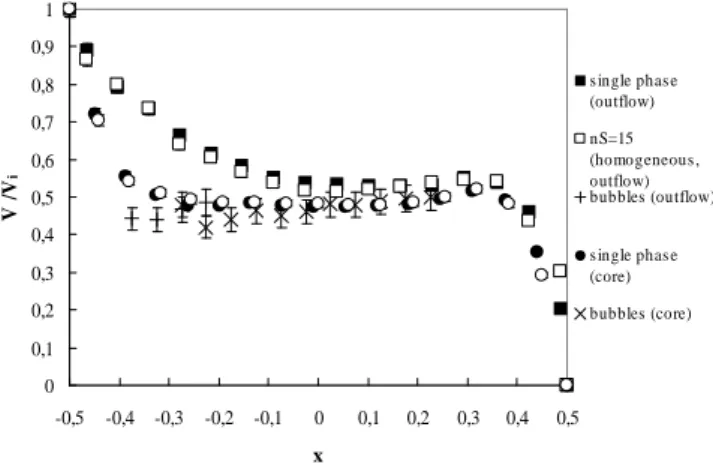
In Figs. 13 and 14, radial profiles of mean azimuthal velocity measured both in the core of the vortices and in the outflow region are presented together with profiles of mean bubble velocity for Ta=780 (nS=15) and Ta=1000 (nS=16)
respectively. For the homogeneous flow, the vapour moves at the velocity of the liquid in the middle of the gap. The drift velocity is particularly important in the outflow region near the inner cylinder. It is responsible for the elongation of the bubbles, observed in this region of the flow. At x=-0.375, the drift velocity can reach 40% and 27% of the liquid velocity for
Ta=780 and 1000, respectively. This drift velocity is expected to increase in the region closer to the wall, where the probe is unable to take measurements. In the core of the vortices, the drift velocity is small, in agreement with the spherical shape of the bubbles. 0 0,1 0,2 0,3 0,4 0,5 0,6 0,7 0,8 0,9 1 -0,5 -0,4 -0,3 -0,2 -0,1 0 0,1 0,2 0,3 0,4 0,5 x V / V i s ingle phas e (outflow) nS=15 (homogeneous , outflow) bubbles (outflow) s ingle phas e (core) bubbles (core)
Figure 13: Radial profiles of azimuthal velocity of both the liquid phase and the bubbles for cavitating homogeneous flow
at Ta=780 (nS=15)
x=r/d-(Ri+Ro)/2d
Figure 14: Radial profiles of azimuthal velocity of both the liquid phase and the bubbles for cavitating homogeneous flow
at Ta=1000 (nS=16)
x=r/d-(Ri+Ro)/2d
Figures.13 and 14 also display the radial profiles of mean azimuthal velocity measured in single phase flow. It can be seen that homogeneous cavitation has no significant influence on the azimuthal mean velocity in the core of the vortices. In the outflow region, however, there is a decrease in liquid velocity near the inner cylinder (4% and 7% for Ta=780 and 1000, respectively) that results from the momentum exchanges between the phases. This deceleration of the liquid depends on the Ta number and thus increases with the void fraction. It leads to a flattening of the radial velocity profiles, characteristic of bubbly flows in general. The flattening of the azimuthal velocity profiles and the deceleration of the liquid in the outflow regions are expected to be more pronounced in the case
0 0,1 0,2 0,3 0,4 0,5 0,6 0,7 0,8 0,9 1 -0,5 -0,4 -0,3 -0,2 -0,1 0 0,1 0,2 0,3 0,4 0,5 x V / Vi single phase (outflow) nS=16 (homogeneous, outflow) bubbles (outflow) single phase (core) nS=16 (homogeneous, core) bubbles (core)
of stratified cavitating flow for which the void fraction is augmented by comparison to the homogeneous flow.
Spectra of the liquid axial velocity performed in the outflow region are presented in Figs. 15 and 16, respectively for Ta=780 and Ta=1000. In these figures, the spectrum obtained in single phase flow is superimposed with the spectrum obtained in stratified cavitating flow. Spectra obtained in homogeneous flow are unchanged by comparison to single phase flow (and thus are not displayed in the figures). Note that it was carefully checked that spectra were the same for the different axial positions of the outflow regions.
Figure 15: Comparison of the spectra obtained at Ta=780: … single phase flow, ▬cavitating stratified flow (nS=15).
Figure 16: Comparison of the spectra obtained at Ta=1000: … single phase flow, ▬ cavitating stratified flow (nS=16).
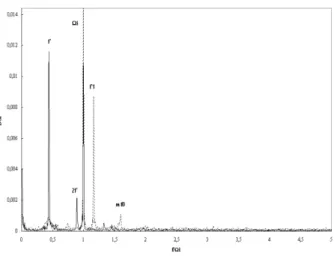
For Ta=780, in single phase flow, incommensurable rays of frequency (f’ and mf0) are observed, corresponding to the quasi-periodic flow with an azimuthal wave number m=4. For the cavitating stratified flow (ns=15), as evidence, there is a
premature disappearance of the azimuthal wave, corresponding to a premature appearance of the weakly turbulent flow. For the cavitating homogeneous flow, the spectrum recovers the same shape as in single phase flow, assuming that the premature change in turbulence development is transitional, in agreement either with a stratification state of the flow or with a void fraction in the outflow region larger than 0.1%.
For Ta=1000, as expected in Table 1 for the single phase weakly turbulent flow, the azimuthal wave of frequency mf0 has disappeared. Same result is encountered both in cavitating stratified flow and in cavitating homogeneous flow (nS=16).
Spectra analysis shows that the distribution of fluctuating energy is modified by the presence of the bubbles in quasi-periodic flow for cavitating stratified flow conditions. To explain this, it can be worth comparing the bubble size and the length scale of energy containing eddies. The length scale of azimuthal wave can be deduced from the ratio:
0 rms
0 mf
W
l = and
the one of the modulation from the ratio ' '
f W
l= rms , where Wrms is the rms value of axial velocity component in the outflow region. This yields to lenghtscales of 5 mm and 16 mm respectively. This roughly estimation shows that the bubble size in the outflow region is of the same order as the azimuthal wave length scale, as it is suggested by the premature disappearance of this wave at Ta=780. According to Cognet [8], azimuthal waves, in single phase Couette Taylor flow, are due to the significant radial jet localized in the outflow region. Therefore, it can be supposed that when bubbles of same size as the azimuthal wave characteristic length interfere with this jet, azimuthal waves are affected. Fluctuating kinetic energy of the azimuthal wave is thus transferred to the chaotic structures characterized by f’. Indeed, kinetic energy of frequency f’ is promoted by the capture of the bubble, the bubble arrangement in the core of the vortices following the waves associated with this frequency, as mentioned before.
Let us now evaluate the turbulent fluctuations produced by the wake of the bubbles, ie : ‘pseudo-turbulence. In the outflow jet, taking into account the bubble small axis distribution, the characteristic frequency of fluctuations in the wake of ellipsoïdal bubbles can be estimated based on a Strouhal number L B B outflow L B B W lx f U lx f ≈ ,
around 0.13. It leads to bubble frequencies approximately equal to 12Hz (≈7Ωi), out of order by comparison to characteristic frequencies of the flow (f’ and mfo). Moreover, according to Lance and Bataille [9] in grid turbulence flow, the void fraction must be superior than 1% to have spectra affected by pseudo-turbulence. This condition is obviously not satisfied. The bubble induced fluctuating motion is thus clearly due to bubble capture in the vortices.
Discussion about bubble induced effects on
the flow pattern. Comparison between
ventilated and gaseous-cavitating flows
This study provides the evidence that the ventilated and cavitating Couette Taylor flows, characterized by different bubble size, have not the same features in the range 780≤Ta≤1000.
For the ventilated flow, there is no influence of the bubbles on the spectra of axial velocity. Bubbles, localized in the outflow region, are considered too small (dB/d=0.035) to
interfere with turbulent structures and bring about a premature transition to turbulence. Nevertheless, there is a slight increase in axial wave length. In Djeridi et al [4], it is conjectured that migration of bubbles (dB >0.3d) from the cores of the vortices
into the outflow regions leads to an augmentation in the axial wavelength. It is now clear that this bubble location in the outflow, whatever their size, is responsible for the vortices size modification. This stretching of the Taylor vortices is consistent with an increase of the axial momentum transfer between the Taylor vortices [10]. The boundary region is known to act as a barrier to exchanges, thus bubbles, can act as an intermediary to transfer momentum between the vortices.
For the homogeneous cavitating flow, Taylor vortices are squeezed. In the present study, it seems that bubbles, mostly trapped in the core of the vortices, are responsible for a decrease of the vortex size and an increase of the vorticity. This is in agreement with Gopalan and Katz [11]. They give the evidence, that for certain combinations of vortex strengths and bubble diameters, a few entrained bubbles at very low void fraction, can reduce the core size of laminar, transitional and turbulent vortices. According to the bubble location in the vortex core and the ratio between momentum exchange due to bubble buoyancy effect and due to bubble pressure gradient effect given by 2 3 B G d g
, the distortion can be null, marginal or severe. G represents the vortex strength. In our case, the increase in vorticity is about 6%, assuming that the distortion is called ‘marginal’ distortion. In [11], marginal distortion is observed for bubble distance from the centre of the vortex between 0.4R and 0.45R, with R the vortex radius. This is typically the case for the radial bubble location (0.44R). For the axial bubble location, we obtain a little more (0.54R). We also obtain 2 3 B G d g
larger than prescribed by [11]. Estimations give 4.10-3 and 3.10-3 for Ta=780 and Ta=1000, respectively. Nevertheless, comparisons with [8] are difficult because the distortion of the vortices seems also to be linked to the bubble number and their residence time, for bubbles agglomerated in the vortex.
Taking into account that bubble location influences directly the size of the vortices, thus, a predominant flattening of the Taylor cells is observed, when the void fraction in the core of the cells is more significant than the void fraction near the inner cylinder in the outflow region (top of the gap in stratified flow and homogeneous flow) and in return a predominant growth of the Taylor cells is observed, when the void fraction near the inner cylinder in the outflow region is more significant than the void fraction in the core of the cells (bottom of the gap in stratified flow).
In single phase flow, the axial wavelength growth is related to the increase in the wall shear stress (Cognet, 1984). Therefore, same arguments relative to the “bubble induced wall shear stress” can be advanced to explain the growth of the Taylor cells length observed in ventilated flow and stratified cavitating flow.
For both ventilated and cavitating flows, bubbles move slower than the liquid in the azimuthal direction. The azimuthal drift velocity is reinforced in the region where the liquid is accelerated, and thus particularly in the outflow region, near the inner cylinder. This results in a deceleration of the fluid in the azimuthal direction near the inner cylinder in the outflow region and a flattening of the azimuthal velocity radial profiles. This corresponds to an increase of the velocity gradient at the inner cylinder, leading to an increase of the wall shear stress at the inner cylinder. This increase of the local wall shear stress, which is expected to expand with the void fraction is called ‘bubble induced wall shear stress’. It is not directly due to buoyancy effect, but rather due to modification of liquid velocity profiles near the wall, as a result of momentum transfer between gas and liquid phases.
When considering the volume occupied by the bubbles
α multiplied by the drift velocity, there is a ratio of 0.4 and 0.14 between cavitating homogeneous flow and ventilated flow, for Ta=780 and 1000 respectively. Thus, the momentum exchange between bubbles and liquid is greater in ventilated flow than in cavitating flow, letting suppose that ‘bubble induced wall shear stress’ is greater in ventilated flow than in cavitating flow. Therefore, radial transport of fluid azimuthal momentum from near the inner wall outward [12] and axial momentum transfer are prominent in ventilated flow. The reason why transfers are promoted in ventilated flow is that the bubble quantity and thus the void fraction in the outflow region near the inner cylinder are more important, regardless of the bubble size. In Djeridi et al. [4], the bubble induced wall shear stress was expected to be responsible for the premature transition between the second and third instability. In the present experiment, it cannot explain the premature transition to weakly turbulent flow, observed for the stratified cavitating flow. This premature transition must not be considered here as an advance in the transition to turbulence. Two reasons can be invoked: Fist of all, millimetric bubbles present in the outflow region in cavitating flow interfere with the azimuthal wave. Secondly, millimetric bubbles to be captured by the Taylor vortices in cavitating flow reinforces the modulation f’ at the cost of the azimutal wave.
CONCLUSION
The bubbly Couette-Taylor flow was investigated for the quasi-periodic and weakly turbulent regimes. Bubbles of different size were generated either by natural ventilation (dB=0.03d) or by injection and pressure drop (gaseous
cavitation dB=0.15d). For α>0.1%, bubble induced
modifications of the flow patterns are evident, depending on the bubble location in the gap and their size.
For the ventilated flow, submillimetric bubbles are localized in the outflow regions near the inner cylinder. For the cavitating flow, millimetric bubbles are localized both in the outflow regions near the inner cylinder and in one in two Taylor vortex cores.. While injecting and decreasing the
pressure, the flow is axially stratified, the wavelength being increased at the bottom of the gap and decreased at the top. When the pressure is stabilized, the flow reorganizes to have an homogeneous axial wavelength.
For a preferentially bubbles arrangement in the outflow region near the inner cylinder, there is a stretching of the Taylor vortices. As a consequence of their drift velocity, bubbles localized in the outflow region are responsible for an increase of the wall shear stress at the inner cylinder. Stretching is thus due to ‘bubble induced wall shear stress’.
For a preferentially arrangement of the bubbles in the Taylor vortices obtained either at the top of the gap for stratified cavitating flow or in the entire gap for the homogeneous flow, there is a squeezing of the vortices, that increases with the void fraction. Squeezing is due to an increase of vorticity of the liquid in order to capture the bubbles.
In the case of stratified cavitating flow, a premature transition from quasi-periodic flow to weakly turbulent flow is observed. This is not attributed to advanced transition to turbulence but to interference in the outflow region between millimetric bubbles and the azimutal wave, the length scale of which is of the same order.
As a conclusion, bubbles localized near a wall in a Couette Taylor flow, and in two-phase flows in general, are expected to improve transfers, whereas bubbles captured by Taylor vortices, are expected to reduce transfers.
ACKNOWLEDGMENTS
This project was subsidized by the French Navy. The authors would also like to thank the crew of the Mechanical Department workshop for their technical assistance.
REFERENCES
[1] Shiomi Y., Kutsuna H., Akagawa K. and Ozawa M., 1993, “Two-phase flow in an annulus with a rotating inner cylinder (flow pattern in bubbly flow region)”, Nuclear Engineering and Design, 141, pp. 27-34.
[2] Atkhen K., Fontaine J., Wesfreid J.E., 2000, “Highly turbulent Couette-Taylor bubbly flow patterns”, J. of Fluid Mechanics., 422, pp. 55-68.
[3] Djeridi H., Favé J. F., Billard J. Y., Fruman D. H., 1999, “ Bubble capture and migration in Couette-Taylor flow”, Experiment. in Fluids, 26, pp. 233-239.
[4] Djeridi H., Gabillet C., Billard J.Y., 2004, “Two-phase Couette Taylor flow: Arrangement of the dispersed phase and effects on the flow structures”, Physics of Fluid, Vol. 16, n°1, pp. 128-139.
[5] Cartelier A., 1990, “Optical probes for local void fraction measurements: Characterization of performance”, Rev. Sci. Instrum., Vol. 61, n° 2, pp. 874-886.
[6] Gabillet C., Colin C., Fabre J., 2002, “Experimental study of bubble injection in a turbulent boundary layer “, Int. J. of Multiphase Flow, 28, pp 553-578.
[7] Clark N. N. and Turton R., 1988, “Chord length distributions related to bubble size distributions in multiphase flows”, Int J. Multiphase Flow, 14, n° 4, pp. 413-424.
[8] Cognet G., 1984, “Les étapes vers la turbulence dans l'écoulement de Taylor Couette entre cylindres coaxiaux ”, J. de Mécanique théorique et Appliquée Numéro spécial, pp. 7-44.
[9] Lance M. and Bataille J., 1991, “Turbulence in the liquid phase of a uniform bubbly air-water flow”, J. of Fluid Mechanics, 222, pp. 95-118.
[10] Tam W. Y. and Swinney H. L., 1987, “Mass transport in turbulent Couette-Taylor flow”, Phy. Rew. A, 36, pp. 1374-1381.
[11] Gopalan S. and Katz J., 1999, “Effect of entrained bubbles on the structure of vortex rings”, J. of Fluid Mechanics, 397, pp. 171-202.
[12] Wereley S. T. and Lueptow R. M., 1994, “Azimuthal velocity in supercritical circular Couette flow”, Experiment. in Fluids, 18, pp. 1-9.