UNIVERSITE DU QUEBEC
THESIS PRESENTED TO THE
UNIVERSITY OF QUEBEC AT CHICOUTIMI
IN PARTIAL FULFILMENT OF
THE REQUIREMENT FOR THE DEGREE
OF DOCTOR OF PHYLOSOPHY IN ENGINEERING
BY
SAYYED MAHDIALE-EMRAN
DESIGN OF BOOSTER SHED PARAMETERS FOR
IMPROVING THE ELECTRICAL PERFORMANCE OF POST
INSULATORS UNDER ICING CONDITIONS
UNIVERSITE DU QUEBEC
THESE PRESENTEE A
L'UNIVERSITÉ DU QUÉBEC À CHICOUTIMI
COMME EXIGENCE PARTIELLE
DU DOCTORAT EN INGÉNIERIE
PAR
SAYYED MAHDIALE-EMRAN
CONCEPTION DES PARAMÈTRES DES JUPES AUXILIAIRES
POUR AMÉLIORER LES PERFORMANCES ÉLECTRIQUES
DES ISOLATEURS DE POSTE DANS DES
CONDITIONS DE GIVRAGE
ABSTRACT
The optimized design of outdoor insulators that consider heavy icing and pollution conditions is a significant concern for the reliability of power networks. Based on field observations, the probability of flashover of EHV post insulators is higher than line insulators under the same heavy icing conditions. The flashover along the insulators is caused mainly by the presence of a water film on the ice surfaces (melting period) and partial arcs in ice-free zones (air gaps).
One of the mitigation options is the use of booster sheds (BSs) to create air gaps along the iced insulator. A booster shed (BS) is a flexible c-shape device made of high-quality insulating materials. Since BSs are easy to use, they seem to be simpler alternatives to upgrading insulators to those designed for cold climate regions. Despite the promising results of BS applications, still an important work must be achieved to propose optimized design of BS configurations.
This project aims to provide a generic design approach to the use of BSs by optimizing their main parameters (number, diameter, inclination angle, position, and permittivity) on post insulators under heavy icing conditions. This approach is based on analyzing previous BS tests in CEGELE, an improved hypothesis of BS effects, numerical analysis using commercial software (e.g. Comsol Multiphysics™, Matlab, and Minitab), geometric modeling of ice-covered post insulator with BSs, and finally experimental validation tests.
The improved hypothesis states that the major effect of BSs is the creation of air gaps and their minor effect is the increase in dry arcing distance. Moreover, among total length of the air gaps, dry arcing distance, and total ice-free leakage distance (IFLDtot), the IFLDtot
is a good indicator to quantify the BS effects on standard post insulators. Simulation analyses of BS configurations during the melting period demonstrate that the optimized relative permittivity of BS is an arbitrary value in its feasible variation range (2-15). The proper positions of BSs close to the HV electrode should be determined based on the probability of electrical breakdown. In contrast, the positions close to the ground electrode are determined based on ice-bridging effect. The geometric model and Taguchi method analysis show that the optimized value of BS inclination angle is equal to the upper shed angle of the insulator. Also, it indicates that generally the maximum feasible values for diameter and number of BSs are the best options. The feasibility in this regard, depends mainly on the minimum required distances between BSs as well as the mechanical forces of heavy ice and strong wind that may deform BSs. PVC sheet was deemed an effective solution for fabricating BS prototypes to perform the final validation tests. The experimental tests completely confirmed the improved hypothesis, the effectiveness of the geometric model, and the simulation analysis.
RESUME
La conception optimisée des isolateurs externes sous des conditions sévères de givrage et de pollution est une préoccupation importante, surtout pour la fiabilité des réseaux électriques dans les régions au climat froid. Basée sur la pratique des transporteurs d'énergie électriques, la probabilité de contournement des isolateurs de poste THT est plus élevée que celle des isolateurs de ligne dans les mêmes conditions de givrage. Le contournement le long des isolateurs est essentiellement dû à la présence d'un film d'eau sur les surfaces de glace (période de fonte) et d'arcs partiels le long de zones sans glace (intervalles d'air).
L'une des alternatives pour diminuer la probabilité de contournement des isolateurs recouverts de glace est l'utilisation des jupes auxiliaires (JAs), ce qui permet de créer de plus grands intervalles d'air le long des isolateurs. Une jupe auxiliaire (JA) est un dispositif en forme de C flexible fabriqué à partir de bons isolants. En plus d'être faciles à utiliser, les JAs semblent être une alternative relativement simple, puisqu'elles permettent d'éviter de concevoir des isolateurs spéciaux pour les régions froides. Même si les résultats des applications de JA sont prometteurs, il y a encore un important travail à faire pour proposer une conception optimisée de leur configuration.
Ce projet vise à optimiser les paramètres principaux ( nombre, diamètre, l'angle d'inclinaison, la position et la permittivité) des jupes auxiliaires pour fin de leur utilisation sur les isolateurs de poste sous des conditions sévères de givrage. Cette approche est basée sur plusieurs éléments tels que l'analyse des tests précédents des JAs à la CEGELE, une
hypothèse améliorée des effets des JAs, des analyses numériques utilisant des logiciels commerciaux tels que Comsol, MATLAB, et Minitab, ainsi que la modélisation géométrique de l'isolateur glacé avec JAs et sur des tests de validation expérimentaux.
Selon l'hypothèse améliorée, l'effet majeur de JAs est la création d'intervalles d'air et leur effet mineur est l'augmentation de la distance de l'arc. De plus, parmi la longueur totale des intervalles d'air, la distance d'arc et la distance totale de fuite dans les intervalles libres de glace (IFLDtot), le IFLDtot est un bon indicateur pour quantifier les effets des JAs
sur des isolateurs de poste standard. Les analyses de simulation de configurations des JAs en période de fonte montrent que la permittivité relative optimisée d'une JA est une valeur arbitraire dans sa gamme de variation possible (2-15). Les positions appropriées des JAs proches de l'électrode de haute tension devraient être déterminées à partir de la probabilité de décharge électrique. Par ailleurs, les positions proches de l'électrode reliée à la masse sont déterminées à partir de l'effet de pontage de la glace. Le modèle géométrique et la méthode Taguchi montrent que la valeur optimale de l'angle d'inclinaison des JAs est égale à l'angle de la jupe supérieure de l'isolateur. Ceci indique aussi que les valeurs réalisables maximales pour le diamètre et le nombre de JAs sont généralement les meilleures options. La faisabilité à cet égard, dépend principalement des distances minimales requises entre les JAs, ainsi que des forces mécaniques de la glace et du vent qui peut déformer les JAs. La feuille de PVC a été considérée comme une solution efficace pour fabriquer des prototypes de JA afin d'effectuer les tests de validation finale. Il s'est avéré que les tests ont complètement confirmé l'hypothèse améliorée, l'efficacité du modèle géométrique et les analyses de simulation.
ACKNOWLEDGMENTS
This project was carried out within the framework of the NSERC/Hydro-Quebec/UQAC Industrial Chair on Atmospheric Icing of Power Network Equipment (CIGELE) and the Canada Research Chair on Atmospheric Icing Engineering of Power
Networks (INGIVRE) at Université du Québec à Chicoutimi (UQAC). I appreciate all CIGELE partners (Hydro-Québec, Hydro One, Réseau Transport d'Électricité (RTE), Électricité de France (EDF), Alcan Cable, K-Line Insulators, Tyco Electronics, Dual-ADE, CQRDA, and FUQAC) whose financial support made this research possible.
I would like to express my sincere appreciation and admiration to my supervisor, Prof. Masoud Farzaneh, for his great experience, admirable support, and trust in me
throughout my PhD experience. This dissertation would not have been possible without his patient and continued support.
I am particularly grateful to Prof. William. A. Chisholm whose precious comments and professional discussions helped me to improve the quality of this work.
Also, I greatly appreciate Dr. Hatem Mrad for the effective discussions and assistance during the last parts of the project.
I would like to express my sincere gratitude to Prof. Issouf Fofana for not only his scientific guides, but also valuable advices, human qualities and supports.
I would like to extend my thanks to Pierre Camirand, Xavier Bouchard, and Claude Damours at CIGELE Laboratory for their technical support and to Denis Masson
I give special thanks to Dr. Ibrahima Ndiaye for his precious comments and guides during seminar I and my studies at UQAC. My thanks also go to Dr. Volat for his helpful guides and criticisms that helped to enhance the quality of this PhD project.
I am very grateful to the past and present directors of graduate studies, Prof. Duygu Kocaefe and Prof. Mohand Ourouche, for their valuable comments during my seminar
evaluation. Also, I wish to thank their secretaries, Chantale Dumas and Hélène Duchesne, for her help with administrative tasks.
I also appreciate Harriette Mostert for the editorial help in making this dissertation legible.
I would like to thank my Prof. Behzad Kordi for carefully reading my thesis and providing useful feedback.
Despite all the ups and downs, I thoroughly enjoyed this PhD period because of having wonderful friends and colleagues in CIGELE group and in Chicoutimi. I acknowledge all of them for the positive discussions, advices and good humor.
I deeply thank my dear parents, brothers and sister for their invaluable supports and love during my entire life and studies. Although I live far away, I always have them in my heart.
Last, but not least, I would like especially to thank my beloved wife, Kimia, whose encouragements and persistent confidence in me gave me the strength to endure the difficult time. I wish one day I will be able to return her dedication and love. This thesis is especially dedicated to her and my dear parents.
TABLE OF CONTENTS
ABSTRACT Ill RÉSUMÉ V ACKNOWLEDGMENTS VII TABLE OF CONTENTS IX LIST OF FIGURES ...XI LIST OF TABLES XIII GLOSSARY OF TERMS XV
1. CHAPTER 1 2
INTRODUCTION 2
1.1 OVERVIEW AND DESCRIPTION OF THE PROBLEM 2 1.2 RESEARCH OBJECTIVES 5 1.3 GENERAL METHODOLOGY 6 1.4 ORIGINALITY OF THE RESEARCH AND CONTRIBUTION TO KNOWLEDGE 7 1.5 THESIS OUTLINE 8 2. CHAPTER 2 11
LITERATURE REVIEW 11
2.1 INTRODUCTION 11 2.2 MITIGATION OPTIONS UNDER HEAVY ICING CONDITIONS 12 2.3 BOOSTER SHEDS UNDER ICING CONDITIONS 18
2.3.1 Problems of using BSs 23
2.4 AIR GAP EFFECTS ON ICED-COVERED INSULATORS 2 4 2.5 DESIGN AND OPTIMIZATION METHODS 2 6 2.6 CONCLUSION 30 3. CHAPTER 3 32
UPGRADED MODEL OF BS DIMENSIONING ...32
3.1 INTRODUCTION 32 3.2 DESCRIPTION AND OBSERVATIONS OF PREVIOUS BS TESTS 32 3.3 NUMERICAL SIMULATIONS 35 3.4 PROCEDURE FOR BS DIMENSIONING 37 3.5 ESTIMATION OF THE BREAKDOWN VOLTAGE EQUATIONS IN THE BS AIR GAPS 40
3.5.1 First approach 40 3.5.2 Second approach 42 3.5.3 Comparison of the approaches 45
3.6 THE APPLICATION OF THE GEOMETRIC MODEL TO THE B S CONFIGURATIONS 4 6 3.7 DISCUSSION 49 3.8 CONCLUSION 54 4. CHAPTER 4 57
PARAMETRIC SIMULATIONS AND IMPROVED HYPOTHESIS 57
4.1 INTRODUCTION 57 4.2 STUDY OF ICE ACCRETIONS ON BS TESTS 58 4.3 PARAMETRIC SIMULATIONS 62
4.3.1 The effect of water film 63 4.3.2 The effect of number of BSs 64
4.3.3 The effect of variations in the permittivity of ice andBS. 66 4.3.4 The effect of air gap length variation on the voltage drops 66 4.3.5 The effect of icicle direction of the first B S on the voltage drops 68 4.3.6 The effect of the diameter variation oftheBSs 69 4.3.7 The effect of the inclination angle variation oftheBSs 71 4.3.8 The effect of the metal ring at the top of the insulator 73 4.3.9 Comparison of the results for HVAC (f= 50 or 60 Hz) and HVDC 73 4.3.10 The effect of partial arc appearance on the voltage drops 74
A A IMPROVED HYPOTHESIS OF BS EFFECTS 79
4.5 CONCLUSIONS : 85 5. CHAPTER 5 ...89
GEOMETRIC MODELING AND DESIGN APPROACH 89
5.1 INTRODUCTION 89 5.2 GEOMETRIC MODELING OF THE PRECIPITATION ON THE INSULATOR WITH B S S 89 5.3 CALCULATION OF THE TOTAL ICE-FREE LEAKAGE DISTANCE (IFLDT O T) 95
5.4 DESIGN APPROACH USING TAGUCHI METHOD 97 5.5 OPTIMIZATION OF BS POSITIONS 104 5.6 RESPONSE SURFACE ANALYSES 108 5.7 CONCLUSIONS 110 6. CHAPTER 6 113
VALIDATION TEST RESULTS 113
6.1 INTRODUCTION 113 6.2 VALIDATIONS BASED ON PREVIOUS RESEARCHES 113 6.3 TRIAL TESTS 115
6.3.1 Trial tests with the first prototype ofBS. 115 6.3.2 Trial tests with previous 6-BS configuration 118
6.4 CLASSIFICATION OF THE BS PARAMETERS 120
6.4.1 Fixed parameters of BSs 120 6.4.2 Variable parameters of BSs 121
6.5 VALIDATION TEST RESULTS 123 6.6 EXPERIMENTAL TESTS ON ICICLE GROWTH OF BSs 128 6.7 CONCLUSIONS 130 7. CHAPTER 7... 132
CONCLUSIONS AND RECOMMENDATIONS 132
7.1 CONCLUSIONS 132 7.2 RECOMMENDATIONS FOR FUTURE WORK 137
REFERENCES 142
8. APPENDIX 151
LIST OF FIGURES
Figure 1.1-Booster Shed (CIGELE Lab.)... 3 Figure 1.2- Typical booster sheds applied to transformer bushings. (Courtesy of Tyco.) 3 Figure 1.3- General Methodology 6 Figure 2.1- Ice accretion on 500-kV polymer insulator with grading ring [48] 16 Figure 2.2- Physical appearance of ice-covered insulators with modified grading rings 17 Figure 2.3- Slip-on creepage extender with open gap. (Courtesy of Tyco.) 18 Figure 2.4- BS set up [17] 21 Figure 2.5- Typical puncture damage to BS after heavy, conductive ice test [2] 23 Figure 2.6- Insulator glaze damage under bottom surface of failed BS [2] 23 Figure 2.7- Typical booster shed applied to a post insulator (CIGELE Lab.) 24 Figure 2.8- The main parts of the literature review and their interactions 30 Figure 3.1- Test results for standard post insulators in heavy icing conditions 33 Figure 3.2- Equipotential line distributions of the post insulator with BSs 36 Figure 3.3- Geometric model for dimensioning two parameters of BSs ..38 Figure 3.4- Schematic diagrams: a) the icicle on BS b) the icicle-plane configuration c) the icicle dimensions 41 Figure 4.1- Test results for standard post insulators in heavy icing conditions 58 Figure 4.2- Clarification of IFLDb BSi, ice-free sheds and partially ice-bridged sheds 62 Figure 4.3- Equipotential line distributions of the post insulator with 6 BSs considering water film effect 63 Figure 4.4- Potential distribution of the post insulator with 4, 5 and 6 BSs 65 Figure 4.5- Equipotential line distributions of the 6-BS configuration with different air gap lengths: 67 Figure 4.6- Schematic diagram of the icicles on BSs and the ice surfaces 68 Figure 4.7- Equipotential line distributions around BSi with different angles of icicles: ....69 Figure 4.8- Equipotential line distributions of the 6-BS configuration with different diameters: 70 Figure 4.9- Equipotential line distributions of the 6-BS configuration with different inclination angles of BSs: 72 Figure 4.10- Equipotential line distributions around BS] and small corona ring effect 73 Figure 4.11- Appearance of partial arcs along air gaps in a 6-BS trial test at CIGELE 76 Figure 4.12- Equipotential line distributions for different BS configurations with and without partial arc (PA) 77 Figure 4.13- Comparison of voltage drops (AV (%)) along the air gaps of 4-BS tests, before and after the formation of a partial arc along air gapl 77 Figure 4.14- Comparison of voltage drops (AV (%)) along the air gaps of 5-BS tests, before and after the formation of a partial arc along air gapl 78 Figure 4.15- Comparison of voltage drops (AV (%)) along the air gaps of 6-BS tests, before and after the formation of a partial arc along air gapl 78 Figure 4.16- Comparison of voltage drops (AV (%)) along the 3 air gaps for 1 unit post insulator, before and after the formation of a partial arc along air gapl 79
Figure 4.17- Comparative test results for post insulators with 4, 5, and 6 BSs under 30mm ice accretion.... 82 Figure 4.18- Comparison of the parameters in ice-bridging during the 6 BS-test under 30-mm ice accretion 84 Figure 5.1- Two-unit post station insulator after ice accretion: 90 Figure 5.2- Illustration of the standard post insulator and the geometric model 90 Figure 5.3- The effect of incidence angle of precipitation (0) on the Nwi for DBS= 65.5 cm
and 0=24.5° 93 Figure 5.4- The effect ofy# (BS angle) variation onNwi(DBS= 65.5 cm) 94
Figure 5.5- The effect of DBsi (Diameter of BS) variation on Nwi 95
Figure 5.6- Impact factor of the BS parameters 103 Figure 5.7- Variation of average S/N ratios (smaller is better) with factor levels 104 Figure 5.8- Geometric model of dry arcing distance 105 Figure 5.9- Optimization flowchart 1 (analytical and simulation analyses) 107 Figure 5.10- The 3D response surface plot of the IFLDtot as a function of inclination angle
and diameter of BSs... 109 Figure 5.11- The 2D response surface plots of the IFLDtot as a function of inclination angle
and diameter 109 Figure 6.1- The stages of preparing the first prototype of BS 116 Figure 6.2- Trial flashover test with the first prototype of BS 117 Figure 6.3- Different sequences during BS tests Ata=140 min, Atc=20 min 118
Figure 6.4- Trial test with 6-BS configuration under heavy ice condition: 119 Figure 6.5- Arc propagation pattern during the flashover along 6-BS configuration 119 Figure 6.6-. Simplified drawing of BS prototypes on 121 Figure 6.7- The results of VWs of the optimized configuration 124
Figure 6.8- Physical appearance of the insulator with BSs after ice accretion sequence... 124 Figure 6.9-. Corona discharge appearance in the vicinity of the first BS 125 Figure 6.10- The first BS condition after test no. 2 126 Figure 6.11- The first BS repaired after test no. 3 126 Figure 6.12- Optimization flowchart 2 (validation tests) 127 Figure 6.13- Comparison of the icicle growths along the air gaps to study the effect of applied voltage 129 Figure 6.14- Dripping water conductivity comparison for with- and without-voltage conditions 129 Figure 7.1- Interaction of the scientific methods used in the novel design approach leading in time and cost saving 136 Figure 7.2- Cross section of the proposed experimental test; typical values 140 Figure 7.3- Trial test of 6-BS configuration 140 Figure A. 1- Test results of various configurations of standard post insulators in heavy icing conditions 151
LIST OF TABLES
Table 2.1- Experimental and calculated results [16] 19 Table 2.2- Final dimensions of BSs considering the proposed method in [17] 21 Table 3.1- The average lengths of the air gaps (cm) during the BS tests 34 Table 3.2- The average lengths of the icicles during the BS tests 35 Table 3.3-. Simulation parameters 36 Table 3.4-. Comparison of the calculated voltage drops (AV (%)) for 4, 5 and 6 BS tests ..37 Table 3.5-.Analysis of the voltage drops along the first air gaps for 4-, 5- & 6-BS tests
when the applied voltage equals to VMF or VWs • 43
Table 3.6-. Calculation of the positions and diameters of 4 BSs 48 Table 3.7-. Calculation of the positions and diameters of 5 BSs 48 Table 3.8-. Calculation of the positions and diameters of 6 BSs 49 Table 3.9-.Distances (cm) between the installed BSs in the tests 49 Table 4.1- The installation positions of the BSs based on the shed numbers of the post insulator units 59 Table 4.2-. Average lengths (cm) of the air gaps and icicles in BS tests ..60 Table 4.3-.Equivalent total ice-free sheds and ice-free leakage distances (IFLD) (cm), during the BS tests 61 Table 4.4-.Comparison of voltage drops in the sample 6-BS configuration 64 Table 4.5-.Comparison of the calculated voltage drops (AV (%)) for 4, 5 and 6 BS tests...65 Table 4.6-.Comparison of voltage drops in the 6-BS configuration by changing the air-gap length no. 3 67 Table 4.7-.Comparison of voltage drops in the 6 BS configuration by changing the icicle slope on BSi 69 Table 4.8-.Comparison of voltage drops in a sample 6-BS configuration by changing the BS diameters 71 Table 4.9-.Comparison of voltage drops in the 6-BS configuration by changing the inclination angles of BSs 71 Table 4.10-. Comparison of voltage drops (AV (%)) along the air gaps of 4-BS tests, before and after the formation of a partial arc along air gapl 77 Table 4.11-.Comparison of voltage drops (AV (%)) along the air gaps of 5-BS tests, before and after the formation of a partial arc along air gapl 78 Table 4.12-.Comparison of voltage drops (AV (%)) along the air gaps of 6-BS tests, before and after the formation of a partial arc along air gapl 78 Table 4.13-.Comparison of voltage drops (AV (%)) along the 3 air gaps for 1 unit post insulator, before and after the formation of a partial arc along air gapl 79 Table 4.14-.Comparative test results for post insulators with 4, 5 and 6 BSs 82 Table 4.15-. Variation of the parameters for post insulators with 4, 5 and 6 BSs 82 Table 4.16-.Comparison of the parameters in ice-bridging during the 6 BS-test ...84 Table 4.17-. Variation of the parameters in ice-bridging during the 6 BS-test 84 Table 5.1-.The effect of incidence angle of precipitation (0) 93
Table 5.2-.Comparison of IFLDtot of the geometric model results and the experimental test
results, 30 mm ice accretion on rotating cylinder 97 Table 5.3-. The parameters of BSs and the corresponding levels in the Taguchi method ...99 Table 5.4-. Matrix of the virtual experiments (orthogonal array LI6) and the consequent results 101 Table 5.5-. The response of the S/N ratios and their rank (in CIGELE Lab. condition, 6= 51°) 102 Table 5.6-. The response of the S/N ratios and their rank (winter storm condition, 0= 0°)102 Table 5.7-. Comparison of dry arcing distance for different cases 105 Table 6.1-.Diameters (cm) of the BS prototypes 121 Table 6.2-.The position (shed number) and diameters of BSs 122 Table 6.3-.Comparison of the optimized BS test and the previous 6-BS test 123 Table 7.1-. Different stages in the novel design approach leading to considerable time saving 136 Table A. 1- The position (shed number) of the installation of the BSs on the insulator.... 152 Table A. 2- Distances between the installed BSs (cm) 152 Table A. 3- The ice condition of the insulator sheds under booster sheds 155 Table A. 4- The ice condition of the insulator sheds under BSs (15 mm ice accretion on rotating cylinder) 155 Table A. 5- Equivalent total ice-free sheds and ice-free leakage distances (IFLD) in BS configurations 156 Table A. 6- The lengths of the air gaps (cm) in BS configurations 156 Table A. 7- The lengths of the icicles (cm) in BS configurations 157 Table A. 8- Normalization of the average lengths of the icicles of BSs 160
GLOSSARY OF TERMS
Air Gap (AG): an ice-free zone along the insulator.
Applied water conductivity (020): the electrical conductivity of water used to simulate ice,
snow, or cold-fog accretion on insulators, corrected to 20 ° C.
Booster Shed (BS): a flexible c-shape device usually made of high-quality insulating
materials. It can improve the electrical performance of insulators under heavy wetting and icing conditions.
Dry Arcing Distance (DAD): is the shortest distance in air between the high voltage and the
ground electrodes.
Dry ice: the ice without water film at its surface.
Flashover: a disruptive discharge through air around or over the surface of solid or liquid
insulation, between parts of different potential or polarity, produced by the application of voltage wherein the breakdown path becomes sufficiently ionized to maintain an electric arc. Glaze ice (clear ice): type of precipitation icing resulting in pure ice accretion of density 0.7
-0.9 g/cm3, sometimes with the presence of icicles underneath the wires. It very strongly adheres
to objects and is difficult to knock off.
Ice thickness the radial thickness of ice accumulation measured on a rotating monitoring
cylinder.
Insulator: an insulating material designed to support a conductor physically and to
electrically separate it from another conductor or object.
Leakage current: a component of the measured current that flows along the surface of the tool
deposit, when the device is connected as intended to the energized power system at rated voltage.
Leakage distance: the shortest distance, or the sum of the shortest distances, along the
insulating parts of the insulator between those parts that normally have the operating voltage between them.
Maximum withstand voltage (VWs)- is established using constant contamination exposure.
The tests are complete when three withstands in four tests are observed at one voltage level, and two flashovers are observed at 5% higher voltage level. The Vws is the test level that gives three withstands out of four tests.
Minimum flashover voltage (VMF)- corresponds to a voltage level that is one step (5%) higher
than Vws and gives two flashovers out of a maximum of three tests.
Monitoring cylinder: a cylinder for measuring reference ice accretion, typically 25 - 30 mm in
diameter, either rotating at 1 rpm or fixed.
Partial discharge: a discharge that does not completely bridge the insulation between
electrodes.
Total air gap length (LAG-tot)' the sum of the lengths of air gaps.
Total Ice-Free Leakage Distance (IFLDtot)' the total of the shortest distances along the
insulating surface between the high voltage and ground electrodes that are free of ice. Uncertainty: an estimated limit based on an evaluation of the various sources of error.
Wet-grown ice (wet ice): is characterised by the presence of a water film of low resistivity at
CHAPTER 1
CHAPTER 1
INTRODUCTION
1.1 Overview and description of the problem
Electrical insulation and improving the flashover performance of HV insulators are challenging problems for many utilities in cold climate regions. In addition, the electrical problems of station insulators, such as high fault currents and equipment stresses, are more severe than for faults on line insulators. Actually, more than fifty percent of electrical icing flashover problems in North America are related to station insulators [l]-[5]. Thus, this project concentrates principally on the icing problems on station post insulators.
Several investigations and methods have been used to improve the performance of insulators in ice, snow, and pollution conditions [6]-[8]. One of the effective methods is using accessories such as booster sheds (BSs) and creepage extenders to break up icing patterns and to increase the threshold of ice accretion necessary for insulator bridging. BSs are flexible c-shape devices (Figure 1.1) which were invented in England to improve the flashover performance of insulators under heavy rain and high-pressure washing under energized conditions [9]—[13]. Some designs of booster shed (BS) have hemispherical "nubs" (Figure 1.1-a) to set a space between BSs the insulator surface. This space allows natural rain washing [2]. Figure 1.2 shows typical BSs applied to transformer bushings.
(a) (b) Figure 1.1- Booster Shed (CIGELE Lab.)
a) underside and opened status b) upper side and closed status
Figure 1.2- Typical booster sheds applied to transformer bushings. (Courtesy of Tyco.)
The effectiveness of BSs in heavy rain conditions is due mainly to a combination of features such as water shedding, discharge inhibition, and arc suppression [9], [11]. BSs can be used in cold regions with heavy ice and snow conditions as well [14]-[20].
The key parameters and/or properties that can be considered in BS optimized design and BS applications are:
1. Electrical properties (e.g. dielectric strength, volume, and surface resistance, permittivity or dielectric constant, tracking and erosion resistance).
2. Mechanical properties (e.g. tensile strength, ultimate elongation, low temperature flexibility).
3. Chemical properties (e.g. ultra violet resistance, hydrophobicity).
4. Aging properties i.e. the variations of above mentioned properties over time. 5. Geometrical parameters (e.g. diameters, inclination angle, thickness).
6. Installation parameters (e.g. number of BSs, positions, and speed in installation procedure).
Commercial BSs are generally made of ethylene vinyl acetate (EVA), a copolymer with suitable characteristics for industrial purposes under electrical, environmental, and mechanical stresses [11]. Hence, among the mentioned parameters, this PhD project contributes mainly to the optimization of some geometrical and installation parameters of BSs. It can close some major gaps in the present state of knowledge of BS applications under heavy icing conditions. For example, in the Tyco Company's manual for BSs, it is suggested to install BSs in equal distances. However, since the electrical field distribution along post insulators with BSs is not uniform, the ice accretion on BSs is not equal from top to bottom. In fact, the suggested method is not an optimum approach.
To solve the problems of the electrical performance of post insulators under heavy ice conditions, they can be substituted with new types of insulators. However, new insulators and their installation is much more expensive compared to the price of BSs. Thus, a more economical approach would be to add optimum BSs to the existing power network insulators.
1.2 Research objectives
The overall objective of this PhD project is to design booster shed parameters under heavy icing conditions through a generic approach in order to improve the electrical performance of EHV ceramic post insulators. The main BS parameters are as follows: number, diameter, inclination angle, position, and relative permittivity. Thus, a systematic study based on the combination of analytical analysis, simulations, and experimental tests should be performed. For this purpose, the specific objectives are as follows:
• To analyze different BS configurations by simulations of electrical field and potential distributions and parametric studies (water film effect, variation of BS parameters, flashover performance analyses, etc.);
• To establish an improved comprehensive hypothesis of BS effect under heavy icing conditions;
• To improve and develop effective geometric models in order to analyze the electrical performance of ice-covered post insulators equipped with BSs;
• To do optimality and post-optimality analyses of BS parameters using problem formulation process and modern techniques;
• To validate results by making proper BS prototypes and performing corresponding feasible experimental tests under heavy icing conditions.
1.3 General methodology
To achieve the main and specific objectives of the project, numerical modelling and calculations were done by Comsol Multiphysics™, Minitab and Matlab software, mainly based on previous BS tests in CIGELE. Finally, experimental validation tests were carried out. Figure 1.3 illustrates the general methodology by a flowchart. In the next chapters, the details of the methodology and the corresponding results are presented.
Project Statement |
Identification of the Design Parameters: NBS, P, DBSi, PBSi,E,BS
Constraints:
0 <NBS< 26+25, 0° <(3< 24.5°,
2 <8r.BS< 15, 29.7< DBS, (cm) <76.7,
PBSi: 1st Shed to Last Shed
Criteria: VWs Î Ice Accretic & COMSOL m Analyses Simulations Improved Hypothesis À
Novel Geometric Model & Taguchi Technique
Experimental Validation Tests
V.^ y" The Problem \
y^< ^ Formulation Process /
,••••' Solutions
••••"%*" •••... & Validations /
Figure 1.3- General Methodology
1. Study of ice accretions on booster sheds 2. Computer simulations and parametric studies
3. Improved hypothesis concerning the effects of BSs under heavy icing conditions 4. Geometric modeling of the ice-covered post insulator equipped with BSs
5. Taguchi method application to design and optimize BS parameters 6. Experimental validation tests
1.4 Originality of the research and contribution to knowledge
Based on exhaustive study and consultation, only a few research results can be found on the effect of using BSs for insulators in cold climate environments and no systematic studies that analyze the major BS parameters installed on insulators in heavy icing conditions. Thus, the originality of this PhD project is summarized mainly as follows:
• the first extensive study to optimize BS parameters under icing conditions,
• the first simulations for various BS configurations, BS parameters and partial arcs onBS,
• upgraded model of BS dimensioning,
• improved hypothesis of the BS effects under heavy icing conditions,
• novel geometric modeling of ice-covered post insulators equipped with BSs, considering the precipitation angle,
• new design approach to use Taguchi method for optimality and post-optimality analyses,
• unique design method and fabrication of feasible BS prototypes for application on EHV ice-covered insulators that not only opened a locked door toward the final experimental tests in this research but also for the future studies in this domain, • original optimized BS configuration to carry out the final experimental validation
tests under heavy icing conditions.
1.5 Thesis outline
The structure of this dissertation is as follows:
Chapter 1 introduces general information about the problem, the necessity and motivation for the present research. Moreover, it presents the general and specific objectives, the general methodology, and the statement of the originality of the research.
Chapter 2 reviews the literature as it relates mainly to ice-covered insulators, booster sheds as well as design and optimization methods.
Chapter 3 proposes an upgraded model of booster shed dimensioning. It deals mainly with the diameter and position of booster sheds.
Chapter 4 describes the parametric simulation studies and the improved hypothesis of BS effects under heavy icing condition. Since the design approach is based on this improved hypothesis, this stage is as important as a foundation of a building.
Chapter 5 elucidates the geometric modeling of ice-covered post insulators equipped with BSs taking into account the precipitation angle. Then the geometric model is used to apply the Taguchi technique in the optimality and sensitivity analyses of various BS configurations under heavy icing conditions.
Chapter 6 deals with the fabrication of BS prototypes and the final experimental validation tests.
Finally, Chapter 7 concludes this study and it also presents the recommendations for future work.
CHAPTER 2
CHAPTER 2
LITERATURE REVIEW
2.1 Introduction
Outdoor insulators are widely used in power networks, but ice accretion may cause a drastic reduction in their electrical insulating performance in high altitudes and cold climate regions in many countries, such as Canada [21], [22], the USA [23], China [5], [24]-[27], Norway [28], Japan [29], and Iran [30]. In fact, in many cold regions of the world, atmospheric icing is a severe problem in electrical power systems. It can cause power outages and often incurs major costs by insulator flashover at service voltage [2], [31].
Two famous ice storms which clearly illustrate the disastrous consequences of the problem were firstly in Eastern Canada and US in 1998 and secondly in Southern China in 2008. The cost to the economy in the first one was estimated at nearly US$6 billion. Almost 1.6 million customers in Quebec and Ontario were left without power for periods of 3-30 days [32]. During the second ice disaster frozen rain and snow lasted for more than three weeks, caused a large-scale outage in several provinces of China, and led to an economic loss of US$7.9 billion [26], [33], [34]. These ice storms caused mainly mechanical damage, but fast restoration of service was affected by lack of reliability at critical substations.
Since BSs are known to be efficient and easy to use on already installed insulators, this option seems to be a very interesting solution to this problem [2], [15], [20]. Using BSs is a mitigation option generally in demand for heavy icing conditions. Hence, a review of competing mitigation options under heavy icing conditions is given in the next section.
2.2 Mitigation options under heavy icing conditions
Over the past decades, a large number of studies have been carried out by many research institutions and experts. This includes icing test methods, icing flashover performance, mitigation options. Several parameters and factors affect the dielectric strength of ice-covered insulators, such as the type and density of ice, length of icicles, freezing water conductivity, altitude, profile and type of insulator, and the position and length of ice-free zones (often called air gaps) [1], [21], [23], [24], [28], [29].
The presence of ice on insulators may initiate corona discharge, partial arcs resulting sometimes in flashover, if the required conditions are present. The flashover phenomenon is caused mainly by the presence of a highly conductive water film on the surface of the ice and the reduction in insulator leakage distance caused by ice bridging [35]-[37].
Based on field observations, EHV post station insulators are more susceptible to flashover than line insulators. This is mainly due to their higher electric field strength, smaller shed spacing, larger diameter, and their parallel application concentrated in small areas [1]. One of the main reasons causing significant decrease in flashover voltage of these insulators is the ice-bridging of their shed spacings. It has been shown that some approaches such as using BSs, creepage extenders, use of profiles with greater shed-to-shed
distance, and semiconducting glaze insulators can reduce the probability of the bridging of the insulator sheds by icicles [15], [38], [39].
Reliability of insulators in icing conditions can be improved through several methods. The effectiveness of the solutions for improving their reliability and electrical performance varies in different ice severity. A rough distinction in icing severity for electrical performance includes very light (<1 mm), light (1-6 mm), moderate (6-10 mm) and heavy (>10-mm) ice accretion where the numbers represent radial ice accretion measured on a rotating reference cylinder. This classification is based on full bridging of station post insulators with uniform shed profile at 6 mm and full bridging of cap-and-pin insulator strings at 10 mm [2].
Insulators with close shed-to-shed spacing are more easily bridged by icicles. Once they are fully bridged, their electrical flashover performance will be compromised. For the heavy icing regime, countermeasures such as BSs and semiconducting glaze play roles that are somewhat different from the functions they perform in contaminated conditions [2]. The main mitigation options for heavy icing include:
• the increase in dry arc distance, • semiconducting glaze,
• polymer insulators,
• the increase in leakage distance with the same dry arc distance, • monitoring and washing,
• silicone coatings,
One practical limit on increases in the dry arc distance of station post insulators relates to their cantilever strength requirements. A recommendation to increase dry arc distance by 25% may lead to an increase in post diameter by 33%, which, in turn, leads to additional ice accretion per unit length and a reduced leakage resistance [2]. This negative effect of increased diameter for the same strength requirements can negate the positive effect of additional dry arc distance.
The improved performance of semiconducting glaze insulators in heavy icing conditions is mainly a result of the improved voltage grading along the insulator surface. Moreover, in both laboratory tests and field exposure, these insulators develop larger ice-free zones than conventional glaze posts and develop these zones earlier in the melting phase [38], [40]. The larger the ice-free zones, the higher flashover strength.
Polymer insulators with typical 100 mm shed diameter perform better than IEEE standard disk insulators with 254 mm diameter. This improvement is essentially due to the effect of diameter, rather than any properties of the material [2]. Investigations on the effect of diameter on the electrical performance, supported by tests and modeling [41], also confirm that the flashover strength increases slowly with a reduction of insulator diameter.
One of the most important facets of electrical performance in icing conditions is associated with the partial or complete bridging of insulator leakage distance by icicle growth from shed to shed. The leakage distance of an insulator can be reduced nearly to its dry arcing distance in the worst conditions. More precisely, the effective leakage distance can be reduced to the dry arcing distance under fully bridged conditions. This extreme reduction in leakage distance (by a factor of about 2-3) can result in severe flashovers at
numerous affected utilities [8], [21]. For 15-mm ice accumulation, uniform and alternating profiles gave identical performance per meter of post length [42]. In other words, the performances of the various profiles (standard uniform profile, the alternating profiles, etc.) are indistinguishable in the heavy icing condition.
The possibility of using leakage current activity as a predictor of the probability of icing flashover was studied in [43]. Based on the results, icing rate measurement and the severity of ice accumulation can be achieved by leakage current analysis, e.g. the time evolution of the third and fifth harmonic, the phase angle difference between leakage current and applied voltage. In the continuation of this study, artificial neural network (ANN) models were used to analyze leakage current evolution [44]. The obtained results verify that it is possible to use the proposed ANN model as part of a monitoring system for post insulators during icing events for early warning of potential flashover hazards.
Silicone rubbers have been used as housing material for transmission, distribution, and post insulators [45]. The Room Temperature Vulcanizing (RTV) type is cured in room temperature. The use of RTV silicone coating is generally not recommended on post insulators with shallow shed depth, especially in areas of heavy accumulation of ice, which would lead to full bridging. The loss of electrical strength is partly attributed to the longer duration of ice retention on the rougher RTV surface [2]. However, micro/nano fillers can be added to silicone rubber to improve its properties, such as the surface hydrophobicity, electrical conductivity, relative permittivity and thermal conductivity [46]. Therefore, the final product, e.g. semiconducting RTV coatings in [47], can provide promising results under icing conditions.
Corona rings are metal toroids; their main function is to prevent corona discharges by providing more uniform electric field distributions. They can be applied to any type of high voltage equipment, but they are often associated with nonceramic insulators to ensure a long-term reliability [2], [45]. "Grading rings" is generally used as a synonym for "corona rings", and their main function is to reduce the potential gradient along an insulator, thereby preventing premature electrical breakdown [2], [45]. Since grading rings produce a more uniform electric field, they affect the ionization of bipolar molecules of water and icicle growth. Hence, the result is more uniform shapes of ice accumulations (Figure 2.1) [48]. This phenomenon can especially be observed in the vicinity of the HV electrode, where the electric field is high. Even though uniform icing indicates satisfactory field grading, they can cause unsatisfactory electrical performance under icing conditions, because ice bridges the sheds of the insulator more quickly.
Figure 2.1- Ice accretion on 500-kV polymer insulator with grading ring [48]
A modified grading ring is proposed in [49] that also improves electrical performance under heavy icing conditions (Figure 2.2). It is a standard grading ring that
includes a fine metallic mesh. The metallic mesh must be fine enough to prevent passing water drops through it under icing condition. This modification not only causes a better potential grading but it also creates a large air gap similar to the function of a BS.
(a) (b)
Figure 2.2- Physical appearance of ice-covered insulators with modified grading rings after 15-mm/60 min ice accretion .a) one modified grading ring b) two modified grading rings [49]
Creepage extenders are applied to insulators to increase the creepage (or leakage) distance and shed diameter [2], [45]. They are bonded with an adhesive to the outside edge of the shed. The correct inner diameter of creepage extender must be selected to fit over the sheds. Figure 2.3 shows a common style of slip-on creepage extender with open small gaps. These open gaps face opposite directions in an alternating pattern. Hence, flashover arcs found their way through the open gaps rather than over the edges.
Figure 2.3- Slip-on creepage extender with open gap. (Courtesy of Tyco.)
2.3 Booster sheds under icing conditions
In a Cooperative Research and Development (CRD) collaboration between a utility, manufacturers and UQAC/CIGELE, the improvement in flashover performance of single station post insulators with 655-mm diameter booster sheds was evaluated [18]-[20]. The tests were performed using insulators with a total dry arc distance of 2.7 m and a stress of 105kVrms per meter of dry arc distance. The post station insulators and stress levels correspond to those used on 735-kV substations in Quebec, Canada. The ice was formed with an applied water conductivity of 30|j,S/cm and an ice thickness of 15 or 30 mm on a rotating cylinder. The ice accretion, hardening, and melting sequences followed the IEEE Task Force recommendations defined in [50]. With a 30-mm ice accretion, as the number of BSs increased from four to six, the maximum withstand voltage increased by about 15kV per BS. When the BS positions were arranged to produce the largest air gaps and to prevent ice bridging, the best results for both icing thicknesses were obtained.
A multi-arc model for predicting flashover voltage of ice-covered insulators was introduced in [16]. This mathematical model is based on a previous model developed at
CIGELE [51] using Obenaus/Rizk model [52]. The number of air gaps depends mainly on the insulation profiles, voltage stress and insulator length. Overall results for the various insulators and configurations predicted with the model and experimentally determined are presented in Table 2.1 [16]. Two types of arc were defined- the arcs with one root and others with two roots on the ice surface. Their numbers are N' and N " , respectively, and the total number of arcs is N = N' + N " . Good agreement was achieved between the calculated and experimental results for the insulators without BSs. This result suggests that the multi-arc model can be applied to different types of insulators covered with ice, provided that the number and type of local arcs are properly considered.
Table 2.1- Experimental and calculated results [16] Insulator type
and configuration IEEE standard
Post insulator Post insulator with
booster sheds Arcing distance (cm) 268 270 307 No. of arcs Nf 2 3 2 2 2 N" 1 0 1 2 4
Minimum flashover voltage (kV) Experimental results 300 285 330 From model 285 274 315 360 432 Error (%) 5.0 3.9 4.5 -9.1 -31
For the post insulator with BSs, the best results were obtained in the case of the 3-arc model (N'=2 and N"=l). This suggests that for the three tested types and configurations of insulator strings having an arcing distance longer than 2 m, normally there were three arcs: one at the top, one at the middle part and one at the bottom of insulator string, when the total arc length reaches its critical length.
In this investigation, adding six BSs to the two units of standard post insulators resulted in an increase in dry arcing distance from 2.70 m to 3.07 m, i.e., a 13.7 % increase. Correspondingly, the critical flashover voltage increased 15.7 % for the experimental results; it also corresponded to the critical flashover predictions using the 3-arc model. Then it was concluded that the increase in the critical flashover voltage of post insulators with BSs is mainly due to the increase in the dry arcing distance.
The multi-model can be used to predict the critical flashover voltage of ice-covered insulators provided that the number and type of local arcs are considered properly. On the other hand, in the case of 6 BSs, it seems hard to judge how many arcs formed at the critical point since the flashover process occurs very quickly. Thus, the multi-arc model is not suitable to attain a clear agreement between calculated and experimental results for the insulators with many BSs.
In [17] a method to determine the proper values only for two geometry parameters (i.e. positions and diameters) of three BSs along with one unit of a 735 kV standard ice-covered post insulator was presented. Figure 2.4 shows the considered BS set-up. "L" and "x" are considered as the length of the icicles and lengths of the air gaps, respectively, "e" is the ice thickness and "Re" is clarified in Figure 2.4.
To calculate the diameter of BSs, DBs, based on Figure 2.4 the following equation
can be used:
Figure 2.4-BS set up [17]
Then, to ease the evaluation of the proposed method, the final diameters are summarized in Table 2.2. Position (cm) means the distances between two consecutive BSs.
Table 2.2- Final dimensions of BSs considering the proposed method in [17] BSNo. 1 2 3 Diameter (cm) 99.34 68.35 61.98 Position (cm) 44.9 30.8 28.2
As it is clear form Table 2.2, the calculated diameter for the first BS is much bigger than what is commercially available. Moreover, the calculated positions are not suitable because they would lead to ice-bridging compared to the experimental test results in [2], [18]-[20]. The main problems of the proposed method are:
• using the simulation results of one unit of post insulator unequipped with BSs in the calculations,
• improper approximation of the length of the icicles along BSs,
• imprecise definitions regarding the radius of BS, diameter of insulator, etc.
• inaccurate estimation of the breakdown voltage as a function of the lengths of the air gaps.
Hence, the cited dimensioning method has been upgraded during this PhD project, and good agreements with the previous BS tests in [2] have been achieved. The upgraded model is presented in Chapter 3.
The flashover performance of 500kV porcelain post insulators with and without BSs was investigated in [53]. Test results showed the installation of BSs decelerated icicle growth, ice-bridging, and all of this led to a significant increase of 58% in the flashover voltage of the post insulator. Discharge path was mainly along the icicle and air gaps.
In [15] 0.6-m sections of a standard porcelain station post with 0, 1 or 2 BSs were tested. The maximum withstand voltage stress was reported to be 102 kV/mdry arc untreated,
113 kV/mdiy arc with one and 147kV/mdry arc with two BSs in the icing regime tests.
In [14] strength improvements of 20% at 110 kV and 40% at 400 kV are stated. In addition, the tests in [39] show that the flashover voltage can increase about 50% for the post insulator after adding BSs. The differences in the reported improvements may be related to the test conditions and dimensions of the BSs and the insulators.
2.2.1 Problems of using BSs
One of the major problems of the application of BSs is the pollution issue. BSs can prevent natural washing of some parts of the insulators, and they may lead to glaze damage [1], [2], [21]. For example, under heavy icing conditions, there would be heavy ice on the top surfaces of BSs and none beneath. This situation could cause sufficient electrical stress so that the BSs would either puncture or confine flashover arcs between the neck of the BS and the insulator beneath, as shown in Figure 2.5 and Figure 2.6 [2]. This kind of damage is reported in the laboratory flashover tests, but should not occur in the field if there is no flashover under service voltage. However, if for any reason insulators face a flashover, the BSs should be checked for puncture and the insulators replaced if there is extensive damage beneath [2].
Figure 2.5- Typical puncture damage to BS after heavy, conductive ice test [2]
For good long-term performance more frequent cleaning or washing of insulators is required if they use BSs. Another proposed solution is to install the BSs during winter phase and remove them after winter [1]; however, that is an expensive approach. Moreover, some designs of BS have hemispherical "nubs" that set a small space between BSs and the insulator surface to allow for some natural rain washing (Figure 2.7).
Figure 2.7- Typical booster shed applied to a post insulator (CIGELE Lab.)
2.4 Air gap effects on iced-covered insulators
Since using BSs can cause the formation of the long air gaps on a post insulator, it is necessary to study the role of these air gaps on the electrical performance of the ice-covered insulators. Several Finite Element and Boundary Element Methods (FEM and BEM) have been used for the investigation of ice-covered insulators. A coordination between simulations and experimental tests is often necessary [27], [40], [54]-[61].
Little research has been done on the influence of the number and position of air gaps on the electrical performance of insulators. A few papers have dealt with the influence of air gaps on the potential and electric field distribution along an EHV ceramic post insulator. The experimental and numerical results of voltage distributions of 1, 2, and 3 air gaps along one unit of an ice-covered post insulator show that [35-36]:
• An ice accretion with two air gaps seems to be more dangerous than one with three air gaps.
• During the melting period, around 96% of the applied voltage distributes along the air gaps, regardless of the number, position, and the length of the air gaps.
• It is the total length of air gaps, rather than their number, which is really significant in the process of partial arc formation.
All of the mentioned results were obtained during ice melting conditions, which are the most dangerous conditions for ice-covered insulators. These notes are used to propose an improved hypothesis of the effects of BSs under heavy icing conditions in Chapter 4. They were also used to conclude the minimum required number of BSs for installation on post insulator in order to apply the Taguchi method in the design approach of Chapter 5.
In [61] the influence of the number and position of air gaps on the 50% AC withstand voltage, V5o, of 5 IEEE standard insulator units covered with ice was
experimentally investigated and numerically simulated. The results confirmed again that the number and position of air gaps have significant effects on the flashover voltage of ice-covered insulators. The results also showed that the presence of a partial arc along the air
gap close to the high voltage (HV) electrode leads to a redistribution of the voltage along the ice-covered insulator.
It may be concluded that the effects of the air gaps on post and line insulators under heavy icing conditions are principally similar. Considering this similarity, the results of this PhD research on ice-covered post insulators with BSs could be extended for the applications on line insulators as well.
2.5 Design and optimization methods
Since the objective of this PhD project is the design and optimization of an expensive power system component (i.e. BS), a survey of classical and modern optimization and design methods is necessary.
In a design process, a trial design is analyzed to determine whether it satisfies prescribed requirements. If it is satisfactory, the design process is terminated. In the optimization process, the trial design is analyzed to determine if it is the optimum. Depending on the specifications, "optimum" can have different connotations for different systems. In general, it implies cost-effective, efficient, reliable, and durable systems. Based on the engineering optimization and design books [62], [63], for most engineering projects,
the formulation of a problem consists of 5 steps:
• Step 1 : Project/problem statement • Step 2: Data and information collection
• Step 4: Identification of a criterion to be optimized • Step 5: Identification of constraints
However, the order of the steps can be changed. It is generally accepted that the
formulation of a problem takes roughly 50 percent of the total effort needed to solve it.
Therefore, it is critical to follow well-defined procedures for formulating design optimization problems. However, the design and/or optimization of a system is a creative process that can be quite complex.
Many analytical formulations of optimization and various algorithmic issues arise in the application of different methods in power electric equipment. In fact, electric power equipment optimization problems are difficult to solve because power equipment can be large and complex. Moreover, they are exposed by environment stresses and are influenced by many unexpected events. Therefore, it is necessary to employ most efficient optimization methods to take full advantage in simplifying the formulation and implementing the problem.
In [64], [65] the optimization of locations and dimensions of a corona ring is presented for EHV transmission line composite insulators. In order to set the optimal goal, the finite element method is employed to calculate the electrical field distribution along the composite insulator with corona ring that has various dimensions and locations. Moreover, the neural network model is built to map the location as well as the dimensions of the corona ring and the optimal goal. In these works the optimization is based on finding the maximum field along the insulator surface, such that this maximum field is well below the corona inception level. In design of corona rings, the design parameters are usually the ring
diameter, the diameter of the ring tube, and the position of the ring in its vertical plane. Furthermore, the main criterion of the design is that the maximum field must not exceed the corona inception level.
Potential control inside a switch device using FEM and stochastic optimization algorithm is explained in [66], [67]. It describes the impact of selected insulation elements and the surrounding material, on the magnitude and distribution of electric potential in a switch device. The procedure is based on finite element method numerical analysis and stochastic optimization algorithm of differential evolution (DE). The optimal selection of mutually independent insulation materials has an impact on the control of potential and, consequently, on dielectric strengths, both inside the bushing and in other switchgear elements. The entire modeling procedure also includes optimization of the bushing's geometrical shape.
Optimization for high voltage composite insulators using experimental design theory is developed in [68]. This paper introduces a method for optimizing parameters of HV composite insulators. The optimal values of design parameters are determined by multivariable optimization procedure using theory of Design of Experiments (DOE). For repetitive calculation of the electric field strength the finite element method is used with domain decomposition. This method gives fast working software with accurate results to examine a very complex geometry without high computational effort.
2D and 3D simulations were used in [69] to analyze two stress grading options for 115 kV non-ceramic suspension insulators. The optimization criterion was to reduce the maximum electric field at the surface of the insulator. FEM was used to obtain the electric
field distributions, and different functions of the MATLAB optimization toolbox were used to optimize the design parameters.
In [70] real coded genetic algorithm with simulated binary crossover were used for contour optimization of suspension insulators. The optimization criterion was to reach a desired uniform and minimal tangential field to increase the onset voltage of surface flashover. More precisely, the criterion was to minimize the tangential electric field and make the tangential electric field uniform, respecting the design constraints.
Taguchi method is a generally accepted methodology for modern design of experiments [71]—[73]. It can be used for virtual experiments (e.g. FEM simulations) as well [74]. The problem of using global optimization techniques (e.g. genetic algorithm and particle swarm optimization methods) is that the parameters of the algorithm are hard to detennine. On the other hand, the Taguchi method uses orthogonal arrays to survey a large number of variables with a small number of experiments. So, it is used for optimal designs. An optimal design requires a smaller number of experiments to estimate the parameters with the same precision as a non-optimal design. The results are valid over the whole experimental region covered by the control factors and their settings. Hence, this method reduces costs. Moreover, after the problem formulation process in this PhD project, Taguchi method can provide effectively the required optimality and post-optimality results. Considering these advantages, Taguchi method is used in this project.
2.6 Conclusion
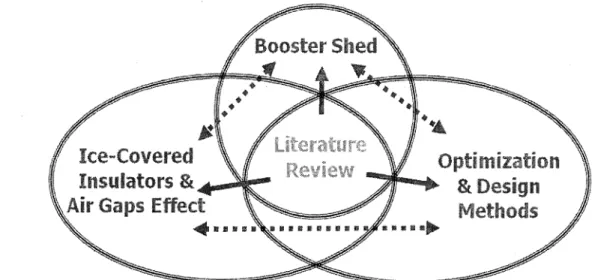
The reviewed literature mainly includes booster shed, ice-covered insulators and air gap effects, and optimization and design methods. It was observed that BSs improve the electrical performance of insulators under icing conditions. The reason for this improvement was attributed to the increase in dry arcing distance and creation of the air gaps. Then, the effects of these air gaps on ice-covered insulators were reviewed briefly, and three main points were emphasized. Finally, the five steps of the classical optimization approach as well as the modern techniques and the selected Taguchi method were introduced. Actually, to propose some feasible solutions to this challenging problem, not only a sufficient background about these three issues is required but also the interactions of all of them should be considered. Figure 2.8 illustrates this concept.
Ice-Covered
Insulators
Optimization
& Design
Methods
CHAPTER 3
UPGRADED MODEL OF BS
DIMENSIONING
CHAPTER 3
UPGRADED MODEL OF BS DIMENSIONING
3.1 Introduction
To advance the previous studies on BSs, this chapter presents an innovative approach of BS dimensioning under heavy ice conditions based on previous laboratory results in [2] and FEM 2D axisymmetric simulations by Comsol Multiphysics™. In fact, it is the upgraded model and approach of [17] which was reviewed and critiqued in Chapter 2. It deals with the two BS parameters (position and diameter) in the installation of 4, 5, and 6 BSs along 2 units of an ice-covered EHV ceramic post station insulator.
3.2 Description and observations of previous BS tests
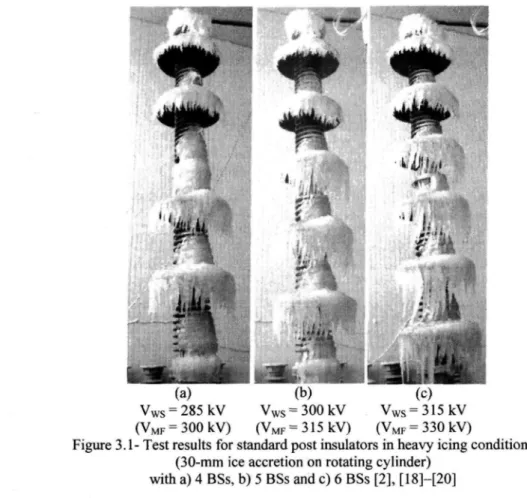
Two units (bottom and middle) of a three-unit station post insulator were tested with a stress of 105 kV per meter of dry arcing distance which is equivalent to the stress on 735 kV substations in Quebec, Canada (Figure 3.1) [2], [18]—[20]. Heavy ice tests were carried out with an applied water conductivity of 30 (aS/cm and ice accumulation of 30-mm on a rotating cylinder. The ice accumulation duration was 140 min, and the applied voltage was set at 285 kV. Each section has a 3500-mm leakage distance and a dry arcing distance of 1390 mm. The BSs that were used have an external diameter of 655 mm. Figure 3.1 shows
4-, 5- and 6-BS configuration tests after the heavy ice accretion in CIGELE climate room [2]. The ice accretion, hardening, and melting sequences followed the IEEE Task Force recommendations defined in [50]. The results of maximum withstand voltages (Vws) and minimum fiashover voltages (VMF) are shown in Figure 3.1.
(a) (b)
Vw s = 285kV VWs = 300kV Vw s = 315kV
(VMF = 300kV) (VMF = 315kV) (VMF = 33OkV)
Figure 3.1- Test results for standard post insulators in heavy icing conditions (30-mm ice accretion on rotating cylinder)
with a) 4 BSs, b) 5 BSs and c) 6 BSs [2], [18]-[20]
BSs installed to a post insulator must have a satisfactory electrical performance under the most dangerous stresses. Based on the literature [35]-[37], a wet-grown ice is more dangerous than a dry-grown one. Thus, the ice formed under wet regime is selected to analyze the electrical performance of the insulator. A wet-grown ice is characterized by the presence of a water film with relatively low resistivity at the ice surface.
The test was repeated 5-6 times for the same configuration and test conditions [2], [50]. In the present study, the individual measured values of the corresponding 5-6 air gaps and icicle lengths of each BS from previous experimental results [2], [18]—[20] were averaged and summarized for those test conditions in Table 3.1 and Table 3.2.
Air gaps play an important role in the flashover process as they are where partial arcs appear and their formation directly depends on the electric field distribution [61]. The use of BSs allows the creation of "controlled" artificial air gaps along the ice-covered insulator.
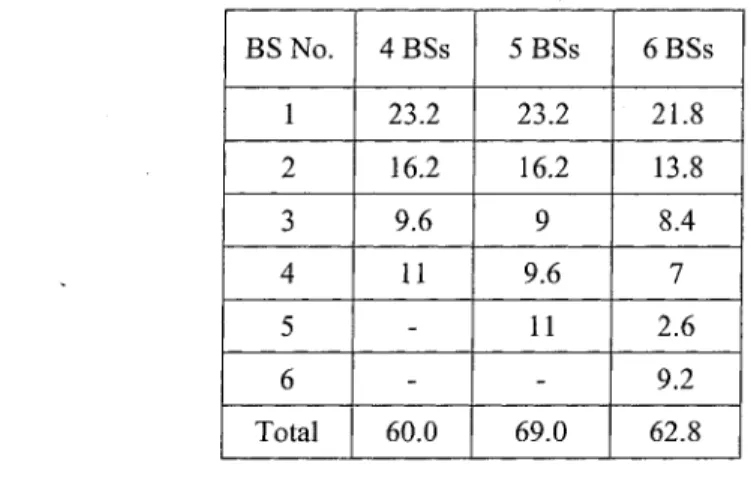
Table 3.1- The average lengths of the air gaps (cm) during the BS tests BSNo. 1 2 3 4 5 6 Total 4 BSs 23.2 16.2 9.6 11 -60.0 5 BSs 23.2 16.2 9 9.6 11 -69.0 6 BSs 21.8 13.8 8.4 7 2.6 9.2 62.8
The length of icicles mainly depends on the accumulation time and the electrical field strength at the area of icicle growth. The average length of the icicles, L, between insulator sheds as a function of the accretion time in the space of insulator sheds is [75]:
Lt(cm) = 0.242t(rmn) (3.1)
Using (3.1) as a primarily approximation for the icicle length on BSs (t=140 min) results in:
Normalization of the lengths of the icicles based on Lo (Normal), can also give us a good understanding of the effect of electric field on the icicle growth along BSs from top to bottom (Table 3.2). There is some tendency for longer icicle length on the BSs that are in regions of lower electrical stress, towards the bottom of the insulator.
Table 3 BSNo. 1 2 3 4 5 6 Total Average perBS
.2- The average lengths of the icicles during the BS (per cm and per-normal (PN) as percent)
4 BSs L(cm) 17.4 20 30 37 -104.4 26.1 L(PN) 51.3 59.0 88.5 109.1 -308 77.0 5 BSs L(cm) 17.4 20 32.2 29.6 26.8 -126 25.2 L(PN) 51.3 59.0 95.0 87.3 79.1 -371.7 74.3 tests 6 BSs L(cm) 19.8 24 29.8 33 37 44 187.6 31.3 L(PN) 58.4 70.8 87.9 97.3 109.1 129.8 553.4 92.2
3 3 Numerical simulations
The simulations were done using the FEM commercial software COMSOL Multiphysics™. With this software surface conductivity and open boundary can be easily implemented. Moreover, to do the comparative calculations faster, 2D axisymmetric modeling was used instead of 3D modeling (Figure 3.2). The potential and the electric field distributions were calculated on the vertical and radial plane (zr-plane). The accuracy of this approach was verified in the previous studies [27], [76].
k h
"I
i i
!
(a) (b) (c)
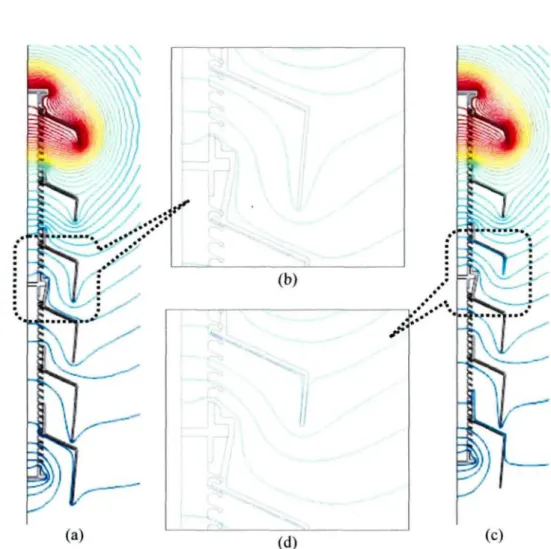
Figure 3.2- Equipotential line distributions of the post insulator with BSs
under heavy wet-grown ice condition: a) 4 BSs b) 5 BSs c) 6 BSs in 2D axisymmetric view
The simulation parameters are summarized in Table 3.3.
Table 3.3-, Simulation parameters
Relative permittivity Conductivity a, O/S/cm) at 20°C Thickness (mm) Porcelain 6 0 -Air 1 0 -Ice 75 0 -Water film 81 30 0.15 Booster shed 2-15 0 5
Next, Table 3.4 demonstrates the comparison of the voltage drops (AV (%)) for 4-, 5- and 6-BS tests. The voltage drops were computed by using reference lines located along the air gaps. More explanations about the modeling method and potential field distributions of all of the BS tests can be found in our previous papers i.e. [77], [78].
Table 3.4-. Comparison of the calculated voltage drops (ÀV (%)) for 4, 5 and 6 BS tests Air gap no.
1 2 3 4 5 6 Total 4 BSs 52.5 23.1 9.8 14.0 -99.4 5 BSs 51.2 20.0 7.9 8.1 12.2 -99.4 6 BSs 50.3 20.8 6.9 6.7 3.1 11.8 99.4
3.4 Procedure for BS dimensioning
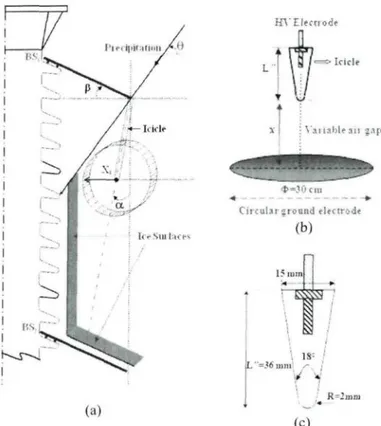
Figure 3.3 illustrates the geometric model for dimensioning two parameters of BSs (i.e. diameter and position). Based on the experimental test results, it is assumed that the tips of hanging icicles and ice surfaces are not contacted.
In Figure 3.3 and the coming equations and tables: DBsi (cm): is the diameter of BSj.
RBSÎ (cm): is the radius of BSi.
Rho-i (cm): is the horizontal distance between the center axis of the insulator and the tip of the installed BSi
y: signifies the zone between BSi and BSj.
einij (cm): is the thickness of ice on the insulator surface in BSy.
(cm): is the thickness of ice accretion on the upper surface of BSj (ebsi ~ 3cm). (cm): is the average exterior diameter of the STD insulator shed under BSi.
Precipitation
Figure 3.3- Geometric model for dimensioning two parameters of BSs (i.e. diameter and position)
P (°): is the inclination angle of BSj (in CIGELE Lab: (3 = 24.5°, upper shed angle of the insulator shed).
9 (°): is the incidence angle of precipitation (0 < 0 , and in CIGELE Lab: 9 = 53±5°). a (°): is the slope angle of the icicles (a ~ 8°, except <XBSI= -15°).
Lj (cm): is the maximum length of the icicles on BSj obtained from experimental results. Wj(cm): is the total insulator length protected from precipitation by BS,.
Pi (cm): is the distance between the extremities of two BSs that determine the position (P) of the BSs.
![Figure 2.1- Ice accretion on 500-kV polymer insulator with grading ring [48]](https://thumb-eu.123doks.com/thumbv2/123doknet/7670556.240034/32.930.214.747.634.894/figure-ice-accretion-kv-polymer-insulator-grading-ring.webp)