HAL Id: hal-01268078
https://hal.inria.fr/hal-01268078
Submitted on 4 Feb 2016
HAL is a multi-disciplinary open access
archive for the deposit and dissemination of
sci-entific research documents, whether they are
pub-lished or not. The documents may come from
teaching and research institutions in France or
abroad, or from public or private research centers.
L’archive ouverte pluridisciplinaire HAL, est
destinée au dépôt et à la diffusion de documents
scientifiques de niveau recherche, publiés ou non,
émanant des établissements d’enseignement et de
recherche français ou étrangers, des laboratoires
publics ou privés.
a Mixed Criticality Embedded System
Antoine Blin, Cédric Courtaud, Julien Sopena, Julia Lawall, Gilles Muller
To cite this version:
Antoine Blin, Cédric Courtaud, Julien Sopena, Julia Lawall, Gilles Muller. Maximizing Parallelism
without Exploding Deadlines in a Mixed Criticality Embedded System. [Research Report] RR-8838,
Inria. 2016. �hal-01268078�
0249-6399 ISRN INRIA/RR--8838--FR+ENG
RESEARCH
REPORT
N° 8838
February 4, 2016without Exploding
Deadlines in a Mixed
Criticality Embedded
System
Antoine Blin, Cédric Courtaud, Julien Sopena, Julia Lawall,
Gilles Muller
RESEARCH CENTRE PARIS – ROCQUENCOURT
System
Antoine Blin, Cédric Courtaud, Julien Sopena, Julia Lawall,
Gilles Muller
Project-Teams Whisper
Research Report n° 8838 — February 4, 2016 — 24 pages
Abstract: Complex embedded systems today commonly involve a mix of real-time and best-effort applications. The recent emergence of small low-cost commodity UMA multicore processors raises the possibility of running both kinds of applications on a single machine, with virtualization ensuring that the best-effort applications cannot steal CPU cycles from the real-time applications. Nevertheless, memory contention can introduce other sources of delay, that can lead to missed deadlines. In this research report, we present a combined offline/online memory bandwidth moni-toring approach. Our approach estimates and limits the impact of the memory contention incurred by the best-effort applications on the execution time of the real-time application. We show that our approach is compatible with the hardware counters provided by current small commodity multicore processors. Using our approach, the system designer can limit the overhead on the real-time appli-cation to under 5% of its expected execution time, while still enabling progress of the best-effort applications.
Résumé : Les systèmes embarqués actuels comprennent des applications temps-réel et des applications «best-effort» au sein d’une même architecture. L’émergence récente de plate-formes multi-cœurs à mémoire partagé uniforme peu onéreuses introduit de nouvelles possibilités quant à l’intégration des deux classes d’applications sur un même calculateur. La virtualisation semble une solution idéale pour faire cohabiter ces deux classes d’applications, l’hyperviseur garantis-sant la propriété d’isolation afin d’éviter que les applications «best effort» ne puissent altérer les applications temps-réel. Toutefois, la contention mémoire peut conduire à un ralentissement du cœur temps-réel par les cœurs «best effort» provoquant ainsi le non-respect de la propriété d’isolement temporel devant être fournie par l’hyperviseur. Dans ce rapport de recherche, nous présentons une approche de contrôle de la bande passante mémoire en deux étapes. Dans une première étape hors ligne nous caractérisations le système mémoire. Dans une seconde étape en ligne, nous utilisons un oracle pour prédire les dégradations temporelles des applications temps-réel dûes à la contention mémoire. Ceci nous permet de circonscrire le surcoût temporel provoqué par la contention mémoire générée par les applications «best effort». Notre approche de contrôle en ligne nécessite uniquement la présence de compteurs de mesures du trafic mémoire. Nous mon-trons que le concepteur du système peut limiter la dégradation des performances temporelles des applications temps-réel en dessous de 5% de leur temps d’exécution nominal tout en maximisant le taux de parallélisme des applications «best-effort».
Contents
1 Introduction 4
2 Problem characterization 6
2.1 Architecture of the SABRE Lite . . . 6 2.2 MiBench . . . 6 2.3 Execution time impact of memory contention . . . 7
3 Approach 9
3.1 Generating constant memory loads . . . 10 3.2 Profiling a real-time application . . . 11 3.3 Run-time system . . . 14
4 Evaluation 15
4.1 Overhead of run-time sampling . . . 15 4.2 Application memory profiles . . . 16 4.3 Efficiency for constant loads . . . 18
5 Limitations of our Approach 20
6 Related Work 20
1
Introduction
In many embedded system domains, such as the automotive industry, it is necessary to run applications with different levels of criticality [13]. Some applications may have nearly hard real-time constraints, while others may need only best-effort access to the CPU and memory resources. A typical example is the car dashboard, which may display both critical real-time information, such as an alarm, and non critical information, such as travel maps and suggestions on how to outsmart traffic. To provide full isolation between application classes, that often run different OS and middleware software stacks, the traditional approach is to rely on separate computer systems. This solution, however, multiplies the hardware cost, and, in a industry where every cent matters, is increasingly unacceptable.
Recent experimental small uniform memory access (UMA) commodity multicore systems, such as the Freescale SABRE Lite [1], offer sufficient CPU power to run multiple applications on a single low-cost computer, and thus represent a promising solution for minimizing hardware cost. Nevertheless, running multiple classes of applications on a single computer raises two main challenges: (i) in terms of compatibility, how to use legacy software stacks with little or no adaptation, and (ii) in terms of dependability, how to isolate real-time applications so that their deadlines are not impacted by other applications. Hypervisors [8, 16, 29] address the first challenge, allowing legacy software stacks to be used without modification. Furthermore, recent hypervisors such as SeL4 [2] and PikeOS [3] that specifically target embedded systems address part of the second challenge, by making it possible to dedicate one or several cores to a class of applications, and thus provide CPU isolation. Still, for many small commodity multicore systems, the memory bus is a shared resource. Therefore, even if CPU isolation is provided, any overuse of memory by the best-effort applications may impact the execution time of the real-time applications.
Existing solutions to the memory sharing problem rely on specific hardware mechanisms. For example, Caccamo et al. [12] rely on a hardware mechanism for measuring the memory bandwidth consumption of each core. Each core is allocated a quota of the total memory bandwidth, and memory consumption is continuously monitored by the OS, which is able to suspend applications in case of overuse. However, most small commodity multicore systems provide only system-wide memory consumption counters, which makes such approaches inapplicable. For instance, on the SABRE Lite it is impossible to attribute a memory transfer to a given core. Alternatively, a baseline approach for sharing a computing system between real-time and best-effort tasks is to just suspend the best-effort applications whenever the real-time applications are running. This approach, however, would lead to a waste of CPU resources and longer latencies for the best-effort tasks.
In this research report, we propose an approach that requires only system-wide memory coun-ters to prevent best-effort applications from excessively impacting a single real-time application. Our solution can thus be employed on current small COTS multicore systems that only provide such counters. Our key observation is that the overhead incurred by the real-time application depends both on the amount of traffic generated on the various cores, and on the ratio between reads and writes in this traffic. To address this issue, we propose (i) a per-application off-line analysis for characterizing the performance overhead induced by increases in memory bandwidth and various read-write ratios, and (ii) a run-time system, implemented within the operating sys-tem or hypervisor, that samples the syssys-tem-wide memory bandwidth and suspends the best-effort applications when the accumulated overhead exceeds the level at which the real-time application can be guaranteed to meet its timing requirements.
Concretely, we first manually analyze the real-time application source code so as to identify phases during which the application does a recurring job that is likely to generate a common
memory access behavior. Then, we construct a per-phase overhead table for the real-time appli-cation based on the results of running it in parallel with a large variety of loads. Finally, at run time, the run-time system periodically samples the global memory bandwidth usage. On each sample, it uses the overhead table to estimate the overhead for the current sample, given the observed global bandwidth. If the accumulated estimated overhead becomes too high, the run-time system suspends all of the best-effort applications, to ensure that the real-run-time application incurs no further overhead. Therefore, the memory contention induced by the best-effort appli-cations will impact the real-time application during at most one sampling period per real-time application activation. When the real-time application ends its computation within the current activation, the best effort applications are resumed.
We have prototyped our approach on a SABRE Lite four-core multicore system using Linux 3.0.35. The run-time system is implemented as a kernel module, enabling it to sample the memory bandwidth using counters available in the memory subsystem, and to suspend and resume the best-effort applications on the best-effort cores. In our experiments, one core runs the real-time application, while one or more of the other three cores run best-effort applications. We assume that an upper bound on the number of active best-effort cores is fixed by the system designer and is thus constant throughout the activations of the real-time application. To emulate real-time applications, we have chosen the MiBench embedded benchmark suite [15] because it targets embedded systems. MiBench has been used in many studies, as reflected by the more than 2500 citations to the MiBench article.1
Our main contributions are the following:
• We introduce a load microbenchmark for characterizing the impact of memory accesses on execution time overhead for a given multicore system. This microbenchmark is configurable in terms of the ratio of reads and writes, and in terms of the delay between sequences of read and write memory accesses.
• We characterize the memory behavior of the MiBench applications. We show that 21 of the 35 MiBench applications may suffer from more than 5% overhead due to memory contention on the SABRE Lite. For applications with high memory demands such as qsort, the overhead is up to 183%.
• We selected 13 MiBench applications that have an overhead greater than 10% without our approach and a short running time of below 50ms. Under a variety of constant loads, 12 of these applications limit the overhead under a chosen threshold of 5%, while the remaining one reached 5.10%.
• We studied the amount of parallelism permitted by our approach. 7 of the applications achieve 70% parallelism for low-bandwidth loads, regardless of the number of active best-effort cores. For the other 6 applications, the gain in parallelism depends on the number of cores used for the best-effort applications. Our results show a substantial increase in parallelism as compared to a baseline solution that suspends the best-effort applications on each activation of the real-time application.
The rest of this research report is organized as follows. Section 2 first presents our target hardware, the SABRE Lite, and MiBench, the benchmark suite that we use. We then illustrate the problem of overhead due to high memory bandwidth on the MiBench applications. Section 3 presents our approach, focusing on our off-line and run-time profiling strategies. Section 4 evaluates our approach on the MiBench applications. Finally, Section 5 discusses some limitations of our approach, Section 6 presents related work, and Section 7 concludes.
2
Problem characterization
In this section, we first describe our target hardware, then present MiBench, and finally present a set of experiments that illustrates in a controlled setting the problem of overhead induced by high memory bandwidth usage.
2.1
Architecture of the SABRE Lite
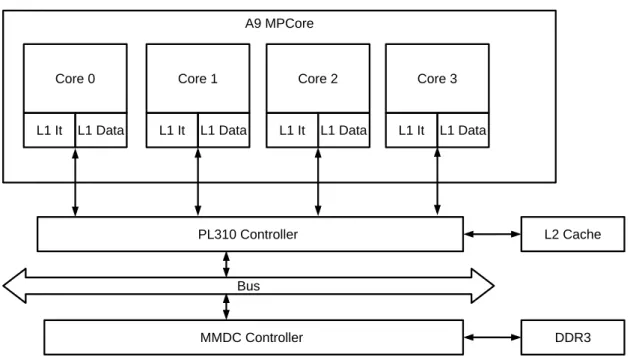
In this research report, we target embedded systems, as used in the automotive domain, which has strong hardware cost requirements. We choose the SABRE Lite multicore system [14] (see Figure 1) since it has already been adopted by some industry leaders as an experimental platform. The processor of the SABRE Lite is an i.MX 6, which is based on a 1.2 GHz quad-core Cortex A9 MPCore [7]. Each core has two 32-kilobyte 4-way set-associative L1 caches, one for data and the other for instructions. Each core is also connected to an external 1-megabyte 16-way set-associative L2 cache [6] which can be either shared across all the cores or partitioned in multiples of 1/16th of the cache size. The Multi Mode DRAM Controller (MMDC) manages access to one gigabyte of DDR3 RAM that can be used by all the cores [14]. Each core contains six configurable hardware counters to gather statistics on the operation of the processor (number of cycles, etc.) and the memory system (L1 accesses, L1 misses, etc.) [4, 5]. The MMDC contains hardware counters that measure global memory traffic (read/write bytes, read/write access, etc.) on the platform [14], but no hardware counter is provided to identify the core that is the source of a L2 miss.
On the SABRE Lite, when using DDR3 RAM, the MMDC is accessible through a single AXI channel. This AXI channel has two dedicated request queues: a 16 entry queue for read requests and a 8 entry queue for write requests. Each request queue entry holds the information to access up to one cache line. A round-robin arbitration mechanism is used to send pending read and write requests into a final reordering buffer, before the request is sent to the RAM. We will show in Figure 5 that this mechanism has a significant impact on the bandwidth that can be achieved when mixing read and write accesses.
2.2
MiBench
Our experiments use the MiBench benchmark suite [15]. MiBench comprises 35 applications in a variety of embedded domains, including Automotive and Industrial Control, Networking, and Telecommunications. We exclude 19 applications that contain x86 code or that relate to long-running or office applications, leaving 16 applications. All of the benchmarks are provided with “large” and “small” data sets. We run the MiBench applications on a 3.0.35 Linux kernel that has been ported by Freescale to the i.MX 6 architecture.2 All MiBench applications are
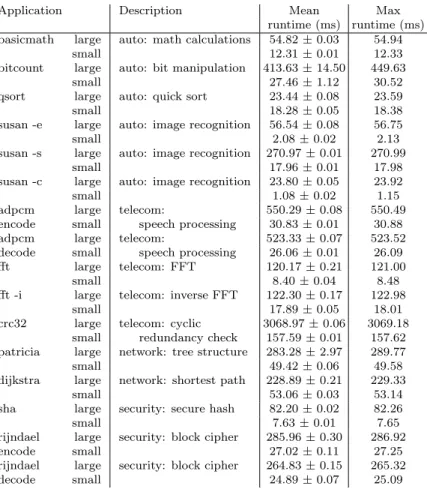
compiled using GGC 4.9.1 with the option -O2. Data inputs are stored in an in-memory file system, to eliminate the cost of disk access. The L2 cache is not partitioned and is only used by the MiBench application running alone on core 0. Each experiment involves 150 runs, where we have discarded the first 20, to minimize variability. Table 1 shows the mean run time, the standard deviation, and the maximum run time. The mean run time ranges from 1 ms for susan small -cto 3 seconds for crc32 large, showing the large spectrum of application types.
Core 0 L1 It L1 Data A9 MPCore PL310 Controller MMDC Controller Bus L2 Cache DDR3 Core 1 L1 It L1 Data Core 2 L1 It L1 Data Core 3 L1 It L1 Data
Figure 1: Architecture of the SABRE Lite board
2.3
Execution time impact of memory contention
Given the capabilities of the SABRE Lite board, one approach to reducing memory contention between classes of applications is to partition the L2 cache. Partitioning the L2 cache among the cores avoids interference at the cache level and limits contention only to the memory bus accesses. Still, reducing the L2 cache size may impact performance for memory demanding applications. We first study the impact of cache partitioning on the performance of applications running alone, and then study the extent to which cache partitioning resolves the problem of memory contention between applications.
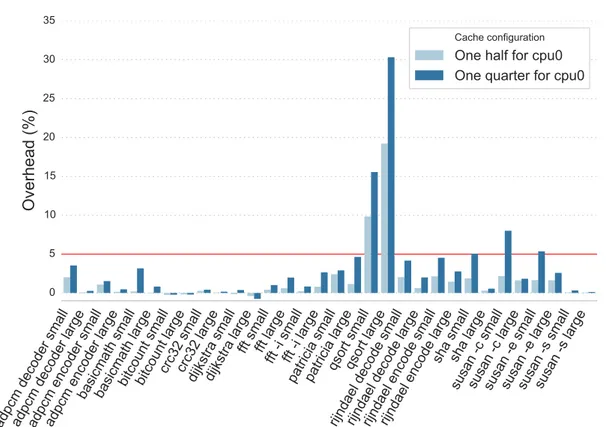
Figure 2 shows the impact of cache partitioning on the performance of the MiBench applica-tions when run alone, as compared to the non-partitioned case. In each case, we have performed 150 runs, and discarded the first 20 results. We compare the maximum execution times, since we care about the worst case. Two configurations are studied: (i) the cache is split in half with one half associated to core 0, running the MiBench application, and the other half associated to the other three cores, (ii) the cache is split in two asymmetric parts, 1/4 being associated to core 0, and 3/4 being shared by the other three cores. The latter setting allows the threads of multi-threaded best-effort applications to share more L2 cache data, thus potentially improving their performance. When the cache size available to the MiBench application is reduced to 1/4, there is a performance degradation of less than 5% on all applications except qsort, susan small -c, and susan small -e. Table 1 shows that susan small -c and susan small -e have the shortest durations of any of the MiBench applications, and thus are particularly sensitive to any overhead. Overall the results suggest that MiBench applications mostly fit into a quarter of the L2 cache and are not memory intensive.
We then study the performance degradation that occurs when the memory bus is highly loaded. We have developed a load program in assembly code that performs repeated memory writes, in such a way as to maximize the probability of an L2 cache miss for each write. When run alone on the SABRE Lite, the generated load is 2020 MB/s. We run the MiBench application
Application Description Mean Max runtime (ms) runtime (ms)
basicmath large auto: math calculations 54.82 ± 0.03 54.94
small 12.31 ± 0.01 12.33
bitcount large auto: bit manipulation 413.63 ± 14.50 449.63
small 27.46 ± 1.12 30.52
qsort large auto: quick sort 23.44 ± 0.08 23.59
small 18.28 ± 0.05 18.38
susan -e large auto: image recognition 56.54 ± 0.08 56.75
small 2.08 ± 0.02 2.13
susan -s large auto: image recognition 270.97 ± 0.01 270.99
small 17.96 ± 0.01 17.98
susan -c large auto: image recognition 23.80 ± 0.05 23.92
small 1.08 ± 0.02 1.15
adpcm large telecom: 550.29 ± 0.08 550.49
encode small speech processing 30.83 ± 0.01 30.88
adpcm large telecom: 523.33 ± 0.07 523.52
decode small speech processing 26.06 ± 0.01 26.09
fft large telecom: FFT 120.17 ± 0.21 121.00
small 8.40 ± 0.04 8.48
fft -i large telecom: inverse FFT 122.30 ± 0.17 122.98
small 17.89 ± 0.05 18.01
crc32 large telecom: cyclic 3068.97 ± 0.06 3069.18
small redundancy check 157.59 ± 0.01 157.62
patricia large network: tree structure 283.28 ± 2.97 289.77
small 49.42 ± 0.06 49.58
dijkstra large network: shortest path 228.89 ± 0.21 229.33
small 53.06 ± 0.03 53.14
sha large security: secure hash 82.20 ± 0.02 82.26
small 7.63 ± 0.01 7.65
rijndael large security: block cipher 285.96 ± 0.30 286.92
encode small 27.02 ± 0.11 27.25
rijndael large security: block cipher 264.83 ± 0.15 265.32
decode small 24.89 ± 0.07 25.09
Table 1: MiBench applications without cache partitioning
on core 0 and one instance of the load program on each of the other three cores. All processes run under the FIFO Linux scheduling policy with maximum priority and are pinned to a core to prevent migration.
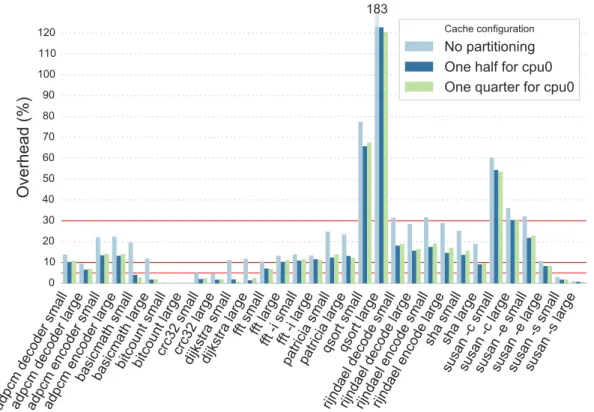
The results are shown in Figure 3. In each case, the baseline is the running time of the application when run alone and without cache partitioning. The overhead ranges up to 183%, in the case of qsort large. For all cases where there is an overhead, the overhead is reduced by partitioning the cache. As the load program evicts cache lines to force memory writes, when all processes share the cache the load program may remove cache lines that are used by the MiBench application. On the other hand, whether the application has access to half of the cache or a quarter of the cache has little impact. We conclude that cache partitioning must be used to reduce memory contention. Still, even when the cache is partitioned, there are 21 cases where a MiBench application running on a given dataset suffers from an overhead that is greater than 5%.
adpcm decoder small
adpcm decoder large
adpcm encoder small
adpcm encoder large
basicmath small
basicmath large
bitcount small
bitcount large
crc32 small
crc32 large
dijkstra small
dijkstra large
fft smallfft large
fft -i small
fft -i large
patricia small
patricia large
qsort small
qsort large
rijndael decode small
rijndael decode large
rijndael encode small
rijndael encode large
sha small
sha large
susan -c small
susan -c large
susan -e small
susan -e large
susan -s small
susan -s large
0 5 10 15 20 25 30 35
Overhead (%)
Cache configurationOne half for cpu0
One quarter for cpu0
Figure 2: Impact of partioning of MiBench performance
3
Approach
We target the setting of an n-core machine, with a real-time application running on one core, and best-effort applications running on some of the remaining cores. The maximum number of active best-effort cores used is chosen in advance by the system designer. Our goals are to obtain as much parallelism between the best effort and real-time applications as possible, as long as the overhead that the best-effort applications introduce on the real-time application remains below a specified threshold. As is standard for real-time computing, we assume that the real-time application is known in advance, that it is periodic, and that it can be profiled to determine its worst-case execution time and worst-case resource consumption properties during each activation. On the other hand, best-effort applications can start and stop at any time, and we do not know any properties of their memory usage.
To achieve our goals, we propose an approach in two stages. The first stage, performed offline by the system designer, begins with a manual analysis of the real-time application source code to identify phases in which the application has a constant memory access behavior (read-write ratio). The system designer then runs the real-time application against a wide range of constant loads, and measures the number of memory accesses and the execution time of each phase, to obtain the phase’s average overall bandwidth and incurred overhead. For this analysis, we have developed a load microbenchmark that makes it possible to generate various loads, in terms of both bandwidth and the read-write access ratio. The result of this profiling stage is a table mapping bandwidths to overheads, for each phase and for each number of active best-effort cores. In the second stage, at run time, a run-time system, integrated into the OS kernel or the
adpcm decoder small
adpcm decoder large
adpcm encoder small
adpcm encoder large
basicmath small
basicmath large
bitcount small
bitcount large
crc32 small
crc32 large
dijkstra small
dijkstra large
fft smallfft large
fft -i small
fft -i large
patricia small
patricia large
qsort small
qsort large
rijndael decode small
rijndael decode large
rijndael encode small
rijndael encode large
sha small
sha large
susan -c small
susan -c large
susan -e small
susan -e large
susan -s small
susan -s large
0 10 20 30 40 50 60 70 80 90 100 110 120
Overhead (%)
Cache configurationNo partitioning
One half for cpu0
One quarter for cpu0
183
Figure 3: Impact of load on MiBench performance depending on the partioning scheme hypervisor, samples the system memory bandwidth and uses the overhead table obtained from the profiling stage to accumulate a running sum that conservatively overestimates the maximum possible accumulated overhead for the current sampling period of the real-time application. If the estimated accumulated overhead is greater than the threshold specified by the system designer, the run-time system suspends all of the best-effort applications. Suspended applications are allowed to run again when the real-time application completes its current activation.
In the rest of this section, we describe the various analyses and mechanisms that support our approach. All further experiments are done with a partitioned cache so as to focus on contention at the level of the memory subsystem. We use the 1/4 - 3/4 L2 partitioning scheme, which we have shown to provide sufficient cache space for the MiBench applications and which maximizes the space available to the best-effort applications.
3.1
Generating constant memory loads
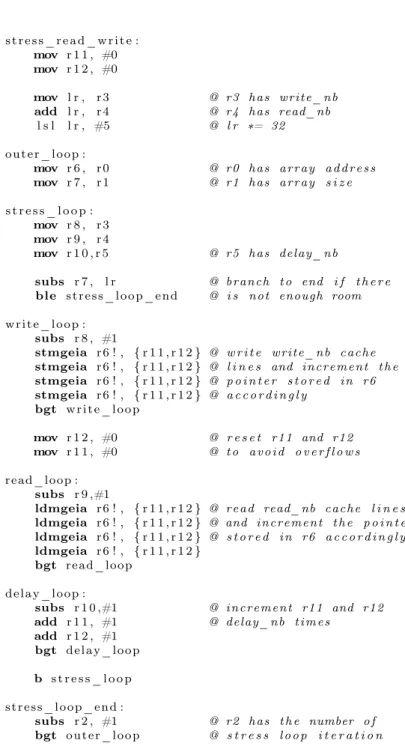
The experiments in Section 2.3 used a load program that generates a worst case in terms of write accesses. To increase the range of generated memory bandwidths, we develop a microbenchmark that extends the previous load program such that a set of write accesses interleaves with a set of read accesses, so as to induce competition between the write and read request queues. We also make it possible to add a delay between memory accesses using a wait loop.
Figure 4 shows the read and write loops of the microbenchmark. Our experimental analysis of the memory bandwidth behavior of a real-time application runs the application in parallel with one or more instances of this microbenchmark, each pinned to its own core. We vary the
ratio of read and write accesses in the read and write loops, such that the sum is 10 (e.g., 3 reads per 7 writes). A sum of 10 permits a variety of read-write ratios. To take into account both symmetric and asymmetric loads, we consider numbers of wait-loop iterations of the form 1x (one load), 1x, 1x and 1x, 2x (two loads), and 1x, 1x, 1x and 1x, 2x, 3x (three loads), for various values of x between 0 and 8000. We have observed that the traffic resulting from a delay of 8000 has essentially no impact on the real-time application. In each run, we obtain the execution time by measuring elapsed CPU cycles, and obtain the memory bandwidth of all running instances by measuring the number of exchanged bytes using the counters of the memory controller.
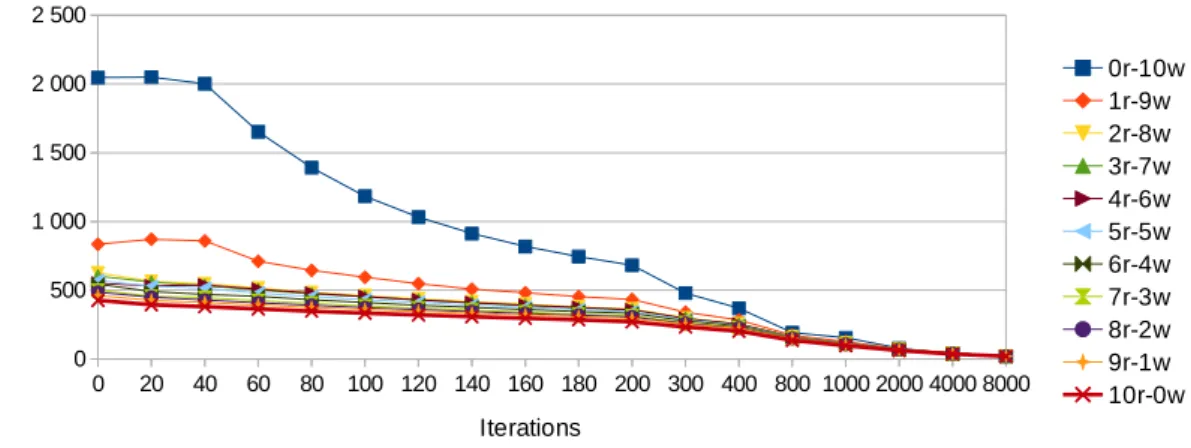
To illustrate the behavior of the microbenchmark, we run it alone on core 0, for the targeted range of read-writes ratios and numbers of wait-loop iterations. The obtained bandwidths are presented in Figure 5. The highest bandwidth (2020MB/s) is obtained when only write requests are generated and there are no wait-loop iterations. This configuration produces the highest bandwidth because the controller does not have to wait for write completion, in contrast to the case of reads. Mixing read and write requests, furthermore introduces competition for accessing the reordering buffer, which results in substantially lower bandwidths.
3.2
Profiling a real-time application
In order to be able to compute a conservative estimate of the overhead incurred by an application in the face of arbitrary loads, we compute offline a profile of each real-time application, reflecting the worst-case overhead that the application incurs when run in parallel with a wide range of constant loads. Our approach assumes that the real-time application traffic does not vary over a considered period of time, i.e., a phase. Therefore, we first identify phases that have this property in the real-time application, using a combination of manual source code examination and memory profiling. Then, the profile for an application is constructed in two steps: data collection and overhead estimation.
In the data collection step, we first run the application in isolation a number of times, and col-lect the maximal observed execution time, ExecT , and the observed number of memory accesses, Acc, for the run having the maximum execution time. We then run the application a number of times in parallel with a range of constant loads, l, and likewise collect for each load and for each phase p the execution times, ExecTl,p, and the number of memory accesses Accl,pobserved
in each run. From the latter, for each run with a load l and for each phase p of the real-time application, we then compute the average observed bandwidth as ObsBl,p = Accl,p/ExecTl,p,
and the overhead as Ovdl,p= (ExecTl,p/ExecT ) − 1. The result of this step is a set of mappings
of bandwidths ObsBl,p to overheads Ovdl,pfor the given real-time application. For each
map-ping, we furthermore note the number of load processes, the read-write ratio and the number of wait-loop iterations used to generate the load l, and the current phase p.
As the data collection step works on average bandwidths collected over entire (phase) runs, the result does not cover the complete set of memory bandwidths that can be observed during a given execution at a finer granularity. To be able to estimate the overheads incurred for arbitrary memory bandwidths, we extrapolate from the observed data values using least squares polynomial fitting, as implemented by the polyfit function of the Python numpy library.3 The
construction of an appropriate polynomial raises two challenges. First, least squares polynomial fitting requires choosing an appropriate degree, and second, least squares polynomial fitting produces a polynomial that is as close as possible to all of the points, while we want a polynomial that is a conservative approximation of the overhead and thus that sits just above all of the points. To choose the degree, we take a brute force approach of trying a number of possible degrees, and determining via simulation which gives the best results. We have designed a simulator that
stress_read_write :
mov r 1 1 , #0
mov r 1 2 , #0
mov l r , r3 @ r3 has write_nb
add l r , r4 @ r4 has read_nb
l s l l r , #5 @ l r ∗= 32
outer_loop :
mov r 6 , r0 @ r0 has array address
mov r 7 , r1 @ r1 has array s i z e
s t r e s s _ l o o p :
mov r 8 , r3
mov r 9 , r4
mov r 1 0 , r 5 @ r5 has delay_nb
subs r 7 , l r @ branch to end i f t h e r e
ble stress_loop_end @ i s not enough room
write_loop :
subs r 8 , #1
stmgeia r6 ! , { r 1 1 , r 1 2 } @ w r i t e write_nb cache
stmgeia r6 ! , { r 1 1 , r 1 2 } @ l i n e s and increment the
stmgeia r6 ! , { r 1 1 , r 1 2 } @ p o i n t e r s t o r e d in r6 stmgeia r6 ! , { r 1 1 , r 1 2 } @ a c c o r d i n g l y bgt write_loop mov r 1 2 , #0 @ r e s e t r11 and r12 mov r 1 1 , #0 @ to avoid o v e r f l o w s read_loop : subs r 9 ,#1
ldmgeia r6 ! , { r 1 1 , r 1 2 } @ read read_nb cache l i n e s
ldmgeia r6 ! , { r 1 1 , r 1 2 } @ and increment the p o i n t e r
ldmgeia r6 ! , { r 1 1 , r 1 2 } @ s t o r e d in r6 a c c o r d i n g l y
ldmgeia r6 ! , { r 1 1 , r 1 2 }
bgt read_loop
delay_loop :
subs r 1 0 ,#1 @ increment r11 and r12
add r 1 1 , #1 @ delay_nb times
add r 1 2 , #1
bgt delay_loop
b s t r e s s _ l o o p stress_loop_end :
subs r 2 , #1 @ r2 has the number o f
bgt outer_loop @ s t r e s s loop i t e r a t i o n
0 20 40 60 80 100 120 140 160 180 200 300 400 800 1000 2000 4000 8000 0 500 1 000 1 500 2 000 2 500 0r-10w 1r-9w 2r-8w 3r-7w 4r-6w 5r-5w 6r-4w 7r-3w 8r-2w 9r-1w 10r-0w Iterations B an d w id th ( M B /s )
Figure 5: Bandwidth of the microbenchmark run in isolation
takes as input an execution trace, consisting of periodic samples of the overall memory bandwidth of a real-time application running with some loads, and a table mapping memory bandwidths to overheads for the given application. The simulator then estimates the total overhead on the application for the given execution trace. We assess the accuracy of the overhead obtained for each possible polynomial degree, as compared to the actual observed overhead, using the simulator and execution traces for a variety of constant loads. Based on these results, we choose the degree that gives the lowest error, measured using residual sum of squares (RSS), between the estimated overhead and the actual overhead for the largest number of read-write ratios. We consider only degrees between 1 and 5, to avoid the erratic behavior that is characteristic of high degree polynomials.
Least squares polynomial fitting interpolates a polynomial that closely matches the complete set of data points. To instead construct a polynomial that tracks the greatest overheads, we interpolate a polynomial individually for each of the read-write ratios, with various delays, and then take the maximum value of any of these polynomials for each bandwidth of interest. To avoid the result being excessively influenced by polynomial values that are not near any observed data points, we include a polynomial in the maximum load computation only for bandwidths that exceed the maximum observed bandwidth by at most 5%. For bandwidths that are beyond this point for all read-write ratios, we use the overhead inferred for the bandwidth that is 5% beyond the overall maximum observed bandwidth. This value is used up to 3000MB/s. Beyond that value, we consider the overhead to be 0%. Indeed, we have only seen bandwidths over 3000 in the first sample of our experiments with loads; in the rest of the samples, in all executions of the MiBench applications with loads, the overall bandwidth never exceeds 2000 MB/s.
The above procedure approximates the overhead for a given observed bandwidth in the case of a constant load. To be more general, we also consider the possibility that the load changes within the sampling interval. For example, if the overall bandwidth is 400MB/s during the first quarter of a sampling interval, and is 300MB/s in the rest of the sampling interval, then the sampling process will observe an overall bandwidth of 325MB/s. To address this imprecision, we follow a packing strategy, that estimates the worst-case overhead that can be incurred when the load changes once within each sampling interval. For this, we consider how the overall bandwidth ObsBobserved within a sampling interval can be decomposed into two other bandwidths ObsB1
and ObsB2 and fractions of a sampling interval t1 and t2, where 0 ≤ t1, t2 ≤ 1, such that
of multiples of 20.48 MB/s, which is the granularity of the tables used by our runtime system (see Section 3.3), between 0 and 3000, such that, without loss of generality, ObsB1< ObsB2and
such that the values of t1 and t2are in the required range.
For each of the pairs of possible observed bandwidths, we estimate the sample overhead as follows. Based on the polynomial analysis, each of the observed bandwidths ObsB1 and ObsB2
is associated with an overhead on the real-time application in the case of a constant load. To determine the effect of combining the bandwidths within a single sample, we observe that the overhead, which was calculated in terms of running times, also reflects the ratio between the amount of bandwidth, Req, required by the real-time application within a sampling period and the amount of bandwidth, ObtB, that the real-time application actually obtains. Req is simply the bandwidth observed when the real-time application is run alone. ObtB can be computed from the overhead OvdB for a given constant bandwidth ObsB, as ObtB = Req/(OvdB + 1). From the obtained bandwidth information, we then compute the overhead incurred in the context of the overall observed bandwidths ObsB1and ObsB2 as Ovd = Req/(t1· ObtB1+ t2· ObtB2). For
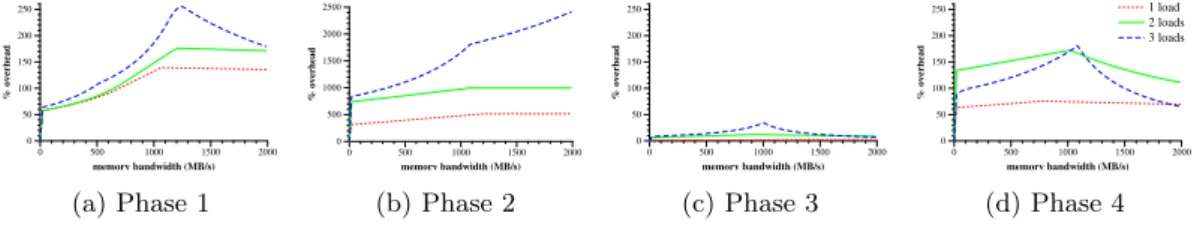
the resulting overhead table, we take the maximum overhead satisfying all of the criteria. Figure 6 shows the overhead tables for the four phases of susan small -c. The second phase has an estimated overhead for all bandwidths up to 10 times higher than the other phases, but as shown subsequently in Figure 7i, this phase has a very short duration. In all of the phases, there is a high point around 1000 MB/s, and then the overhead drops off. The drop off represents the fact that if the application is to achieve such a high bandwidth, then it must in some way have taken over the memory bus, and is incurring delay on the best-effort tasks. Note that the average bandwidths per phase, based on which the overheads are interpolated, typically only go slightly beyond the high point, but that greater bandwidths are observed in practice at finer granularities. 0 500 1000 1500 2000 memory bandwidth (MB/s) 0 50 100 150 200 250 % overhead (a) Phase 1 0 500 1000 1500 2000 memory bandwidth (MB/s) 0 500 1000 1500 2000 2500 % overhead (b) Phase 2 0 500 1000 1500 2000 memory bandwidth (MB/s) 0 50 100 150 200 250 % overhead (c) Phase 3 0 500 1000 1500 2000 memory bandwidth (MB/s) 0 50 100 150 200 250 % overhead 1 load 2 loads 3 loads (d) Phase 4
Figure 6: Overheads associated with the four phases of Susan small -c. Phase 2 has estimated overheads 10 times greater than the other phases.
3.3
Run-time system
The run-time system is implemented as a Linux kernel module that periodically samples the memory bandwidth. At the end of each sampling interval, the run-time system obtains the overhead associated with the bandwidth observed in the current sample and suspends all best-effort applications if the result of adding this overhead to a running sum becomes greater than the desired threshold.4 Since we target an embedded system with predefined real-time applications,
the kernel module contains all the necessary information, including the overhead tables and the maximum allowed overhead.
4Technically, we take the threshold minus the proportion of the application execution time represented by
one sample, to ensure that the worst case of no progress in the next sample will not cause the overhead on the real-time application to exceed the threshold.
Sampling is triggered by a timer interrupt on one of the cores dedicated to best-effort ap-plications. On each timer interrupt, the value of the memory subsystem counter is read and then reset to 0. The estimated overhead associated with the current sample is obtained from the appropriate overhead table according to the number of active best-effort cores. To make look up in this table efficient, we structure the table such that the required index can be obtained by a right shift of the value of the memory subsystem counter, i.e., the number of memory accesses in the current sample. The amount to shift is chosen as a tradeoff between the need to limit the table size, and the need to avoid rounding error. We choose a shift of 10, which has the effect of dividing the number of bytes by 1024. As motivated subsequently in Section 4.1, we use a sampling interval of 50µs. Each successive entry in the overhead table thus represents a bandwidth increment of 20.48MB/s. This approach introduces an approximation at two levels: the overhead is that of a bandwidth resulting from rounding down to the nearest multiple of 20.48 and in practice the sampling intervals are not all exactly 50µs. Nevertheless, this approach imposes little overhead on the best-effort core running the run-time system, thus maximizing the parallelism between the real-time application and the best-effort applications.
Finally, to suspend the best-effort applications, when the expected overhead exceeds the threshold, we modified the Linux kernel to add a new inter-processor interrupt. When suspension is required, the run-time system sends an IPI to the best-effort cores. Each best-effort task is preempted by the IPI handler that then loops on a flag signaling the end of the real-time task activation. When the real-time application ends its current activation, the flag is set, the IPI handlers end and the best effort tasks resume their executions.
At the end of each activation of the real-time application, the run-time system performs a L1 cache flush on core 0. Doing so avoids incurring cache writebacks at the beginning of the next activation, and thus ensures a constant read-write ratio in the first phase of the application, as was intended by the choice of phase boundaries. Placing the flush after the application’s activation best exploits any available slack time to avoid incurring any extra load on the real-time application.
4
Evaluation
Our goals for our approach are first to ensure that the execution time of the real-time application is not excessively impacted by the effort applications and second to ensure that the best-effort applications run as long as they do not impact the real-time ones. In the rest of this section, we evaluate the efficiency of our approach on the MiBench applications that, as shown in Figure 2, can have an overhead greater than 10% without our approach and that have a running time of at most 50ms. We focus on applications with short running times, since in these cases the duration of a single sample represents a high percentage of the overall run time, thus introducing the greatest risk of exceeding the overhead threshold.
Our approach has been prototyped in Linux 3.0.35. The L2 cache is partitioned such that 1/4 is allocated to the real-time application and 3/4 is allocated to the best effort ones. We set the overhead threshold to 5%, as 5% is commonly viewed as a lower bound on the precision of performance measurements.
Before presenting the results of our experiments, we first discuss the overhead due to the sampling frequency and present the memory profiles for selected applications.
4.1
Overhead of run-time sampling
The higher the sampling frequency, the faster the system will react when there is a possibility of exceeding the acceptable overhead. However, sampling relies on interrupts which, at high
frequency, risk inducing a substantial overhead on any best effort application that runs on the core that performs the monitoring.
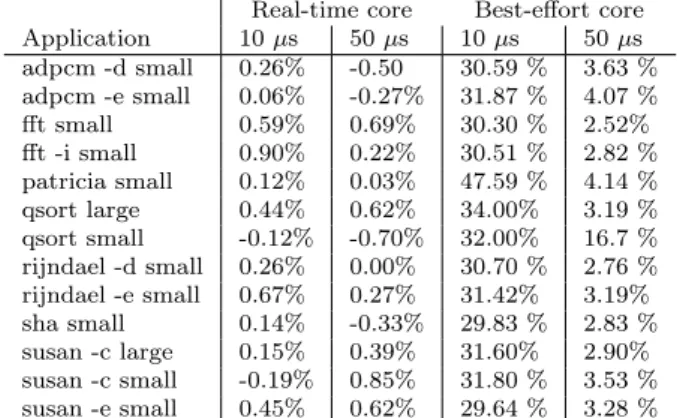
To evaluate the cost of sampling, we use again the MiBench applications, and measure the slowdown incurred when using a 10µs or a 50µs sampling period, as shown in Table 2. When sampling runs on the same core as a MiBench application, here playing the role of a best-effort application, the overhead for a 10µs sampling interval is up to 209%. Such an overhead is too penalizing for best-effort applications. By choosing a 50µs sampling period, the sampling only induces an overhead of up to 27%, and is thus compatible with our goal of improving parallelism between real-time and best effort applications. On the other hand, when sampling runs on a different core from the MiBench application, here playing the role of a real-time application, the overhead on the MiBench application is always below 1% and is sometimes negative.
Real-time core Best-effort core
Application 10 µs 50 µs 10 µs 50 µs adpcm -d small 0.26% -0.50 30.59 % 3.63 % adpcm -e small 0.06% -0.27% 31.87 % 4.07 % fft small 0.59% 0.69% 30.30 % 2.52% fft -i small 0.90% 0.22% 30.51 % 2.82 % patricia small 0.12% 0.03% 47.59 % 4.14 % qsort large 0.44% 0.62% 34.00% 3.19 % qsort small -0.12% -0.70% 32.00% 16.7 % rijndael -d small 0.26% 0.00% 30.70 % 2.76 % rijndael -e small 0.67% 0.27% 31.42% 3.19% sha small 0.14% -0.33% 29.83 % 2.83 % susan -c large 0.15% 0.39% 31.60% 2.90% susan -c small -0.19% 0.85% 31.80 % 3.53 % susan -e small 0.45% 0.62% 29.64 % 3.28 %
Table 2: Overhead of sampling on MiBench applications
Choosing a 50µs sampling period, however, also implies that to be able to stop the best-effort applications within 1% of the running time, the duration of the application must be at least 5ms. Of the MiBench applications, susan small -c and susan small -e have shorter durations. The maximum running time for susan -c small is 1.15ms which means that each sample equals 4.3% of the application duration. The maximum running time for susan -e small is 2.13ms which means that each sample equals 2.3% of the application duration. By cutting 1 sample before the 5% threshold, we reduce the parallelism but still respect the desired threshold.
4.2
Application memory profiles
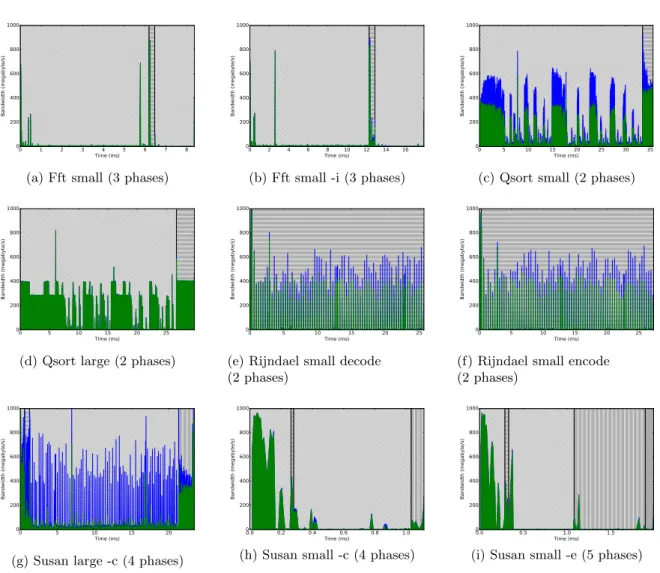
Figure 7 shows the memory profiles for the selected applications that exhibit different phases. Write accesses (blue) are shown on top of read accesses (green).
Phases are typically delimited by loops in the source code. Our approach assumes that a single memory access patterns recurs throughout a phase. Still there are some variations within the phases for some MiBench applications, for example in the case of qsort. We find that our estimated overheads are sufficient to protect the real-time application as long as the read-write ratio remains roughly constant during a phase. Note that some of the phases are very small, such as the first phase of rijndael and the second phase of susan small.
0 1 2 3 4 5 6 7 8 Time (ms) 0 200 400 600 800 1000 Bandwidth (megabyte/s)
(a) Fft small (3 phases)
0 2 4 6 8 10 12 14 16 Time (ms) 0 200 400 600 800 1000 Bandwidth (megabyte/s) (b) Fft small -i (3 phases) 0 5 10 15 20 25 30 35 Time (ms) 0 200 400 600 800 1000 Bandwidth (megabyte/s)
(c) Qsort small (2 phases)
0 5 10 15 20 25 Time (ms) 0 200 400 600 800 1000 Bandwidth (megabyte/s)
(d) Qsort large (2 phases)
0 5 10 15 20 25 Time (ms) 0 200 400 600 800 1000 Bandwidth (megabyte/s)
(e) Rijndael small decode (2 phases) 0 5 10 15 20 25 Time (ms) 0 200 400 600 800 1000 Bandwidth (megabyte/s)
(f) Rijndael small encode (2 phases) 0 5 10 15 20 Time (ms) 0 200 400 600 800 1000 Bandwidth (megabyte/s)
(g) Susan large -c (4 phases)
0.0 0.2 0.4 0.6 0.8 1.0 Time (ms) 0 200 400 600 800 1000 Bandwidth (megabyte/s)
(h) Susan small -c (4 phases)
0.0 0.5 1.0 1.5 Time (ms) 0 200 400 600 800 1000 Bandwidth (megabyte/s)
(i) Susan small -e (5 phases)
Read Write Phase 1 Phase 2 Phase 3 Phase 4 Phase 5
4.3
Efficiency for constant loads
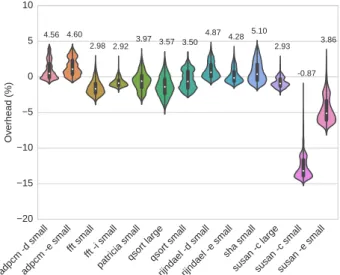
We study the impact of using our approach when running the selected MiBench applications while running loads with all the read-write ratios considered when creating the overhead tables. Each experiment involves 30 runs, of which we drop the first 10 results, and keep the maximum duration. In total, for each application, there are 18 different load values, with 11 different read-write ratios and 5 configurations of loads on best-effort cores. This leads to 990 experiments and 19800 valid runs.
We calculate the overhead on a MiBench application by measuring its running time at the end of the activation with the running time of the application alone. Figure 8 shows the overhead distribution for each application in the form of a violin plot. The width of a violin at a particular overhead value indicates the number of runs of the application that exhibit that overhead. The maximum overhead is reached by sha small with an overhead of 5.10 %. All other applications have an overhead under 5 %. The large variations in the overheads of susan small -c and susan small -eare due to their small execution times. Indeed, any external perturbation, such as a Linux clock tick, that occurs during the execution of the application, results in a huge timing variation.
adpcm -d smalladpcm -e small fft smallfft -i small
patricia smallqsort largeqsort smallrijndael -d smallrijndael -e smallsha smallsusan -c largesusan -c smallsusan -e small
20 15 10 5 0 5 10 Overhead (%) 4.56 4.60 2.98 2.92 3.97 3.57 3.50 4.87 4.28 5.10 2.93 -0.87 3.86
Figure 8: Overhead for MiBench applications with constant loads
We next study the degree of parallelism we can obtain for applications, with various loads. Figure 9 shows the worst-case degree of parallelism for the applications for all of the studied configurations, among the 20 considered runs in each case. These results show clearly that the degree of parallelism achieved for the various applications differs greatly. This suggests the need for our application-specific profiles. For 7 of the 13 applications, all configurations achieve at least 70% parallelism when the loads become dominated by non memory related computations: both adpcms, both ffts, both rijndaels, and sha small. For the remaining applications, except qsort largeand susan small -c, the degree of parallelism depends highly on the number of active best-effort cores. Finally, Qsort large and susan small -c start with a long memory intensive phase (see Figure 7d), during which the overhead threshold is always reached.
0 1000 2000 3000 4000 5000 6000 7000 8000 Iterations 0 20 40 60 80 100 Parallelism (%)
(a) Adpcm encode small
0 1000 2000 3000 4000 5000 6000 7000 8000 Iterations 0 20 40 60 80 100 Parallelism (%)
(b) Adpcm decode small
0 1000 2000 3000 4000 5000 6000 7000 8000 Iterations 0 20 40 60 80 100 Parallelism (%) (c) Fft small 0 1000 2000 3000 4000 5000 6000 7000 8000 Iterations 0 20 40 60 80 100 Parallelism (%) (d) Fft small -i 0 1000 2000 3000 4000 5000 6000 7000 8000 Iterations 0 20 40 60 80 100 Parallelism (%)
(e) Patricia small
0 1000 2000 3000 4000 5000 6000 7000 8000 Iterations 0 20 40 60 80 100 Parallelism (%) (f) Qsort small 0 1000 2000 3000 4000 5000 6000 7000 8000 Iterations 0 20 40 60 80 100 Parallelism (%) (g) Qsort large 0 1000 2000 3000 4000 5000 6000 7000 8000 Iterations 0 20 40 60 80 100 Parallelism (%)
(h) Rijndael encode small
0 1000 2000 3000 4000 5000 6000 7000 8000 Iterations 0 20 40 60 80 100 Parallelism (%)
(i) Rijndael decode small
0 1000 2000 3000 4000 5000 6000 7000 8000 Iterations 0 20 40 60 80 100 Parallelism (%) (j) Sha small 0 1000 2000 3000 4000 5000 6000 7000 8000 Iterations 0 20 40 60 80 100 Parallelism (%) (k) Susan large -c 0 1000 2000 3000 4000 5000 6000 7000 8000 Iterations 0 20 40 60 80 100 Parallelism (%) (l) Susan small -e 0 1000 2000 3000 4000 5000 6000 7000 8000 Iterations 0 20 40 60 80 100 Parallelism (%) (m) Susan small -c [1] [1, 2] [1,1] [1,2,3] [1,1,1]
5
Limitations of our Approach
A challenge in applying our approach is the large number of runs that have to be performed in advance to construct the overhead tables. Nevertheless, we have shown that it is sufficient to consider constant loads, and that the packing strategy ensures that the results are safely applicable to executions in the presence of non-constant loads.
We have tested our approach with a sampling interval of 50µs, to minimize the impact on the best-effort applications. Our approach furthermore assumes that within a phase the application maintains a constant memory access behavior. Not all applications satisfy these properties. Furthermore, our overhead tables are constructed off line, based on the worst-case expected run-time behavior. As is standard for worst-case execution time (WCET) analysis for real-time systems, the resulting tables can be overly conservative, if the application behaves very differently on some input data sets. A solution could be to exploit the phases that we have identified in the applications, by modifying the real-time application so that it signals phase changes to the run-time system. At the point of a phase change, the run-time system could discard the current overhead estimate, and compute the actual value, based on the precomputed offset of the phase change within the real-time application execution. We leave this to future work.
6
Related Work
A variety of approaches have been proposed to reduce the impact of memory contention on process execution times. These range from offline approaches, in which a Worst Case Execution Time (WCET) is computed that takes memory contention into account, to various changes to software, hardware, or a combination of both, to reduce or eliminate the impact of memory contention on application execution times.
WCET approaches Pellizzoni et al. [24] have developed a method for calculating the WCET in a multicore context, building on methods used in a single-core context. Nowotsch et al. [22] have identified the problems of interaction and contention in the context of an ARINC 653 parti-tioned avionic environment executing on a multicore platform. Bin et al. [9, 10] have developed a methodology to compute the WCET of avionic applications sharing the same multicore system. Jean et al. [17] have studied the problem of WCET for multicore processors in the context of an embedded hypervisor in the context of avionic systems.
Our approach relies on run-time monitoring and can benefit from any advance in WCET computation.
Software approaches Caccamo et al. [12] and Yun et al. [31] have developed mechanisms for sharing the memory bandwidth in the context of a multicore architecture with no shared cache. First, they measure the memory traffic generated by each core, using the hardware L1 miss counter. Then, they pause the cores that are generating too much traffic. We target hardware that has a shared L2 cache, on which the number of L1 cache misses does not reflect the memory bandwidth usage.
Muralidhara et al. [21] use an 8-core hardware platform connected to the main memory by several channels, each independently controlling a portion of the physical memory. The interferences between applications can thus, in theory, be eliminated, if the data used by each application are associated with one or more dedicated channels. Applications that do not interfere can be grouped on the same channel. Liu et al. [19] combine cache coloring with the partitioning by channel in the Linux kernel in order to partition the cache and the memory.
Seo et al. [27] use hardware counters to calculate the number of retries necessary for a request generated by the last level cache to be accepted by the memory controller. This information is used to determine the memory contention level. Then, they construct a model relating the level of memory contention to the application performance, and use this model to schedule the tasks that consume the most memory on the same core. This study targets whole system performance improvement, while we aim first to protect real-time applications.
Hardware approaches Ungerer et al. [30] have designed a multicore architecture for appli-cations having varying degrees of criticality that permits a safe computation of the WCET. Lickly et al. [18] propose a new multithreaded architecture for executing hard real-time tasks that provides precise and predictable timings.
Moscibroda et al. [20] propose a new memory controller designed to provide memory access fairness across different consumers. Shah et al. [28] present a new scheduling policy for the bus arbiter that mixes a time-division based policy that is designed to respect real-time constraints and a static priority based policy that is designed to have good performance. In the context of a chip-multiprocessing system where the number of processors is greater than or equal to the number of tasks, Schoeberl et al. [26] propose a Time Division Multiple Access memory arbiter to control access to the main memory.
All of these approaches involve hardware that does not currently exist, while our approach targets COTS machines.
Mixed approaches Pellizzoni et al. [23] propose an approach in which hardware buffers are introduced that make it possible to schedule accesses to shared resources in such a way as to avoid that two consumers/producers simultaneously access the same resources. Applications must be structured into phases that have particular memory-access properties and are thus able to take advantage of the resource guarantees provided by the scheduler. Even if such hardware were available, the approach would not be compatible with legacy best-effort applications, which are not structured in the required way. Boniol et al. [11] propose an algorithm for restructuring applications automatically to fit the requirements of such a system. Finally, Rafique et al. [25] designed a fair bandwidth sharing memory controller able to spread memory bandwidth across all the consumers, which is coupled to a feedback-based adaptive bandwidth sharing policy managed by the operating system.
Our approach requires neither new hardware nor any changes to the best-effort application source code.
7
Conclusion and Future Work
In this research report, we have presented an approach permitting to mix applications with different levels of criticality on a single small COTS multicore machine, while bounding the over-head that the real-time application can incur due to memory-demanding best-effort applications. Our approach relies on an off-line analysis of the real-time application, and a run-time system that controls the scheduling of the best-effort applications. No modifications to the best-effort applications are required. Our approach allows the best-effort applications to run concurrently with the real-time application as long as the overhead limit on the real-time application can be guaranteed to be respected. We have investigated the feasibility of the approach on MiBench applications, and found the limits both in terms of sampling and phase precision. We have stud-ied the behavior of the 13 MiBench applications that incur an overhead of over 10% without our mechanism and are of short duration. Of these, 12 always incur an overhead of less than 5% with
our mechanism, regardless of the load, and one incurs an overhead of 5.10%. Furthermore, 7 achieve 70% of parallelism for low-bandwidth loads, regardless of the number of active best-effort cores.
Currently, our approach suspends all best-effort applications as soon as the possibility of an excessive delay is detected. To further increase the amount of time in which best-effort applications are allowed to run, alternate approaches could be considered that reduce the demand of the best effort applications incrementally. One approach would be to slow down the clock speed of the best effort cores, when the hardware permits this operation (the SABRE Lite hardware does not). Another approach would be to suspend only the best-effort processes running on the core having the greatest L1 cache activity. Unlike L2 cache activity, which is global to the system, measuring core-specific L1 cache activity is possible on standard processors, because the L1 cache is core specific. A third approach would be to exploit the different bandwidth requirements of the different phases of the real-time application. As phases with low bandwidth requirements incur little delay, regardless of the overall memory traffic, it could be possible to restart the best-effort applications when the real-time application enters such a phase. All of these approaches would require degrading the execution of the best-effort applications well before reaching the overhead threshold, to ensure that this threshold continues to be respected.
Finally, our approach currently accommodates only one time application, or multiple real-time applications without preemption. Handling multiple real-real-time applications with preemption would require switching real-time application profiles when a real-time application is preempted by another. We leave this to future work.
References
[1] Freescale boards. http://www.freescale.com/webapp/sps/site/overview.jsp?code= SABRE_HOME{}&fsrch=1&sr=1&pageNum=1.
[2] Okl4 microvisor. http://www.ok-labs.com/products/okl4-microvisor. [3] PikeOS. http://www.sysgo.com.
[4] ARM. ARM Architecture Reference Manual ARMv7-A and ARMv7-R edition, rev C.b, November 2012.
[5] ARM. Cortex-A9 Technical Reference Manual, rev r4p1, June 2012.
[6] ARM. Level 2 Cache Controller L2C-310 Technical Reference Manual, rev r3p3, June 2012. [7] ARM. Cortex-A9 MPCore Technical Reference Manual, June rev r4p1, 2012.
[8] P. Barham, B. Dragovic, K. Fraser, S. Hand, T. Harris, A. Ho, R. Neugebauer, I. Pratt, and A. Warfield. Xen and the art of virtualization. In SOSP, pages 164–177, 2003.
[9] J. Bin, S. Girbal, D. G. Perez, A. Grasset, and A. Merigot. Studying co-running avionic real-time applications. In Embedded Real Time Software and Systems (ERTS), Feb. 2014. [10] J. Bin, S. Girbal, D. G. Perez, and A. Merigot. Using monitors to predict co-running
safety-critical hard real-time benchmark behavior. In International Conference on Information and Communication Technology for Embedded Systems (ICICTES), Jan. 2014.
[11] F. Boniol, H. Cassé, E. Noulard, and C. Pagetti. Deterministic execution model on COTS hardware. In International Conference on Architecture of Computing Systems (ARCS), pages 98–110. Springer-Verlag, 2012.
[12] M. Caccamo, R. Pellizzoni, L. Sha, G. Yao, and H. Yun. Memguard: Memory bandwidth reservation system for efficient performance isolation in multi-core platforms. In RTAS, pages 55–64, 2013.
[13] C. Ficek, N. Feiertag, K. Richter, and M. Jersak. Applying the AUTOSAR timing protection to build safe and efficient ISO 26262 mixed-criticality systems. In Embedded Real Time Software and Systems (ERTS), Feb. 2012.
[14] S. Freescale. i.MX 6Dual/6Quad Applications Processor Reference Manual, rev 1, April 2013.
[15] M. R. Guthaus, J. S. Ringenberg, D. Ernst, T. M. Austin, T. Mudge, and R. B. Brown. MiBench: A free, commercially representative embedded benchmark suite. In Workload Characterization, IEEE International Workshop, pages 3–14, 2001.
[16] H. Härtig, M. Hohmuth, J. Liedtke, S. Schönberg, and J. Wolter. The performance of µkernel-based systems. In SOSP, pages 66–77, 1997.
[17] X. Jean, M. Gatti, D. Faura, L. Pautet, and T. Robert. A software approach for managing shared resources in multicore ima systems. In Digital Avionics Systems Conference (DASC), 2013 IEEE/AIAA 32nd, pages 7D1–1–7D1–15, Oct. 2013.
[18] B. Lickly, I. Liu, S. Kim, H. D. Patel, S. A. Edwards, and E. A. Lee. Predictable pro-gramming on a precision timed architecture. In International Conference on Compilers, Architectures and Synthesis for Embedded Systems (CASES), pages 137–146. ACM, 2008. [19] L. Liu, Z. Cui, M. Xing, Y. Bao, M. Chen, and C. Wu. A software memory partition
approach for eliminating bank-level interference in multicore systems. In 21st International Conference on Parallel Architectures and Compilation Techniques (PACT), pages 367–376, 2012.
[20] T. Moscibroda and O. Mutlu. Memory performance attacks: Denial of memory service in multi-core systems. In 16th USENIX Security Symposium (SS), pages 18:1–18:18, 2007. [21] S. P. Muralidhara, L. Subramanian, O. Mutlu, M. Kandemir, and T. Moscibroda. Reducing
memory interference in multicore systems via application-aware memory channel partition-ing. In IEEE/ACM International Symposium on Microarchitecture, pages 374–385, 2011. [22] J. Nowotsch and M. Paulitsch. Leveraging multi-core computing architectures in avionics.
In EDCC, pages 132–143, May 2012.
[23] R. Pellizzoni, E. Betti, S. Bak, G. Yao, J. Criswell, M. Caccamo, and R. Kegley. A pre-dictable execution model for COTS-based embedded systems. In RTAS, pages 269–279, Apr. 2011.
[24] R. Pellizzoni, A. Schranzhofer, J.-J. Chen, M. Caccamo, and L. Thiele. Worst case delay analysis for memory interference in multicore systems. In Design, Automation Test in Europe Conference Exhibition (DATE), 2010, pages 741–746, Mar. 2010.
[25] N. Rafique, W.-T. Lim, and M. Thottethodi. Effective management of DRAM bandwidth in multicore processors. In Parallel Architecture and Compilation Techniques (PACT), pages 245–258, Sept. 2007.
[26] M. Schoeberl and P. Puschner. P.: Is chip-multiprocessing the end of real-time scheduling. In 9th International Workshop on Worst-Case Execution Time (WCET) Analysis, 2009. [27] D. Seo, H. Eom, and H. Y. Yeom. MLB: A memory-aware load balancing for mitigating
memory contention. In 2014 Conference on Timely Results in Operating Systems (TRIOS 14), 2014.
[28] H. Shah, A. Raabe, and A. Knoll. Priority division: A high-speed shared-memory bus arbi-tration with bounded latency. In Design, Automation Test in Europe Conference Exhibition (DATE), pages 1–4, Mar. 2011.
[29] U. Steinberg and B. Kauer. NOVA: A microhypervisor-based secure virtualization architec-ture. In EuroSys, pages 209–222, 2010.
[30] T. Ungerer, F. Cazorla, P. Sainrat, G. Bernat, Z. Petrov, C. Rochange, E. Quinones, M. Gerdes, M. Paolieri, J. Wolf, H. Casse, S. Uhrig, I. Guliashvili, M. Houston, F. Kluge, S. Metzlaff, and J. Mische. Merasa: Multicore execution of hard real-time applications supporting analyzability. IEEE Micro, 30(5):66–75, Sept. 2010.
[31] H. Yun, G. Yao, R. Pellizzoni, M. Caccamo, and L. Sha. Memory access control in mul-tiprocessor for real-time systems with mixed criticality. In 24th Euromicro Conference on Real-Time Systems (ECRTS), pages 299–308, July 2012.
Domaine de Voluceau, - Rocquencourt