HAL Id: hal-02344068
https://hal.archives-ouvertes.fr/hal-02344068
Submitted on 3 Nov 2019HAL is a multi-disciplinary open access archive for the deposit and dissemination of sci-entific research documents, whether they are pub-lished or not. The documents may come from teaching and research institutions in France or abroad, or from public or private research centers.
L’archive ouverte pluridisciplinaire HAL, est destinée au dépôt et à la diffusion de documents scientifiques de niveau recherche, publiés ou non, émanant des établissements d’enseignement et de recherche français ou étrangers, des laboratoires publics ou privés.
SPARC/IO3C/GAW, 2019: SPARC/IO3C/GAW
Report on Long-term Ozone Trends and Uncertainties in
the Stratosphere. (SPARC Report No. 9, GAW Report
No. 241, WCRP-17/2018)
Irina Petropavlovskikh, Sophie Godin-Beekmann, Daan Hubert, Robert
Damadeo, Birgit Hassler, Viktoria Sofieva
To cite this version:
Irina Petropavlovskikh, Sophie Godin-Beekmann, Daan Hubert, Robert Damadeo, Birgit Hassler, et al.. SPARC/IO3C/GAW, 2019: SPARC/IO3C/GAW Report on Long-term Ozone Trends and Uncertainties in the Stratosphere. (SPARC Report No. 9, GAW Report No. 241, WCRP-17/2018). 78 p., 2019, �10.17874/f899e57a20b�. �hal-02344068�
Core Project of the WMO/ISC/IOC World Climate Research Programme
SPARC/IO3C/GAW Report on
Long-term Ozone Trends and
Uncertainties in the Stratosphere
I. Petropavlovskikh, S. Godin-Beekmann, D. Hubert, R. Damadeo, B. Hassler, V. Sofieva
SPARC/IO3C/GAW Report on Long-term Ozone
Trends and Uncertainties in the Stratosphere
February 2019
Prepared by the SPARC LOTUS Activity,
edited by I. Petropavlovskikh, S. Godin-Beekmann, D. Hubert, R. Damadeo, B. Hassler, and V. Sofieva
SPARC Report No. 9, GAW Report No. 241, WCRP Report 17/2018
LO N G -T ER M O ZONE TRE NDS AND UNCERTAINTIES IN TH E S TR ATO SP H ER E
LOTUS
Citation
SPARC/IO3C/GAW, 2019: SPARC/IO3C/GAW Report on Long-term Ozone Trends and Uncertainties in the Stratosphere. I. Petropavlovskikh, S. Godin-Beekmann, D. Hubert, R. Damadeo, B. Hassler, V. Sofieva (Eds.), SPARC Report No. 9, GAW Report No. 241, WCRP-17/2018, doi: 10.17874/f899e57a20b, available at www.sparc-climate.org/publications/sparc-reports. Electronic version available at http://www.sparc-climate.org/publications/sparc-reports/sparc-report-no9
ISSN 2296-5785 (Print)
iii
SPARC/IO3C/GAW LOTUS Report Authors & Reviewers
Irina Petropavlovskikh (1) NOAA Earth System Research Laboratory
(2) CIRES, University of Colorado USA
Sophie Godin-Beekmann LATMOS-IPSL, CNRS/UVSQ/Sorbonne University France
Daan Hubert Royal Belgian Institute for Space Aeronomy (BIRA-IASB) Belgium
SPARC LOTUS Activity leaders
Irina Petropavlovskikh (1) NOAA Earth System Research Laboratory (2) CIRES, University of Colorado USA
Sophie Godin-Beekmann LATMOS-IPSL, CNRS/UVSQ/Sorbonne University France
Daan Hubert Royal Belgian Institute for Space Aeronomy (BIRA-IASB) Belgium
Robert Damadeo NASA Langley Research Center USA
Birgit Hassler Deutsches Zentrum für Luft- und Raumfahrt (DLR), Institut für Physik der Atmosphäre Germany
Viktoria F. Sofieva Finnish Meteorological Institute Finland
Stacey M. Frith (1) Science Systems and Applications Inc.
(2) NASA Goddard Space Flight Center USA
Kleareti Tourpali Aristotle University of Thessaloniki Greece
Authors and Contributors
Robert Damadeo NASA Langley Research Center USA
Birgit Hassler Deutsches Zentrum für Luft- und Raumfahrt (DLR), Institut für Physik der Atmosphäre Germany
Viktoria F. Sofieva Finnish Meteorological Institute Finland
Working group leaders of the SPARC LOTUS Activity
Executive Summary Chapter lead authors
Sophie Godin-Beekmann LATMOS-IPSL, CNRS/UVSQ/Sorbonne University France
Irina Petropavlovskikh (1) NOAA Earth System Research Laboratory (2) CIRES, University of Colorado USA
Daan Hubert Royal Belgian Institute for Space Aeronomy (BIRA-IASB) Belgium
Chapter 1: Introduction Chapter lead authors
Irina Petropavlovskikh (1) NOAA Earth System Research Laboratory (2) CIRES, University of Colorado USA
Viktoria F. Sofieva Finnish Meteorological Institute Finland
Chapter 2: Observations and model data Chapter lead authors
Neil R.P. Harris Cranfield University United Kingdom
Fiona Tummon Federal Office of Meteorology and Climatology, MeteoSwiss Switzerland
Donald J. Wuebbles University of Illinois USA
iv
SPARC/IO3C/GAW LOTUS ReportData providers
John Anderson School of Science, Hampton University USA
Omaira E. García IARC, Agencia Estatal de Meteorología (AEMET) Spain
James W. Hannigan National Center for Atmospheric Research (NCAR) USA
Bryan J. Johnson NOAA Earth System Research Laboratory, Global Monitoring Division USA
Nicholas B. Jones University of Wollongong Australia
Emmanuel Mahieu University of Liège Belgium
Ankie J. M. Piters Royal Netherlands Meteorological Institute (KNMI) The Netherlands
Françoise Posny Laboratoire de l’Atmosphère et des Cyclones (LACy), UMR8105, Saint-Denis, Réunion France
Richard Querel National Institute of Water and Atmospheric Research (NIWA) New Zealand
Dan Smale National Institute of Water and Atmospheric Research (NIWA) New Zealand
René Stübi Federal Office of Meteorology and Climatology, MeteoSwiss Switzerland
Daan P.J. Swart National Institute for Public Health and the Environment (RIVM) The Netherlands
David W. Tarasick Environment and Climate Change Canada, Toronto Canada
Anne M. Thompson NASA Goddard Space Flight Center USA
Matthew B. Tully Bureau of Meteorology Australia
Joanna A.E. van Gijsel Faculty of Geo-Information Science and Earth Observation, University of Twente The Netherlands
Roeland Van Malderen Royal Meteorological Institute of Belgium (RMIB) Belgium
Ray Wang School of Earth and Atmospheric Sciences, Georgia Institute of Technology USA
Jacquelyn C. Witte (1) Science Systems and Applications Inc. (2) NASA Goddard Space Flight Center USA
CCMI modelers
Slimane Bekki LATMOS-IPSL, CNRS, Paris France
Neal Butchart Met Office Hadley Centre United Kingdom
Martyn P. Chipperfield University of Leeds United Kingdom
Makoto Deushi Meteorological Research Institute (MRI) Japan
Sandip S. Dhomse University of Leeds United Kingdom
Steven C. Hardiman Met Office Hadley Centre United Kingdom
Co-authors
Stacey M. Frith (1) Science Systems and Applications Inc. (2) NASA Goddard Space Flight Center USA
Kleareti Tourpali Aristotle University of Thessaloniki Greece
Corinne Vigouroux Royal Belgian Institute for Space Aeronomy (BIRA-IASB) Belgium
Jeannette D. Wild (1) Innovim, LLC, Greenbelt, MD (2) NOAA/NCEP/Climate Prediction Center USA
William T. Ball (1) Institute for Atmospheric and Climate Science, ETH Zurich (2) Physikalisch-Meteorologisches Observatorium Davos - World Radiation Center Switzerland
Kai-Lan Chang National Research Council Fellow at NOAA Earth System Research Laboratory USA
Sean M. Davis (1) NOAA Earth System Research Laboratory (2) CIRES, University of Colorado USA
Doug A. Degenstein University of Saskatchewan Canada
Lucien Froidevaux Jet Propulsion Laboratory, California Institute of Technology USA
Sophie Godin-Beekmann LATMOS-IPSL, CNRS/UVSQ/Sorbonne University France
Daan Hubert Royal Belgian Institute for Space Aeronomy (BIRA-IASB) Belgium
Alexandra Laeng KIT, Institute of Meteorology and Climate Research (IMK-ASF) Germany
Thierry Leblanc Jet Propulsion Laboratory, California Institute of Technology USA
Eliane Maillard Barras Federal Office of Meteorology and Climatology, MeteoSwiss Switzerland
Herman G.J. Smit Institute of Energy and Climate Research at Forschungszentrum Jülich Germany
v
SPARC/IO3C/GAW LOTUS Report
William T. Ball (1) Institute for Atmospheric and Climate Science, ETH Zurich (2) Physikalisch-Meteorologisches Observatorium Davos - World Radiation Center Switzerland
Robert Damadeo NASA Langley Research Center USA
Stacey M. Frith (1) Science Systems and Applications Inc. (2) NASA Goddard Space Flight Center USA
Kleareti Tourpali Aristotle University of Thessaloniki Greece
Jeannette D. Wild (1) Innovim, LLC, Greenbelt, MD (2) NOAA/NCEP/Climate Prediction Center USA
Christos S. Zerefos Research Centre for Atmospheric Physics and Climatology, Academy of Athens Greece
Michaela I. Hegglin University of Reading United Kingdom
Patrick Jöckel Deutsches Zentrum für Luft- und Raumfahrt (DLR), Institut für Physik der Atmosphäre Germany
Douglas Kinnison National Center for Atmospheric Research (NCAR) USA
Jean-François Lamarque National Center for Atmospheric Research (NCAR) USA
Martine Michou Météo-France CNRM France
Olaf Morgenstern National Institute of Water and Atmospheric Research (NIWA) New Zealand
Fiona M. O'Connor Met Office Hadley Centre United Kingdom
Luke D. Oman NASA Goddard Space Flight Center USA
Giovanni Pitari Department of Physical and Chemical Sciences, Università dell’Aquila Italy
David A. Plummer Environment and Climate Change Canada, Montreal Canada
Laura E. Revell Bodeker Scientific New Zealand
Eugene Rozanov (1) Physikalisch-Meteorologisches Observatorium Davos - World Radiation Center (2) Institute for Atmospheric and Climate Science, ETH Zurich Switzerland
David Saint-Martin CNRM/GMGEC/AMACS France
Robyn Schofield (1) School of Earth Sciences, University of Melbourne (2) ARC Centre of Excellence for Climate System Science Australia
Andrea Stenke Institute for Atmospheric and Climate Science, ETH Zurich Switzerland
Kane A. Stone (1) School of Earth Sciences, University of Melbourne (2) ARC Centre of Excellence for Climate System Science
*Now at: Department of Earth, Atmospheric, and Planetary Science, MIT Australia
Simone Tilmes National Center for Atmospheric Research (NCAR) USA
Daniele Visioni Department of Physical and Chemical Sciences, Università dell’Aquila Italy
Guang Zeng National Institute of Water and Atmospheric Research (NIWA) New Zealand
Daan Hubert Royal Belgian Institute for Space Aeronomy (BIRA-IASB) Belgium
Viktoria F. Sofieva Finnish Meteorological Institute Finland
Chapter 3: Challenges for trend studies Chapter lead authors
Contributing authors
Justin Alsing Center for Computational Astrophysics, Flatiron Institute, NY *Now at : Oskar Klein Centre for Cosmoparticle Physics, Stockholm University USA
Kostas Eleftheratos Dep. of Geology and Geoenvironment, National and Kapodistrian University of Athens Greece
Sophie Godin-Beekmann LATMOS-IPSL, CNRS/UVSQ/Sorbonne University France
John Kapsomenakis Research Centre for Atmospheric Physics and Climatology, Academy of Athens Greece
Jean-Christopher Lambert Royal Belgian Institute for Space Aeronomy (BIRA-IASB) Belgium
Thierry Leblanc Jet Propulsion Laboratory, California Institute of Technology USA
Gerald E. Nedoluha Remote Sensing Division, Naval Research Laboratory USA
Wolfgang Steinbrecht Deutscher Wetterdienst, Meteorological Observatory Hohenpeissenberg Germany
René Stübi Federal Office of Meteorology and Climatology, MeteoSwiss Switzerland
vi
SPARC/IO3C/GAW LOTUS ReportRobert Damadeo NASA Langley Research Center USA
Birgit Hassler Deutsches Zentrum für Luft- und Raumfahrt (DLR), Institut für Physik der Atmosphäre Germany
Contributing authors
Justin Alsing Center for Computational Astrophysics, Flatiron Institute, NY *Now at : Oskar Klein Centre for Cosmoparticle Physics, Stockholm University USA
Dimitris Balis Aristotle University of Thessaloniki Greece
Melanie Coldewey-Egbers Deutsches Zentrum für Luft- und Raumfahrt (DLR), Inst. für Methodik der Fernerkundung Germany
Kostas Eleftheratos Dep. of Geology and Geoenvironment, National and Kapodistrian University of Athens Greece
Sophie Godin-Beekmann LATMOS-IPSL, CNRS/UVSQ/Sorbonne University France
Aleksandr Gruzdev A.M. Obukhov Institute of Atmospheric Physics, Russian Academy of Science Russia
John Kapsomenakis Research Centre for Atmospheric Physics and Climatology, Academy of Athens Greece
Alexandra Laeng KIT, Institute of Meteorology and Climate Research (IMK-ASF) Germany
Marko Laine Finnish Meteorological Institute Finland
Eliane Maillard Barras Federal Office of Meteorology and Climatology, MeteoSwiss Switzerland
Michael Taylor Department of Meteorology, University of Reading United Kingdom
Thomas von Clarmann KIT, Institute of Meteorology and Climate Research (IMK-ASF) Germany
Mark Weber Institute of Environmental Physics, University of Bremen Germany
Jeannette D. Wild (1) Innovim, LLC, Greenbelt, MD (2) NOAA/NCEP/Climate Prediction Center USA
Birgit Hassler Deutsches Zentrum für Luft- und Raumfahrt (DLR), Institut für Physik der Atmosphäre Germany
Robert Damadeo NASA Langley Research Center USA
Chapter 5: Time series and trend results Chapter lead authors
Chapter 4: The LOTUS regression model Chapter lead authors
Daniel J. Zawada University of Saskatchewan Canada
Stacey M. Frith (1) Science Systems and Applications Inc. (2) NASA Goddard Space Flight Center USA
William T. Ball (1) Institute for Atmospheric and Climate Science, ETH Zurich
(2) Physikalisch-Meteorologisches Observatorium Davos - World Radiation Center Switzerland
Kai-Lan Chang National Research Council Fellow at NOAA Earth System Research Laboratory USA
Doug A. Degenstein University of Saskatchewan Canada
Daan Hubert Royal Belgian Institute for Space Aeronomy (BIRA-IASB) Belgium
Stergios Misios University of Oxford United Kingdom
Irina Petropavlovskikh (1) NOAA Earth System Research Laboratory (2) CIRES, University of Colorado USA
Chris Z. Roth University of Saskatchewan Canada
Viktoria F. Sofieva Finnish Meteorological Institute Finland
Wolfgang Steinbrecht Deutscher Wetterdienst, Meteorological Observatory Hohenpeissenberg Germany
Kleareti Tourpali Aristotle University of Thessaloniki Greece
Christos S. Zerefos Research Centre for Atmospheric Physics and Climatology, Academy of Athens Greece
Co-authors
Kai-Lan Chang National Research Council Fellow at NOAA Earth System Research Laboratory USA
Viktoria F. Sofieva Finnish Meteorological Institute Finland
Kleareti Tourpali Aristotle University of Thessaloniki Greece
vii
SPARC/IO3C/GAW LOTUS Report
Justin Alsing Center for Computational Astrophysics, Flatiron Institute, NY *Now at : Oskar Klein Centre for Cosmoparticle Physics, Stockholm University USA
Dimitris Balis Aristotle University of Thessaloniki Greece
Melanie Coldewey-Egbers Deutsches Zentrum für Luft- und Raumfahrt (DLR), Inst. für Methodik der Fernerkundung Germany
Kostas Eleftheratos Dep. of Geology and Geoenvironment, National and Kapodistrian University of Athens Greece
Aleksandr Gruzdev A.M. Obukhov Institute of Atmospheric Physics, Russian Academy of Science Russia
John Kapsomenakis Research Centre for Atmospheric Physics and Climatology, Academy of Athens Greece
Alexandra Laeng KIT, Institute of Meteorology and Climate Research (IMK-ASF) Germany
Marko Laine Finnish Meteorological Institute Finland
Michael Taylor Department of Meteorology, University of Reading United Kingdom
Mark Weber Institute of Environmental Physics, University of Bremen Germany
Jeannette D. Wild (1) Innovim, LLC, Greenbelt, MD (2) NOAA/NCEP/Climate Prediction Center USA
Contributing authors
Reviewers
Gufran Beig Indian Institute of Tropical Meteorology (Ministry of Earth Sciences, Govt. of India) India
Greg E. Bodeker Bodeker Scientific New Zealand
Pablo O. Canziani University of Buenos Aires Argentina
Martin Dameris Deutsches Zentrum für Luft- und Raumfahrt (DLR), Institut für Physik der Atmosphäre Germany
Richard D. Eckman NASA USA
James Keeble Centre for Atmospheric Science, University of Cambridge United Kingdom
Paul A. Newman NASA Goddard Space Flight Center USA
Scott Osprey NCAS, University of Oxford United Kingdom
Richard S. Stolarski Department of Earth and Planetary Sciences, Johns Hopkins University USA
Susann Tegtmeier GEOMAR Helmholtz Centre for Ocean Research Kiel Germany
Matthew B. Tully Bureau of Meteorology Australia
Claus Zehner European Space Agency (ESA/ESRIN) Italy
Stacey M. Frith (1) Science Systems and Applications Inc. (2) NASA Goddard Space Flight Center USA
William T. Ball (1) Institute for Atmospheric and Climate Science, ETH Zurich (2) Physikalisch-Meteorologisches Observatorium Davos - World Radiation Center Switzerland
Doug A. Degenstein University of Saskatchewan Canada
Sophie Godin-Beekmann LATMOS-IPSL, CNRS/UVSQ/Sorbonne University France
Daan Hubert Royal Belgian Institute for Space Aeronomy (BIRA-IASB) Belgium
Eliane Maillard Barras Federal Office of Meteorology and Climatology, MeteoSwiss Switzerland
Stergios Misios University of Oxford United Kingdom
Irina Petropavlovskikh (1) NOAA Earth System Research Laboratory (2) CIRES, University of Colorado USA
Chris Z. Roth University of Saskatchewan Canada
Wolfgang Steinbrecht Deutscher Wetterdienst, Meteorological Observatory Hohenpeissenberg Germany
Corinne Vigouroux Royal Belgian Institute for Space Aeronomy (BIRA-IASB) Belgium
Thomas von Clarmann KIT, Institute of Meteorology and Climate Research (IMK-ASF) Germany
Daniel J. Zawada University of Saskatchewan Canada
viii
SPARC/IO3C/GAW LOTUS ReportAcknowledgements We acknowledge SPARC, IO3C and WMO GAW
for supporting and initiating the LOTUS activity (http://lotus.aeronomie.be), through which a diverse group of experts in satellite and ground-based ozone ob-servation systems, ozone modelling and statistical analy-sis techniques were able to closely collaborate to produce the work described in this Report. These activities have been undertaken under the guidance and sponsorship of the World Climate Research Programme. The ground-based data used in this publication were obtained as part of WMO’s Global Atmosphere Watch (GAW) and two of its main contributors, namely, the Network for the De-tection of Atmospheric Composition Change (NDACC) and the Southern Hemisphere ADditional OZonesondes programme (SHADOZ). We acknowledge the meticulous and sustained work of the PIs and staff at all stations to acquire and maintain long-term ozone profile data records of high quality. The data records are publicly available via the NDACC Data Host Facility (http://www.ndacc.org), the SHADOZ archive (https://tropo.gsfc.nasa.gov/ shadoz)and the World Ozone and Ultraviolet Data Centre (http://www.woudc.org). NDACC and SHADOZ are sup-ported by meteorological services, space agencies and research organisms from many countries, with archives funded by NASA and NOAA. The Merged Ozone Data Set was constructed under the NASA MeaSUREs Project and is maintained under NASA WBS 479717 (Long Term Measurement of Ozone). We thank the SBUV instrument team for providing the SBUV Version 8.6 individual data records. The OSIRIS team would like to thank the Cana-dian Space Agency for over twenty years of support. The merged SAGE-CCI-OMPS data record was developed in the framework of ESA’s Climate Change Initiative project on Ozone (Ozone_cci). Authors of the Report are indebted to the IGAC/SPARC Chemistry Climate Model Initiative
(CCMI), the Working Group leaders and model/modelling groups PIs for the use of zonal mean ozone profiles in this Report. We also thank the British Atmospheric Data Cen-ter for assistance with the CCMI data Archive. W. T. Ball acknowledges financial support by the Swiss National Sci-ence Foundation (SNSF) grants 200020_163206 (SIMA). D. Hubert acknowledges financial support by the Belgian Science Policy Office through the ProDEx TROVA project and by ESA through the Climate Change Initiative project on Ozone (Phase 1 and 2) and the Multi-TASTE project (Phase F). C. Vigouroux acknowledges financial support by the EU H2020 project GAIA-Clim (No 640276). V.F. Sofieva acknowledges support by the Academy of Finland, Centre of Excellence of Inverse Modelling and Imaging. Sophie Godin-Beekmann acknowledges financial support by CNRS and CNES through the NDACC-France proj-ect. I. Petropavlovskikh would like to acknowledge sup-port from the Cooperative Institute for Environmental Sciences (CIRES) at the University of Colorado Boulder, she was funded through the grants #NA17OAR4320101, NA15OAR4320137 and NA12OAR4320137 under the Na-tional Oceanic and Atmospheric Administration Coop-erative agreement. K.-L. Chang would like to acknowledge financial support from the National Research Council Fel-lowship and the National Oceanic & Atmospheric Admin-istration (NOAA), Global Monitoring Division, Boulder, Colorado, USA. The creation of merged data records for GOZCARDS was initially supported by NASA MeaSUREs, and this effort has continued thanks to the Aura MLS mis-sion; we acknowledge the assistance of Ryan Fuller (at the Jet Propulsion Laboratory) in this regard. Work at the Jet Propulsion Laboratory, California Institute of Technology, was done under contract with NASA. SWOOSH data were provided by the NOAA Earth System Research Labora-tory’s Chemical Sciences Division.
ix
The assessment of long-term observations by LOTUSconfirms the significant decline of ozone concentra-tions in the upper stratosphere (at altitudes above the 10–5 hPa level) between January 1985 and December 1996. The strongest trends are observed near 2 hPa (~42 km) with values of 5.9–6.2 % per decade at mid-latitudes and 4.8 % per decade in the tropics. Trends are significant at more than 5 standard deviations in this altitude range.
Trends derived from satellite and ground-based re-cords in the pre-1997 time period agree with climate model simulations within respective uncertainties thus confirming our understanding of ozone loss processes in the upper stratosphere during that period.
Between January 2000 and December 2016, positive trends are obtained throughout the upper stratosphere for satellite and ground-based records. The combined trends from six merged satellite records are larger in the Northern Hemisphere mid-latitudes (2–3 % per de-cade between ~5–1 hPa) than in the tropics (1–1.5 % per decade between ~3–1 hPa) and Southern Hemisphere mid-latitudes (~2 % per decade near 2 hPa). Statistical confidence is largest for trends in the Northern Hemi-sphere mid-latitudes.
For altitudes below the 4 hPa level, ozone trends in the post-2000 time period are not significant. Though not significant, negative ozone trends of 0.5–1.5 % per decade are consistently detected by multiple satel-lite combined records in the 50–15 hPa altitude range over the tropics. Trends derived from ground-based data and Chemistry-Climate Model Initiative (CCMI) model simulations are generally consistent but more variable in this region. The mean CCMI model trend is negative at altitudes below 30 hPa, but the range of individual model trends is large; trends in ground-based records tend to be negative at 20 hPa but increase at lower altitudes (except trends from the microwave records). At mid-latitudes, the trends are close to zero down to 50 hPa.
Larger differences in post-2000 trends from the vari-ous records are observed in the lowermost stratosphere (100–50 hPa) in all latitude bands. Non-significant negative trends are derived from merged satellite re-cords over the tropics and the Northern Hemisphere mid-latitudes. Model simulations show positive trends in the mid-latitudes in both hemispheres in this alti-tude range, although the trends are not statistically significant.
LOTUS estimates of past and recent ozone trends are in fairly good agreement with results from previous stud-ies. For the post-2000 period, the largest differences are found throughout the middle stratosphere. These dif-ferences stem primarily from extensions of and revi-sions to existing data records, the addition of new data records, and in some cases the use of a different trend model.
While trend values in recent studies are fairly similar, the uncertainties and hence significances of the combined trends in broad latitude bands differ substantially. The LOTUS approach, based on both error propagation and standard error of the mean, also explicitly accounts for correlation between the data sets, which results in more conservative uncertainties and thus lower, but more real-istic, confidence in positive upper stratospheric trend val-ues compared to the most recently published assessment of merged satellite data set trends.
Have ozone concentrations in the stratosphere significantly increased since the end of the 1990s when levels of ozone depleting substances (ODSs) started to decline? Finding an answer to this question is of great societal importance to ensure that the measures taken by the Montreal Protocol and subsequent amendments to reduce ODSs continue to adequately protect the ozone layer. However, the confidence with which we can assess changes in stratospheric ozone since the mid-1990s has been the subject of considerable scientific debate in recent years, as it depends on the data sets and the analysis methods used. Settling this scientific debate is one of the main objectives of the LOTUS activity, short for Long-term Ozone Trends and Uncertainties in the Stratosphere.
Below, we summarise the main results obtained during the first phase of LOTUS, which was primarily targeted at pro-viding timely input to the 2018 World Meteorological Orga-nization (WMO) Ozone Assessment (WMO, 2018). During this phase we reevaluated the satellite and ground-based data records as well as the time series analysis methods com-monly used to derive long-term trends. Using a single “LO-TUS regression” model, we reassessed past and recent trends in the vertical distribution of stratospheric ozone from the updated individual data records. We then developed a new approach for combining the individual trend estimates from satellite-based records into a single best estimate of ozone profile trends with associated uncertainty estimates. Finally, we compared the satellite-based profile trends in broad lati-tude bands to trends from ground-based data, from the col-lection of CCMI-1 model simulations, and from past evalu-ations of satellite-based trends in peer-reviewed literature.
x
Executive summaryES.1 New and improved data sets for trend analyses
The work performed in LOTUS and the resulting trends are based on the latest observations from single and merged satellite records as well as from ground-based instruments. In addition to including four additional years of data com-pared to the results published in the 2014 WMO Ozone Assessment and in the framework of the SI2N activity (i.e.,Harris et al., 2015; and references therein), many of the
records utilised in LOTUS have been improved for trend analyses (i.e., new methods to combine/homogenise data sets, sampling corrections, and revised calibration and pointing stability). With nearly global coverage and dura-tions spanning at least 30 years (1985–2016), the combined satellite records constitute the backbone of LOTUS trend analyses. With respect to ground-based measurements, LOTUS used individual records from passive and active remote sensing techniques as well as from ozonesondes, including the few homogenised sonde records that exist. In addition to observations, CCMI model simulations were used to test our understanding of ozone profile trends and results shown here represent the first analysis of trends in the vertical distribution of ozone from the CCMI-1 REF-C2 simulations. The details of all observational and model data used in LOTUS, as well as the methods for averaging and merging data records, are discussed in Chapter 2 of this Report.
ES.2 Addressing the challenges with data for trend
estimation
Any assessment of trends and uncertainties necessitates the investigation of the data sets themselves as well as the nuances of their creation, in the case of merged data, and utilisation. The intercomparisons of the satellite and ground-based ozone time series reported in Chapter 3 reveal a number of measurement artifacts (e.g., drifts, discontinuities, and spikes) but generally show good agreement. In fact, the agreement between observational records is better than for earlier versions of merged ozone records used for previous assessments (i.e., WMO, 2014;
Harris et al., 2015; and references therein), which lends
in-creased confidence in derived trends. Acknowledging and understanding potential anomalies is important for ex-plaining differences in the trends and trend uncertainties and provides guidance on how to improve the data sets. Availability of data records by a number of complementary
instruments is key in singling out these issues and attrib-uting them to one of the data records. Recently proposed Bayesian analyses (Section 3.1.5) may further help to sys-tematically identify artifacts in particular data sets, while Monte Carlo (MC) methods (Section 3.1.4) can help assess the impact of remaining uncertainties in the records on the final trend estimates. Sampling biases also come into play, since the ozone time series are regressed at an aggre-gate level and lead to systematic changes in derived trends by up to 1–2 % per decade in parts of the stratosphere, which constitute a considerable fraction of the estimates of post-2000 trends.
ES.3 Sensitivity testing for a consensus regression model
One of the primary goals of LOTUS is to assess the impact of analysis methods on derived ozone trends and their un-certainties. In that regard, a test of 15 previously published multiple linear regression (MLR) models applied to a com-mon data set was performed to evaluate the sensitivity of derived trends to different methodologies. The results showed good agreement in the shape of retrieved trends but a general spread in derived trend values after 2000 of 1–2 % per decade, with overall differences as high as 3 % per decade, which revealed the need for additional sensi-tivity tests in order to create a consensus analysis method.Chapter 4 of this Report details a series of sensitivity tests
pertaining to the impact of different geophysical and em-pirical proxies used in MLR analyses on the derived trends and their uncertainties. Since work during the first phase of LOTUS was optimised towards estimating middle and upper stratospheric trends in satellite data sets, we focused on the sensitivity of proxies to ozone variability at these altitudes. Accordingly, results showed that short period proxies (e.g., AO1 , AAO1, NAO1, and EHF1) had
negligible effects on trends and variably small impacts on uncertainties while excluding the solar cycle, QBO1,
or ENSO1 proxies from the regression model had
signifi-cant effects on the trend (1–2 % per decade difference) and uncertainty (around 1 % per decade) estimates. Different long-term trend proxies were also investigated, reveal-ing the complexity of attemptreveal-ing to capture changes in ozone stemming from the influences of both ODSs and greenhouse gases. Ultimately a single consensus “LO-TUS regression” model, based on a simple yet appropri-ate set of geophysical proxies and a trend proxy designed to capture mean trends in satellite data sets, was chosen for our analyses and was also packaged for public use (https://arg.usask.ca/docs/LOTUS_regression).
Lastly, while a more traditional MLR-based approach was chosen for the majority of work in LOTUS, a newer sta-tistical approach, namely a dynamic linear model (DLM), Some regions in the stratosphere have not been considered
(e.g., polar) or have not been analysed in full detail (e.g., lower stratosphere) because of the timeline for the 2018 WMO Ozone Assessment (WMO, 2018).
1 Abbreviations for proxies: AO = Arctic Oscillation; AAO = Antarctic Oscillation; NAO = North Atlantic Oscillation;
xi
Executive summary was also tested. The DLM technique, as its name implies,
does not constrain the shape of the likely nonlinear long-term trend and thus may ultimately be better suited for this type of work. However, this method was not fully evaluated during the first phase of LOTUS and a more comprehensive comparison of MLR and DLM for ozone trend estimates is still needed.
ES.4 Examination of trend results from individual data sets
The “LOTUS regression” model was first applied to the in-dividual data sets at their native resolution. Results display expected patterns of ozone decline in the upper strato-sphere prior to the late 1990s and a subsequent smaller increase since 2000 in generally good agreement with models, though the magnitude and statistical significance of these results vary between the different data sets. Most data records and model simulations point to continuously declining ozone levels in the tropical lower stratosphere in a fairly coherent yet generally not statistically significant way, but results at mid-latitudes in the lower stratosphere are variable and inconclusive. Additionally, the differenc-es between trend rdifferenc-esults are discussed as they pertain to the differences in the various data sets and merging tech-niques (see Chapter 3). In order to place these results in context with previous comprehensive studies, the regres-sions are repeated with the data sets averaged over broad latitude bands (i.e., 60°S–35°S and 35°N–60°N represent-ing southern and northern mid-latitudes respectively and 20°S–20°N representing the tropics) prior to continuing with the overall analysis.ES.5 Revised approach to combine trends
The typical desire for a single set of spatially resolved trend results (e.g., as in previous Ozone Assessments) when faced with an ensemble derived from the analyses of multiple data sets creates the unique challenge of merging not only the ensemble of trend results but also their uncertainties. With an aim towards determining if these results are statistically significant, it is the latter component that is more important and often more complicated. Historically, a variety of tech-niques have been used to merge the uncertainties and the LOTUS Report introduces a new, statistically more robust method. This includes not only components involving simple error propagation, which captures uncertainties introduced from the data and the analyses, and the standard error of the mean, which captures systematic uncertainties such as those introduced by drifts between data sets, but also the correla-tions between the data sets themselves, estimated from the correlation of the fit residuals. Consequently, it is the nature of the independence of the data sets and their resulting trends that is the most important aspect of merging the trend uncer-tainties. Section 5.3 in this Report details the complexities of this merging and the necessary assumptions chosen for the
LOTUS work, which are balanced between not wanting to overestimate or underestimate the combined uncertainties. The results presented here have uncertainties that fall be-tween previous comprehensive works but err towards a more conservative estimate. Ultimately, this work concludes that the most meaningful way to improve the uncertainties in fu-ture analyses would be to reconcile the discrepancies between the data sets themselves prior to the merging process.
ES.6 Assessment of combined ozone profile trends
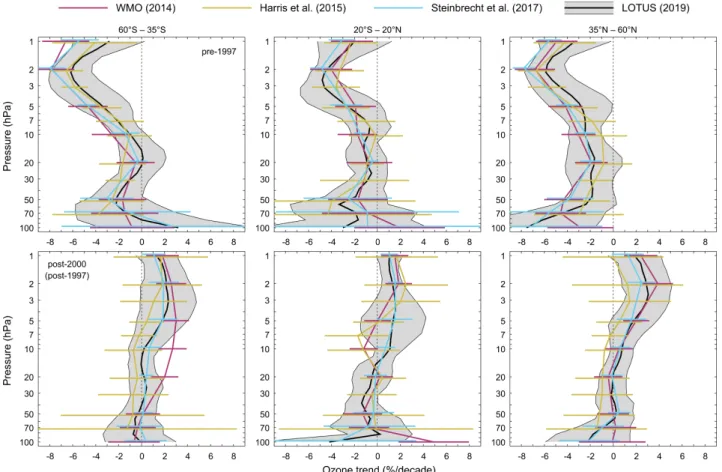
Estimates of combined satellite trends are summarised in Figure ES.1 and in Table ES.1 (see Section 5.6). For this work, results are separated into two distinct time periods with “pre-1997” being defined as the period from January 1985 to December 1996, while “post-2000” refers to the pe-riod from January 2000 to December 2016. Comparisons of LOTUS trends (hereafter L19) with previously published trends (WMO, 2014, hereafter W14; Harris et al., 2015, here-after H15; Steinbrecht et al., 2017, herehere-after S17) are shown in Figure ES.1 as well.ES.6.1 1985–1996 trends
Negative trends are found across nearly the entire strato-sphere in the pre-1997 period for almost all satellite and ground-based data records. Individual and combined sat-ellite data show highly statistically significant evidence of declining ozone concentrations in the upper stratosphere (at altitudes above the 10–5 hPa level) since the mid-1980s and well into the 1990s. The depletion reaches a maxi-mum rate near 2 hPa (~42 km) of 5.9–6.2 % per decade at mid-latitudes and 4.8 % per decade in the tropics (see Table S5.1 in the Supplement). Ozone decline rates in the middle stratosphere (30–15 hPa) are considerably smaller, with sta-tistically insignificant values of at most 1–2 % per decade. Negative trends are found across the lower stratosphere (down to 50 hPa), while in the lowermost stratosphere (down to 100 hPa) trends differ according to latitude, with large significant negative trends of about 5 % per decade in the Northern Hemisphere. However, confidence in trend re-sults is reduced in the lower stratosphere due to large natu-ral variability, low ozone values, and decreased sensitivity of satellite observations. Trends derived from ground-based measurements generally corroborate satellite trend results. However, due to their larger sparseness in space and time, especially during this early period, the significance of the trends is not as high and trend values differ. Results agree well with those of model simulations (within 1 % per de-cade) throughout the middle and upper stratosphere at all latitudes, lending confidence that these losses in ozone were the result of chemical forcing from ODSs according to mod-el predictions. However, larger differences exist between satellite and model results in the lowermost stratosphere, with disagreements outside the large uncertainties only in the Southern Hemisphere.
xii
Executive summaryOzone trend Jan 1985 - Dec 1996
(% per decade, ± 2 σ) Ozone trend Jan 2000 - Dec 2016(% per decade, ± 2 σ)
Pressure (hPa) 60-35°S 20°S-35°N 35-60°N 60-35°S 20°S-35°N 35-60°N 1 -2.8 ± 3.1 -2.0 ± 3.2 -3.3 ± 3.2 1.3 ± 1.8 1.0 ± 1.2 1.9 ± 2.3 2 -6.0 ± 1.7 -4.4 ± 1.2 -5.8 ± 1.7 2.1 ± 2.1 1.3 ± 0.9 2.9 ± 2.1 5 -3.4 ± 2.4 -2.6 ± 3.0 -2.8 ± 2.7 1.8 ± 2.2 1.4 ± 2.8 1.8 ± 2.0 7 -2.2 ± 1.5 -1.1 ± 1.9 -2.5 ± 1.8 1.1 ± 1.7 1.2 ± 2.5 1.1 ± 1.4 10 1.0 ± 1.4 -0.8 ± 1.5 -2.5 ± 1.5 0.2 ± 1.4 1.1 ± 1.2 0.8 ± 1.0 20 0.0 ± 1.9 -0.9 ± 1.7 -1.7 ± 2.5 0.2 ± 1.3 -0.5 ± 1.7 0.0 ± 1.2 50 -2.2 ± 2.7 -2.4 ±3.3 -2.1 ± 2.3 -0.3 ± 1.6 -0.9 ± 2.1 0.2 ± 1.5 70 -1.2 ± 4.5 -1.9 ± 5.3 -4.5 ± 3.8 -0.6 ± 2.4 -0.7 ± 3.3 -0.9 ± 2.4
Figure ES.1: Overview of ozone profile trends from past and recent assessments: WMO (2014), Harris et al. (2015), Stein-brecht et al. (2017), and LOTUS (this work) are shown in red, orange, blue, and black respectively. Top row shows trends before the turnaround of ODSs and bottom row since the turnaround (analysis time period differs by assessment). Shaded area and error bars represent the 95 % confidence interval for the combined trend. Coloured profiles are slightly offset on the vertical axis for display purposes. This figure is also shown in Chapter 5 as Figure 5.12. LOTUS results are tabulated for each pressure level in Table S5.1 in Supplement. Steinbrecht et al. (2017) did not report or discuss pre-1997 trends, but results shown here were obtained from that work (private communication).
Table ES.1: Overview of LOTUS combined satellite trends in three latitude bands and two time periods. Central values and uncertainties representing the 95 % confidence interval are listed in the table. Trend results that are statistically significant at the 2-sigma level are highlighted in grey cells. See also Figure ES.1. Please note that trends and uncertainties are interpolated onto pressure levels that are common to other studies (e.g., WMO, 2014; Steinbrecht et al., 2017) to facilitate comparisons between these studies and LOTUS. Trends discussed in Chapter 5 are presented on the LOTUS pressure levels, which have a higher vertical resolution, and these are tabulated in Table S5.1 in Supplement.
xiii
Executive summary ES.6.2 2000–2016 trends
Positive trends are found throughout the upper strato-sphere and part of the middle stratostrato-sphere in the post-2000 period for both satellite and ground-based trends, though results vary for ground-based data depending upon the observation technique. Results from satellites show statistically significant positive trends in the Northern Hemisphere at mid-latitudes of 2–3 % per decade in the upper stratosphere (between ~5–1 hPa) and 1–1.5 % per decade in the tropics (be-tween ~3–1 hPa).
Positive trends of ~2 % per decade are also found in the Southern Hemisphere near 2 hPa at mid-latitudes though the statistical confidence is smaller. In the Northern Hemisphere mid-latitudes, trends in the up-per stratosphere are significant down to 4 hPa. At alti-tudes below 4 hPa, mid-latitude trends are no longer sta-tistically significant, dropping from positive 1.8 % per decade at 5 hPa to near zero between 50–20 hPa. In the tropics, trends become negative below 15 hPa though the estimates of 0.5–1.5 % per decade are statistically insig-nificant as well. Generally, these satellite-based results are in agreement with ground-based observations and model simulations. The persistent negative trends in the middle and lower stratosphere over the tropics are like-ly the consequence of radiative and dynamical forcing from greenhouse gases according to model predictions (WMO, 2014; and references therein). Derived trends differ considerably in the lowermost stratosphere, be-low 50 hPa, depending on the data set and latitude. For example, satellite-based results show statistically insig-nificant negative trends (or near zero in the Southern Hemisphere) and ground-based trends agree in sign except in the tropics where there are significant tive trends. Model simulations, however, predict posi-tive trends in mid-latitudes in both hemispheres in this altitude range.
ES.6.3 Comparison with previous assessments
LOTUS estimates of past and recent ozone trends are in fairly good agreement with results from previous as-sessments (e.g., W14, H15, S17, and references therein). L19 and S17 trends differ by less than 0.5 % per decade in the post-2000 period, which is expected since similar data sets and a similar regression model were used for both studies. Trends by W14 and by H15 are in reason-able agreement with L19 as well, though larger differ-ences are noted for the post-2000 period at Southern mid-latitudes, in the tropical middle stratosphere, and, for H15, in the Northern mid-latitudes as well. These differences stem primarily from extensions of and revi-sions to existing data records, the addition of new data records, and the use of a different trend proxy (e.g., H15 assumed an inflection point at 1997).
While trend values in W14, H15, S17, and L19 are fairly similar, the uncertainties and hence significances of the combined trends differ substantially. This is the most critical component for the detection of the rela-tively small post-2000 trends. Even though both S17 and L19 use similar data records, the L19 approach, based on both error propagation and standard error of the mean, yields different uncertainties as compared to S17. In the upper and middle stratosphere, uncer-tainties from the standard error dominate and thus the estimate of the independence of the data records is critical in testing the trend null hypothesis. S17 trends are statistically significant across the entire up-per stratosphere while in the L19 trend analysis, which derives a smaller degree of data independence from the correlation of fit residuals, high significance is found only at Northern mid-latitudes, and less significant trends are found in the tropics and at Southern mid-latitudes. There is not sufficient information in the trend analyses that can help determine exactly how independent the different data sets are. However, it is concluded that the real trend uncertainty lies in be-tween S17 and L19 uncertainty estimates in the upper stratosphere. On the other hand, analysis of results of the two other assessments considered in the study sug-gested that they used either a too conservative (H15) or too optimistic (W14) approach to estimate combined uncertainties.
In the lower stratosphere, ozone trends are affected by large atmospheric variability and decreased sensitivity of satellite measurements. The L19 approach, which in-cludes a term for error propagation from the regression coefficients, is not capable of capturing all sources of uncertainty and most importantly measurement drift, which leads to the conclusion that uncertainties derived from the analysis may be underestimated.
ES.6.4 Open issues and future work
The LOTUS Report assessment of satellite and ground-based ozone data sets (Chapter 2) builds the founda-tion for reconciling the discrepancies in ozone trends estimated from the individual climate data records. Understanding the causes of these differences would create improvements not only in the internal consis-tency of data sets, but also in the uncertainties of over-all ozone trends. Further, development of techniques to directly assess uncertainties in the merged records resulting from discrepancies that cannot be complete-ly reconciled, such as small relative drifts and differ-ences resulting from coordinate transformations and sampling differences, would allow for a more precise estimate of significance of the mean trend.
For the satellite and ground-based data used in the LOTUS Report, information on stability and drifts of the measurement is still incomplete (Chapter 3).
xiv
Executive summaryThe homogenisation of ozonesonde records was not fin-ished prior to their use in the LOTUS assessment, and thus the ozonesonde trends and their uncertainties (especially in the lower stratosphere) may change in the future. In ad-dition, in order to properly combine instrument-specific trends, a common matrix for providing error budget infor-mation for each ozone record is needed. Work developing a common approach to assessing errors in Level 2 satellite data is ongoing under the SPARC “Towards Unified Error Reporting (TUNER)” activity and ozone record uncer-tainties are addressed in other SPARC (Stratosphere-tro-posphere Processes And their Role in Climate) activities. Standardised error budgets have also been defined within the Network for the Detection of Atmospheric Composi-tion Change (NDACC) and are in the process of being in-cluded in the data records.
The common statistical linear regression trend model (Chapter 4) used in the LOTUS Report was optimised for analyses of the zonally averaged satellite data sets. How-ever, analyses of the ground-based data require recon-sideration of additional proxies (i.e., lag for ENSO, AO, AAO, NAO, EHF, etc.) and optimisation methods that can improve interpretation of the processes that impact ozone changes over the limited geophysical region and reduce trend uncertainties (Chapter 5).
The first attempt to evaluate representativeness of the ground-based station records for the middle and upper stratosphere using Solar Backscatter Ultraviolet Radi-ometer (SBUV) data was done under the LOTUS Report activity and discussed in Chapter 4. Comparisons of trends derived from satellite data selected under overpass
criteria against zonally averaged trends will help with in-terpretation of stability in all observing systems and de-termine ozone recovery with high confidence.
There is a clear need for future activities of the CCMI modeling community, with experiments designed with the view on the verification of simulated trends. A large number of models is absolutely necessary in order to be able to assess the ozone variability associated with chem-istry and dynamical transport mechanisms. Moreover, an assessment of model sensitivity to uncertainties in the volcanic aerosols, solar cycle, QBO, ENSO and other mechanisms is considered of great importance in order to advance our understanding of the ozone layer variabil-ity and associated response to natural variabilvariabil-ity.
In this Report, the ozone trends are analysed at low and middle latitudes, with a focus on the upper and middle stratosphere. Future works would explore trends in polar regions and in the lower stratosphere, which can be done in conjunction with the SPARC activity Observed Com-position Trends And Variability in the Upper Troposphere and Lower Stratosphere (OCTAV-UTLS), dedicated to the assessment of the composition of the upper troposphere and lower stratosphere (UTLS) and identification of at-mospheric processes that impact UTLS changes on the decadal scales. Similarly, the trends derived from total column data are also left for future work.
Assessments similar to the LOTUS activity need to be regularly repeated, preferably in collaboration with other SPARC and WMO/GAW (Global Atmospheric Watch) activities.
xv
Abbreviations
AAO Antarctic Oscillation
ACE-FTS Atmospheric Chemistry Experiment - Fourier Transform Spectrometer (instrument)
AO Arctic Oscillation
AOD Aerosol Optical Depth
BASIC BAyeSian Integrated and Consolidated (data set)
BESOS Balloon Experiment on Standards for Ozone Sondes (campaign)
BM Brewer-Mast ozonesonde (instrument)
BUV Backscatter Ultraviolet Radiometer (instrument)
CCI ESA’s Climate Change Initiative
CCM Chemistry-Climate Model
CCMI Chemistry-Climate Model Initiative
CCMVal-2 Chemistry-Climate Model Validation Activity
CF Correction Factor
CTM Chemistry-Transport Model
DIAL Differential Absorption Lidar (instrument)
DLM Dynamic Linear Model (method)
DOFS Degrees Of Freedom for Signal
ECC Electrochemical Concentration Cell (instrument)
EESC Equivalent Effective Stratospheric Chlorine
EHF Eddy Heat Flux
EMD Empirical Mode Decomposition (method)
ENSO El Niño–Southern Oscillation
EnviSat ENVIronmental SATellite
EOF Empirical Orthogonal Function
EOS Earth Observing System
ERA- Interim European Center for Medium-Range Weather Forecast Re-Analysis (data set)
ERBS Earth Radiation Budget Satellite
ESA European Space Agency
FTIR Fourier-Transform InfraRed spectrometer (instrument)
GAW Global Atmosphere Watch (programme)
GCOS Global Climate Observing System
GDR German Democratic Republic
GHG GreenHouse Gas
GISS NASA Goddard Institute for Space Studies
GOMOS Global Ozone Monitoring by Occultation of Stars (instrument)
GOZCARDS Global OZone Chemistry And Related trace gas Data records for the Stratosphere (data set)
xvi
List of abbreviationsHITRAN HIgh Resolution TRANsmission (data set)
HMC Hamiltonian Monte Carlo (method)
IGAC International Global Atmospheric Chemistry
IGACO Integrated Global Atmospheric Chemistry Observations
ILT Independent Linear Trend
IMF Intrinsic Mode Function (method)
IO3C International Ozone Commission
JOSIE Jülich Ozone Sonde Intercomparison Experiment (campaigns)
KC Carbon iodine cell ozonesonde (instrument)
Lidar LIght Detection And Ranging (instrument)
LOTUS Long-term Ozone Trends and Uncertainties in the Stratosphere (research activity)
MC Monte Carlo (method)
MCMC Markov Chain Monte Carlo (method)
MERRA Modern-Era Retrospective analysis for Research and Applications
MIPAS Michelson Interferometer for Passive Atmospheric Sounding (instrument)
MLO Mauna Loa Observatory
MLR Multiple Linear Regression (method)
MLS Microwave Limb Sounder (instrument)
MWR MicroWave Radiometer (instrument)
MZM Monthly Zonal Mean
NAM Northern Annular Mode
NAO North Atlantic Oscillation
NASA National Aeronautics and Space Administration
NCEP National Centers for Environmental Prediction
NDACC Network for the Detection of Atmospheric Composition Change
NH Northern Hemisphere
NOAA National Oceanic and Atmospheric Administration
NOAA ESRL NOAA Earth System Research Laboratory
O3S-DQA OzoneSonde Data Quality Assessment (research activity)
OCTAV-UTLS Observed Composition Trends And Variability in the Upper Troposphere and Lower Strato-sphere (research activity)
ODS Ozone Depleting Substance
OHP Observatoire de Haute-Provence
OMPS-LP Ozone Mapping and Profiler Suite (instrument) - Limb Profiler (technique)
OSIRIS Optical Spectrograph and InfraRed Imaging System (instrument)
Ozone_cci Ozone Climate Change Initiative (research activity)
PC Principal Component
Post-2000 January 2000 – December 2016 (or end of data record)
Pre-1997 January 1985 – December 1996
PWLT Piecewise Linear Trend
QBO Quasi-Biennial Oscillation
xvii
List of abbreviations
SAGE II, III Stratospheric Aerosol and Gas Experiment II and III (instruments)
SAM Southern Annular Mode
SBUV, SBUV 2 Solar Backscatter Ultraviolet Radiometer (instrument)
SBUV MOD SBUV Merged Ozone Data Set (data set)
SBUV COH SBUV Cohesive (data set)
SCIAMACHY SCanning Imaging Absorption spectroMeter for Atmospheric CHartographY (instrument)
SCISAT SCIence SATellite (instrument)
SFIT2, SFIT 4 Spectral Fitting Algoritm version 2, version 4
SH Southern Hemisphere
SHADOZ Southern Hemisphere ADditional OZonesondes (network)
SI2N SPARC/IO3C/IGACO/NDACC initiative
SMM Station Monthly Mean
SMMa Station Monthly Mean anomaly
SMO SAGE II - MIPAS - OMPS-LP (data set)
SOO SAGE II - OSIRIS - OMPS-LP (data set)
SPARC Stratosphere-troposphere Processes And their Role in Climate
SSC Station Seasonal Cycle
SST Sea Surface Temperature
STS Simultaneous Temporal and Spatial (regression method)
Suomi-NPP Suomi National Polar-orbiting Partnership
SVD Singular Value Decomposition (method)
SWOOSH Stratospheric Water and OzOne Satellite Homogenized (data set)
SZA Solar Zenith Angle
TUNER Towards Unified Error Reporting (research activity)
UARS Upper Air Research Satellite
UMK04 Umkehr ozone retrieval version of 2004 (algorithm)
UNEP United Nations Environment Programme
USask 2D University of Saskatchewan OMPS-LP 2D data set (algorithm)
UTLS Upper Troposphere Lower Stratosphere
UV UltraViolet
VMR Volume Mixing Ratio
WMO World Meteorological Organization
WOUDC World Ozone and Ultraviolet Radiation Data Centre
WT Wavelet Transform (method)
xix
Table of contents
Chapter 1: Introduction ... 1 Chapter 2: Observations and model data ... 3
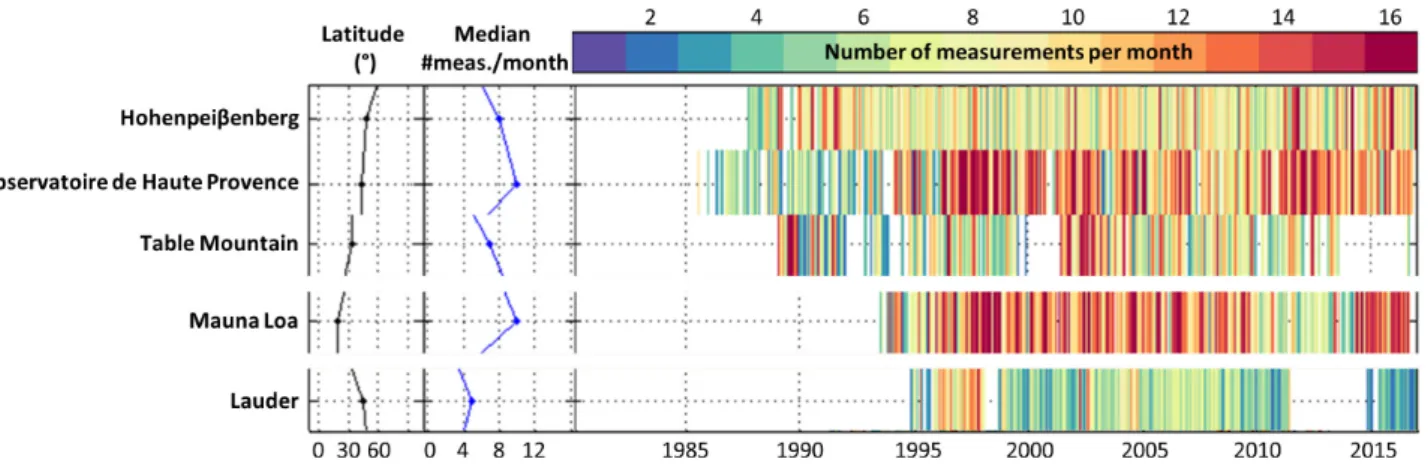
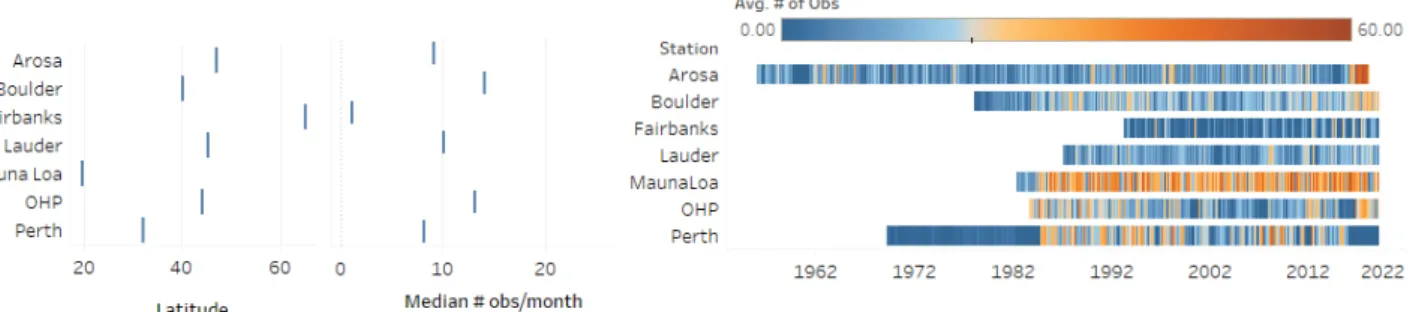
2.1 Ground-based observations ...3 2.1.1 Measurement techniques ...3 2.1.1.1 Ozonesonde ...3 2.1.1.2 Lidar ...4 2.1.1.3 Microwave radiometer ...4 2.1.1.4 FTIR ...5 2.1.1.5 Umkehr ...6 2.1.2 Deseasonalised monthly mean time series ...6 2.1.2.1 Procedure ...6 2.1.2.2 Ozonesonde ...7 2.1.2.3 Lidar and microwave radiometer ...7 2.1.2.4 FTIR ...8 2.1.2.5 Umkehr ...8 2.1.2.6 Instrument and station measurement frequency ...8 2.2 Satellite observations ...10 2.2.1 General remarks ...10 2.2.2 Nadir profile data records ...10 2.2.2.1 SBUV MOD v8.6 ...12 2.2.2.2 SBUV COH v8.6 ...12 2.2.3 Limb profile data records in mixing ratio on pressure grid ...12 2.2.3.1 GOZCARDS v2.20 ...12 2.2.3.2 SWOOSH v2.6 ...13 2.2.4 Limb profile data records in number density on altitude grid ...13
2.2.4.1 SAGE-OSIRIS-OMPS ...13
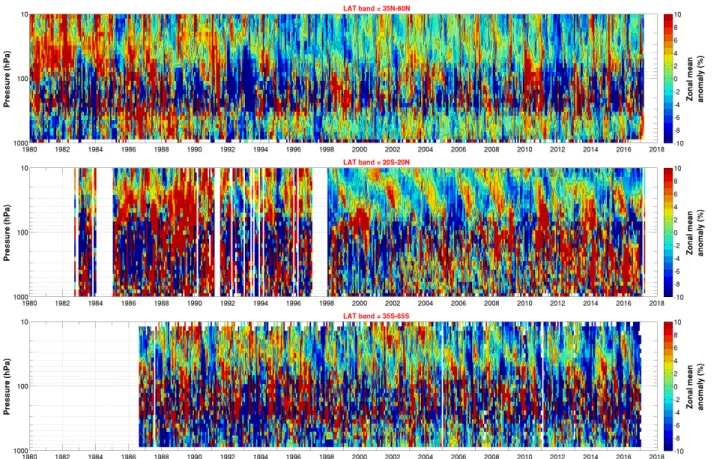
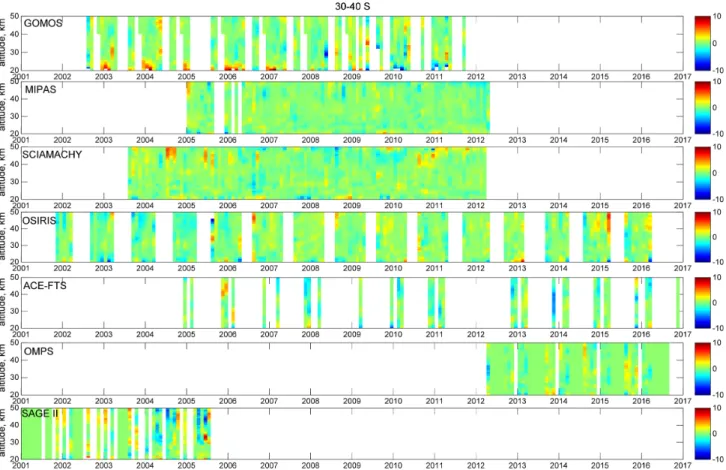
2.2.4.2 SAGE-CCI-OMPS ...14 2.2.4.3 SAGE-MIPAS-OMPS v2 ...14 2.2.5 Satellite data in broad latitude bands ...14 2.3 CCMI model data ...15 2.3.1 Description of model data sets ...15 2.3.2 Model data in broad latitude bands ...15 2.4 Summary ...15
xx
Table of contentsChapter 3: Challenges for trend studies ... 17
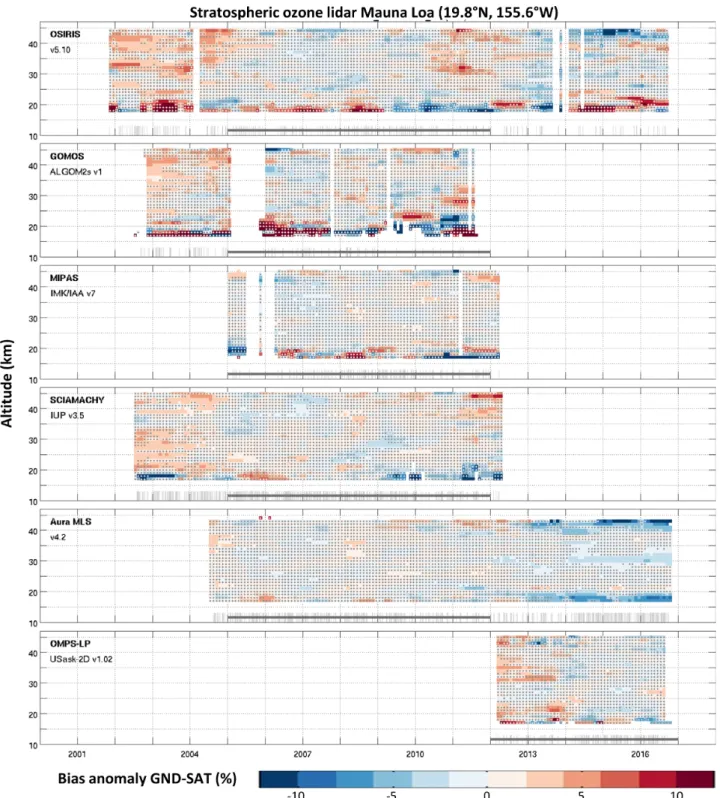
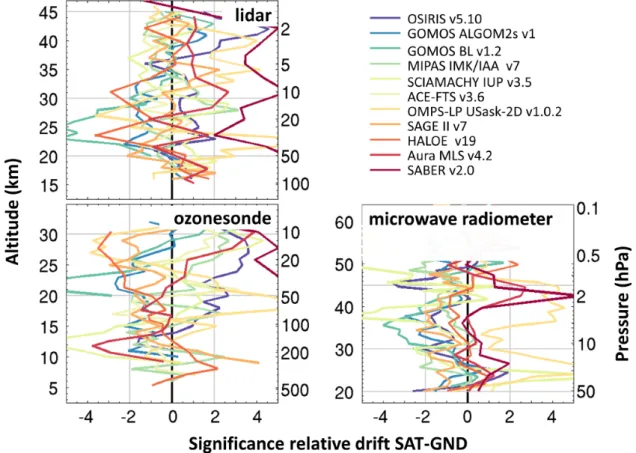
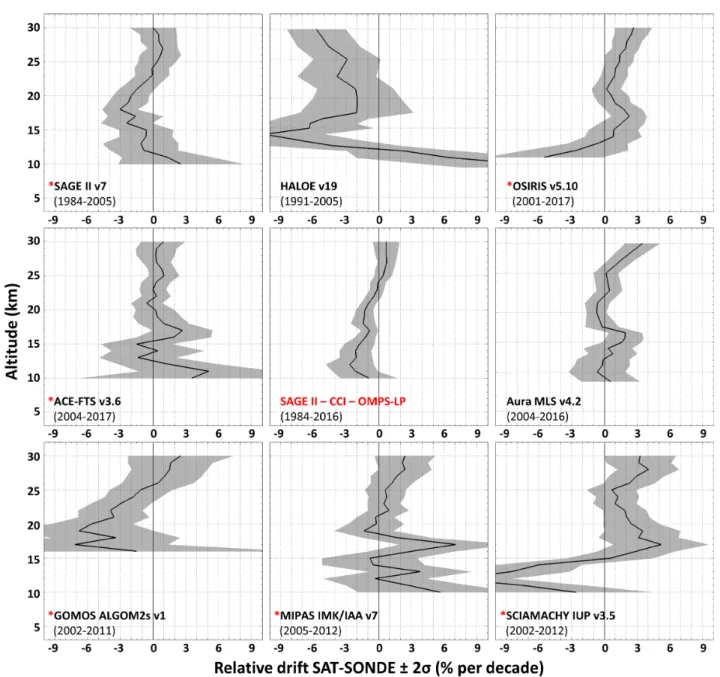
3.1 Consistency of ozone profile data records ...17 3.1.1 Homogeneity of ground-based network data ...17 3.1.2 Stability of limb data records relative to ground-based networks ...23 3.1.3 Intercomparisons of limb satellite measurements ...26 3.1.4 Stability of limb data records relative to ground-based networks ...26 3.1.5 The BASIC composite and its use for intercomparisons of merged data records ...28 3.2 Sampling bias and uncertainty correction characterisation ...32
3.2.1 Sampling bias for occultation instruments estimated using simultaneous temporal
and spatial (STS) analysis ...33 3.2.2 Station means versus zonal means ...34 3.3 Summary ...36
Chapter 4: The LOTUS regression model ... 37
4.1 Regression methodology ...37 4.2 Proxies ...37 4.2.1 Non-trend proxies ...38 4.2.2 Trend proxies ...40 4.3 Sensitivity tests ...41 4.3.1 Survey of existing regression models ...41 4.3.2 Weighted versus unweighted regression ...42 4.3.3 Non-trend proxy sensitivity ...42 4.3.4 Trend proxy sensitivity ...45 4.4 Alternative approaches ...48 4.5 The “LOTUS regression” model ...49 4.5.1 General description ...49 4.5.2 Application to model simulations ...49 4.6 Summary ...50
Chapter 5: Time series and trend results ... 51
5.1 Satellite trends at native resolution ...51 5.1.1 Trend results ...51 5.1.2 Discussion of differences ...52 5.2 Time series in broad latitude bands ...56 5.3 Combined satellite trends in broad latitude bands ...57 5.3.1 Selection and preparation of data sets ...57 5.3.2 Approach to combine trends ...57 5.3.3 Alternative methods ...59 5.3.4 Discussion ...60 5.4 Ground-based trends ...61
xxi
Table of contents
5.5 Comparison between combined satellite and CCMI model trends ...64 5.5.1 Pre-1997 period ...64 5.5.2 Post-2000 period ...65 5.6 Summary of observed profile trends...66 5.6.1 Pre-1997 period ...66 5.6.2 Post-2000 period ...66 5.6.3 Comparison of LOTUS trend results with previous assessments ...67 5.7 Summary ...69 References ... 71 Supplementary Material ...(79) S-1 S.1 Chapter 1 ... S-1 S.2 Chapter 2 ... S-1 S.3 Chapter 3 ... S-2 S.4 Chapter 4 ... S-9 S.4.1 DLM estimated ozone changes from the BASIC composites ... S-9 S.5 Chapter 5 ... S-12 S.5.1 Appendix A: Supplementary figures ... S-12 S.5.2 Appendix B: Analysis of correlation between fit residuals ... S-17 S.5.3 Appendix C: Table of LOTUS trend values ... S-19
1
Chapter 1: Introduction
Ozone is a key species in the atmosphere, as it protects lifeon Earth by filtering out damaging ultraviolet (UV) radia-tion from the sun. The evaluaradia-tion of the effect of ODSs on the long-term evolution of stratospheric ozone levels dates back to the late 1970s when the threat linked to increased levels of chlorine in the stratosphere due to industrial products started to emerge. Since then, ozone research has played a pioneer-ing role in alertpioneer-ing on the impact of human activities on the global environment, promoting a direct link between science and policy action. In the early 1980s, atmospheric models pre-dicted the maximum impact of ODSs on ozone in the upper stratosphere, around 40 km (WMO, 1985). The discovery of the Antarctic ozone hole changed this understanding of the ozone equilibrium in the stratosphere (Farman et al., 1985;
Solomon et al., 1986). It became clear that chemical processes
involved in polar ozone depletion could also affect ozone in the lower stratosphere at the global scale. Following the sign-ing of the Montreal Protocol in 1987, a strategy was devised to accurately monitor the evolution of stratospheric ozone. Since 1989, the WMO/United Nations Environment Programme (UNEP) Ozone Assessments report on the state of the ozone layer and on the attribution of long-term changes in both the total column and the vertical distribution of ozone to ODSs, as well as on other direct and indirect processes that affect ozone levels, for example changing atmospheric temperature due to the accumulation of greenhouse gases (GHGs), or volcanic eruptions that inject aerosols into the stratosphere. In order to support these assessments, several international evaluation exercises have been organised. After the International Ozone Trend Panel (1988) that addressed the evaluation of trends from total column ozone measurements, the first SPARC/ WMO report (SPARC, 1998) tackled the issue of trends in the vertical distribution of ozone. It provided a detailed descrip-tion of both satellite and ground-based ozone profile mea-surement techniques, assessed their quality, and provided the first estimates of decreasing trends in stratospheric ozone since 1980 based on a combination of various data sources. This study showed statistically significant negative trends in ozone levels in the whole stratosphere, with two clear maxima in the upper stratosphere at around 40 km altitude and in the lowermost stratosphere at about 15 km (SPARC, 1998). The accumulation of halogen compounds peaked in the stratosphere between the mid-1990s and the beginning of the 21st century, with a turnaround time that depends on altitude
and latitude (WMO, 2014). As the decrease of ODS levels is becoming more apparent, it is now crucial to evaluate the suc-cess of the Montreal Protocol with regards to the recovery of the ozone layer. In addition, after 2000, the launch of several
new satellite platforms dedicated to atmospheric composi-tion measurements (e.g., Earth observing system (EOS) Aura and EnviSat (Environmental Satellite)) provided new global ozone records. This resulted in the necessity of merging the various data records to determine the long-term evolution of ozone vertical distribution. The SPARC1, IO3C2,
IGACO-O33, and NDACC4 (SI2N) activity that started in 2011, aimed
to evaluate the ozone profile trends from ground-based and satellite observations, including the new merged satellite data records. The activity was intended to contribute to the WMO/ UNEP 2014 Assessment on the state of the ozone layer, but concluded only after the release of the report. From the com-bination of available ozone trend profiles, the Assessment re-ported a significant increase of ozone values by 2.5–5 % per decade around 35–45 km altitude at mid-latitudes and in the tropics during the period 2000–2013. These findings were in agreement with global climate model simulations that attrib-uted the upper stratospheric ozone increase to both declin-ing ODS levels and stratospheric cooldeclin-ing by increasdeclin-ing GHGs (WMO, 2014).
The SI2N team used another approach to determine the significance of ozone profile trends compared to that used for the WMO/UNEP 2014 Assessment. SI2N analyses re-evaluated long-term ozone profile trends from all available ozone records over the period 1979–2012 and results were published in Harris et al. (2015). For the period before the ODS peak, the reported trends were in good agreement with those reported in the 2014 Assessment. For the potential “re-covery” period (e.g., 1998–2012), positive trends of ~2 % per decade in mid-latitudes and ~3 % per decade in the tropics were found in the upper stratosphere from the combination of ozone profile trends, in somewhat broader agreement with
WMO (2014). However, the significance of these combined
increasing trends was investigated using several methods. The first one, similar to that used in WMO (2014), estimated the uncertainty of average trends from the weighted mean of the individual trends’ standard deviations. The second used the joint distribution of the individual variances around the arithmetic mean of the estimators (e.g., SPARC, 2013). The addition of uncertainty related to satellite drift, estimated from ground-based ozone profile measurement records
(Hu-bert et al., 2016), increased the total uncertainty of the trend
and resulted in insignificant positive trends throughout the stratosphere, in contrast to results of the WMO (2014). The study concluded that it was too early to confirm the signifi-cant increase of ozone in the upper stratosphere, considering the length of the “recovery” period since 1998 and uncer-tainties in combined ozone trends.
1 SPARC: Stratosphere-troposphere Processes And their Role in Climate; 2 IO3C: International Ozone Commission; 3 IGACO-O3: Integrated
2
Chapter 1: IntroductionThe new SPARC, WMO and IO3C activity entitled “Long-term Ozone Trends and their Uncertainties in the Strato-sphere (LOTUS)” was initiated in 2016 to revisit the causes of differences in the conclusions regarding the significance of post-turnaround ozone trends between the SI2N study and the 2014 WMO/UNEP Assessment. Since the end of the SI2N activity, historic ground-based and satellite time series have been revised and new merged satellite data sets have been produced. The main objectives of LOTUS are thus to assess the new long-term ozone profile records, provide a better understanding of all relevant uncertain-ties in the records, and revise the methods used to derive trends and their associated uncertainties.
This Report summarises the main results obtained during the first year of the LOTUS activity, which was targeted at providing timely inputs to the 2018 WMO/UNEP Ozone Assessment. This deadline defined the scope of this Report and focused the LOTUS activities primarily on changes in ozone levels in the middle and the upper stratosphere outside the polar regions as observed by merged satellite records. These studies were complemented by an analysis of ground-based data and recent model data provided by
the CCMI (Morgenstern et al., 2017). The short timeline of this work necessitated leaving several pressing topics for the second phase of LOTUS, most notably: the significance of recent trends in the lower stratosphere, the attribution of trends to ODSs and GHGs using model data, and esti-mates of trends in the polar regions.
The structure of this Report is as follows: Chapter 2 de-scribes improvements in the historic data records and the newly released data sets for both ground-based and satellite measurements. Challenges for trend studies are addressed in Chapter 3 and include the evaluation of sampling biases and drifts between the various time series. Methodologies designed to assess the stability of the various satellite re-cords are also described. Chapter 4 describes the regression methodology used in LOTUS and related sensitivity tests, while Chapter 5 provides updated ozone profile trends from the various records. A substantial part of this chapter is devoted to an assessment of the methods used to com-bine trends from the individual records and estimate the significance of the combined trends. The main conclusions of the LOTUS study are drawn in the Executive Summary and remaining open issues are listed.