Laboratoire de Spectrométrie de Masse Professeur E. DE PAUW
A STUDY OF NONCOVALENT INTERACTIONS
BY ELECTROSPRAY MASS SPECTROMETRY
Dissertation présentée par
Valérie GABELICA
pour l'obtention du grade de Docteur en Sciences Année Académique 2001 - 2002
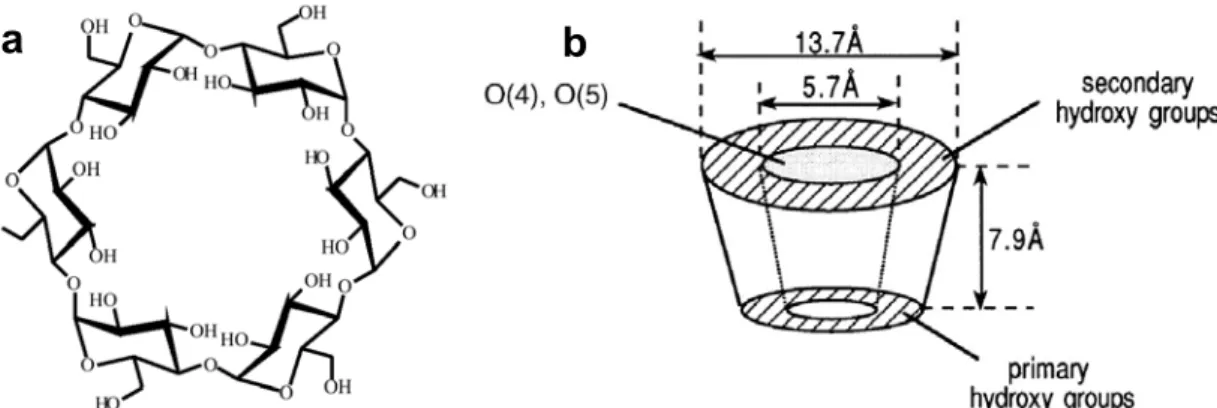
This work describes a study of noncovalent interactions by electrospray mass spectrometry (ES-MS). In particular, we studied DNA duplexes, DNA complexes with drugs and cyclodextrin complexes with aliphatic acids. ES-MS experiments were performed on a hybrid quadrupole-TOF instrument and on an ion trap instrument. Basically two kinds of information can be obtained on the complexes. First, the full scan mass spectra give information on the composition of the solution that is injected, and therefore on the solution-phase stability of the complexes. We compare the ES-MS data with the solution-phase data, and discuss the specificity of the observed complexes. The problem of nonspecific aggregation was encountered for the hydrophobic cyclodextrin complexes. We developed a new method for determining simultaneously the equilibrium association constant of [1:1] complexes and the ratio between the electrospray response factors of the complex and the free substrate. A change in the substrate conformation upon ligand binding can be detected by measuring the response factors of the complex and the free host. Second, the collision-induced dissociation of the complexes in the gas phase and the measurement of the amounts of fragments resulting from this dissociation give information on the gas-phase kinetic stability of the complexes. It is shown that different collision regimes allow the system to fragment via different pathways, and that fast activation conditions favor the noncovalent dissociation of the complex because this process is entropy-favored. The gas-phase kinetic stability measurements on series of homologous complexes suggest that intermolecular interactions like hydrogen bonding, electrostatic interactions, and stacking are conserved in the gas phase. Finally, on the basis of the results obtained on DNA duplexes, we propose a general multistep mechanism for the dissociation of noncovalent complexes.
Ce travail décrit l’étude des interactions non-covalentes par spectrométrie de masse couplée à l’électronébulisation (ES-MS). En particulier, nous avons étudié des duplex d’ADN, des complexes entre ces duplex et des drogues, et des complexes de cyclodextrines avec des acides aliphatiques. Les expériences ont été réalisées sur un spectromètre hybride quadripole-TOF et sur un spectromètre de type piège à ions quadripolaire. Deux types d’informations distinctes peuvent être obtenues sur les complexes. Premièrement, les spectres de masse simples renseignent sur les espèces présentes dans la solution injectée, et donc sur la stabilité en solution des complexes. Nous avons comparé les données en solution et les résultats obtenus en ES-MS pour discuter de la spécificité des complexes observés. Nous avons détecté une agrégation non-spécifique pour les complexes hydrophobes de cyclodextrines. Une nouvelle méthode a été établie pour déterminer simultanément la constante d’équilibre d’association d’un complexe [1:1] ainsi que le rapport entre les facteurs de réponse du complexe et du substrat libre. Le changement de conformation du substrat causé par la fixation du ligand se reflète dans les facteurs de réponse. Deuxièmement, la dissociation des complexes induite par collision et la mesure des intensités relatives des fragments en fonction de l’énergie collisionnelle donnent des informations sur la stabilité cinétique des complexes en phase gazeuse. Nous avons montré que des régimes de collision différents favorisaient des canaux de réaction différents, et que la dissociation du complexe non-covalent en ses ligands constitutifs était favorisée par un régime d’activation rapide, ce processus étant favorisé entropiquement. Les mesures de stabilité cinétique en phase gazeuse sur des séries de complexes homologues suggèrent que les interactions intermoléculaires telles les interactions électrostatiques, les liaisons hydrogène et les interactions d’empilement sont conservées dans les complexes isolés en l’absence de solvant. Enfin, sur base de différents résultats obtenus sur des duplex d’ADN, nous avons proposé un mécanisme multi-étapes pour rendre compte de la dissociation des complexes non-covalents en général.
A Arrhenius pre-exponential factor
A Adenine
BIRD Blackbody infrared radiative dissociation
C Cytosine
a-CD a-Cyclodextrin CD Cyclodextrin
CID Collision-induced dissociation DNA Desoxyribonucleic acid
DOF Degrees of freedom
E0 Threshold energy for dissociation Ea Arrhenius activation energy Er Reverse energy barrier
ES Electrospray
FTICR Fourier transform ion cyclotron resonance
G Guanine
ICR Ion cyclotron resonance MCP Microchannel plate
MS/MS Tandem mass spectrometry
m/z Mass-to-charge ratio
NMR Nuclear magnetic resonance
P(E) Internal energy distribution QIT Quadrupole ion trap
Q-TOF Hybrid quadrupole – time-of-flight RNA Ribonucleic acid
RRK Rice-Rampsberger-Kassel
RRKM Rice-Rampsberger-Kassel-Marcus
T Thymine
Tcap Heated capillary temperature
TDC Time-to-digital converter
Teff Effective temperature
TLO Tube lens offset
Tm Melting temperature
TOF Time-of-flight UV Ultraviolet
1.
N
ONCOVALENT
I
NTERACTIONS
1.1. Supramolecular chemistry
1Molecular chemistry is the science of building molecular structures by breaking and forming covalent bonds between atoms in a controlled manner. Supramolecular chemistry deals with the next step in the complexity of life, after elementary particles, atoms and molecules: how do molecules interact with each other by noncovalent bonds to form complexes? Intermolecular interactions are responsible for highly specific processes of recognition, reaction, transport and regulation occurring in a living cell. The fundamental understanding of these noncovalent interactions is necessary to understand these specific biological processes.
1.2. Classification of the interactions
A compound problem
The need for understanding the nature of these noncovalent interactions automatically brought about the need for a rationalization by means of a decomposition of the overall effect into distinct components. Research areas like drug design can greatly benefit from predictive tools characterizing the affinity and the specificity of a potential ligand for its target. This leads to the “rational drug design” approach.
The affinity of a heteronuclear complex AB (eq. 1.1) is characterized by a binding constant, or association constant Ka (eq. 1.2) related to the standard free energy of
association DG°a (eq. 1.3), which has an enthalpic contribution DH°a and an entropic
contribution DS°a (eq. 1.4). This can be expressed in an equivalent manner in terms of
dissociation instead of association.
A + B AB (1.1) d a AABB K K 1 ] ][ [ ] [ = = (1.2) d a a RT K G G° =- =-D ° D ln (1.3) a a a H T S G° =D ° - D ° D (1.4)
The decomposition of the overall interaction into distinct contributions leads to a decomposition of DG° into a sum of terms, and of K in a product of terms2-5. A
predictive tool based on such an approach takes the form of an incremental method. The contributions that are most often distinguished are electrostatic interactions, hydrogen bonding, Van der Waals forces and hydrophobic effects, but there are also some conformational changes, loss of translational and rotational degrees of freedom and creation of vibrational modes, induction forces, charge transfer, steric effects, stacking,1,6-13… The relative contribution of all these parameters to the observed binding constant is hard to establish, and the role of the solvent is a critical part of the problem. For example, a wide controversy exists on whether hydrogen bonds or hydrophobic interactions are responsible for the affinity and specificity of protein complexes14-18.
Origin of the confusion
Two review articles, one by Connors on cyclodextrin complexes7 and one by Janin on protein-protein recognition8, are enlightening on the origin of the confusion that is encountered in so many papers. The thermodynamics of noncovalent interactions can be described at three different levels.
At the phenomenological level, pairwise (or higher level) interactions, such as solute-solute, solute-solvent and solvent-solvent, are identified and assigned quantitative roles. For a complex AB, the complexation reaction (eq. 1.1) can be rewritten, explicitly mentioning the solvation shell of the molecules:
A.nH2O + B.mH2O AB.xH2O + (n+m-x) H2O (1.5)
As thermodynamic parameters are measured in solution, their values reflect the overall process taking place in the given solvent (eq. 1.5), and not just the intermolecular interaction as in equation (1.1). The pure intermolecular interaction in the absence of solvent is identical to the interaction the partners would undergo in the gas phase. The gas phase and the solution phase association thermodynamics constants can be related by the appropriate thermodynamic cycle19 including the transfer from the gas phase to the solution for each species (Figure 1-1).
A(g) + B(g) AB(g) A(s) + B(s) AB(s) DX°(g) DX°(s) DX°trAB DX°trA DX°trB
Figure 1-1. Thermodynamic cycle19 for complex formation. DX
stands for DH, DS or DG. The interaction in the gas phase (g) is purely intermolecular. The interaction in the solvent (s) depends on the intermolecular interaction and on the solvation of the species (tr = transfer between the two phases).
The interaction forces can also be described at the physical level. Electrostatic interactions include Coulombic forces (between two permanent multipoles), induction forces (between one permanent multipole and one induced multipole) and dispersion forces (Table 1-1). The term "Van der Waals forces" is generally used to describe all
forces with 1/r6 distance dependence, but this may differ from one author to another. All these interactions can be expressed classically20. Two non-classical terms are subsequently introduced in quantum calculations: an exchange interaction (global delocalization of the electrons on the supermolecule AB) and a charge transfer interaction (partial transfer of the electrons from A to B or vice versa)21.
Table 1-1. Classical electrostatic interactions and their distance dependence.
COULOMBIC FORCES Ion-Ion 1/r Ion-Dipole 1/r2 Dipole-Dipole 1/r3 Quadrupole-Quadrupole 1/r5 INDUCTION FORCES Ion-Induced dipole 1/r4 Dipole-Induced dipole 1/r6 DISPERSION FORCES
Induced dipole-Induced dipole 1/r6
The third level, the chemical level, is entirely a consequence of the other two7. It embodies salt bridges, hydrogen bonding, hydrophobic interactions, p-p stacking, steric effects… This level is useful for the description of the complexation phenomenon because the interactions can be "visualized" easily in a given structure, and can provide reference marks for interpretations and predictions. The problem is
that mixing the three levels carries the potential for confusion as a result of "double counting".
Salt bridges are the ion-ion interactions between opposite charges. Hydrogen bonds are also of electrostatic nature (ion-dipole if the donor group is positively charged or dipole-dipole if it is neutral), but they are often distinguished from other interactions because they can be visualized easily in a structure. Stacking of aromatic molecules are sometimes represented as an overlap between out-of-plane p-based molecular orbitals, but their interactions are also of electrostatic nature. They are short range interactions (dipole-dipole or weaker), and are thus highly conformation-dependent6,22,23.
Establishing the nature of hydrophobic interactions is a more difficult problem. In many articles, no definition of hydrophobicity is even given. We will adopt the following one16: "Hydrophobicity (…) is the operational process in which a nonpolar group is transferred from a polar or neutral phase to a nonpolar phase". The driving force is the solvent reorganization24-27: at hydrocarbon/water interfaces, water molecules form more highly ordered hydrogen-bonded structures than in the bulk solvent. Nonpolar groups have a preference for nonpolar phases. This minimizes the area of the hydrocarbon/water interfaces and therefore maximizes the entropy of the whole system. During complex formation, when the nonpolar groups of A and B come close to each other so that their Van der Waals surfaces are in contact, the area of the hydrocarbon/water interface decreases. The hydrophobic contribution to the complex formation can be correlated with the difference in solvent-accessible surface area (DSASA) between the complex and in its separate constituents6,14,28,29.
The role of the solvent in the complex formation is not limited to the hydrophobic effect, but it also affects other types of interactions, compared to the gas phase situation. Due to the high dielectric constant, the bulk solvent is shielding all electrostatic interactions. The same holds for the counter-ionic atmosphere (salts present in solution). At the microscopic level, water dipoles are strong competitors for forming electrostatic interactions, especially hydrogen bonds, with the substrates. This emphasizes the role of solute-solvent and solvent-solvent interactions in the phenomenological description of the complexation process.
1.3. Specificity of a complex
In a molecular recognition process, given substrate and ligand undergo noncovalent interactions with each other, some of which being impossible with other molecules than the partner, even if such molecules are chemically very similar. This discriminating quality is known as specificity1. The specificity of a complex depends on its affinity constant (an intrinsic parameter), but has to be defined in a context of competition with other interactions.8,30 For a given substrate-ligand complex, competition can arise from different possible binding sites in the substrate, from different conformations of the complex (different orientations of the ligand in the binding site), or from competition with other ligands that are in the medium. The specificity depends on how more stable is the native state (the right ligand, in the right site, in the right position) compared to all other possible states.
1.4. Why studying noncovalent complexes by mass
spectrometry?
There are two important issues that can be addressed adequately with mass spectrometric techniques. The first one is the analysis of the composition of complex mixtures. The different species can be identified by their masses. In traditional spectrophotometric methods, the signal detected results from the sum of the contributions of all the species present in solution (the complex of interest, plus the free ligands, the buffer, the solvent,…). This is especially important for the determination of the specificity, which is defined in a context of competition in the given medium. The second issue is the study of the different contributions to the binding affinity and specificity. Mass spectrometry has the unrivalled ability to study isolated molecules in the gas phase (in the absence of solvent, buffer,…), and therefore to study the sole contribution of the intermolecular interactions.
Noncovalent complexes are transferred in the gas phase by an electrospray source, which mechanism is described in Chapter 2. Some theoretical considerations on the dissociation kinetics in mass spectrometry are given in Chapter 3, and the current state of the art of noncovalent complex studies by mass spectrometry is reviewed in Chapter 4.
References
1. J.-M. Lehn La Chimie Supramoléculaire; De Boeck & Larcier s.a.: Paris, 1997. 2. S. Boresch, M. Karplus; The Meaning of Component Analysis: Decomposition of
the Free Energy in Terms of Specific Interactions. J. Mol. Biol. 1995, 254: 801. 3. H.-J. Schneider; Mechanisms of Molecular Recognition: Investigations of
Organic Host-Guest Complexes. Angew. Chem. Int. Ed. Engl. 1991, 30: 1417. 4. H.-J. Schneider, T. Schiestel, P. Zimmermann; The Incremental Approach to
Noncovalent Interactions: Coulomb and Van Der Waals Effects in Organic Ion Pairs. J. Am. Chem. Soc. 1992, 114: 7698.
5. H.-J. Schneider; Linear Free Energy Relationships and Pairwise Interactions in Supramolecular Chemistry. Chem. Soc. Rev. 1994, 227.
6. C.A. Hunter; The Role of Aromatic Interactions in Molecular Recognition.
Chem. Soc. Rev. 1994, 101.
7. K.A. Connors; The Stability of Cyclodextrin Complexes in Solution. Chem. Rev. 1997, 97: 1325.
8. J. Janin; Protein-Protein Recognition. Prog. Biophys. Mol. Biol. 1995, 64: 145. 9. T. Hermann; Strategies for the Design of Drugs Targeting RNA and
RNA-Protein Complexes. Angew. Chem. Int. Ed. Engl. 2000, 39: 1890.
10. D.H. Williams, J.P.L. Cox, A.J. Doig, M. Gardner, U. Gerhard, P.T. Kaye, A.R. Lal, I.A. Nicholls, C.J. Salter, R.C. Mitchell; Toward the Semiquantitative Estimation of Binding Constants. Guides for Peptide-Peptide Binding in Aqueous Solution. J. Am. Chem. Soc. 1991, 113: 7020.
11. M. Schapira, M. Totrov, R. Abagyan; Prediction of the Binding Energy for Small Molecules, Peptides and Proteins. J. Mol. Recognit. 1999, 12: 177.
12. N. Horton, M. Lewis; Calculation of the Free Energy of Association for Protein Complexes. Protein Sci. 1992, 1: 169.
13. J.B. Chaires; Dissecting the Free Energy of Drug Binding to DNA. Anti-Cancer
Drug Design 1996, 11: 569.
14. C. Chothia, J. Janin; Principles of Protein-Protein Recognition. Nature 1975, 256: 705.
15. W.E. Stites; Protein-Protein Interactions: Interface Structure, Binding Thermodynamics, and Mutational Analysis. Chem. Rev. 1997, 97: 1233.
16. G.D. Rose, R. Wolfenden; Hydrogen Bonding, Hydrophobicity, Packing and Protein Folding. Annu. Rev. Biomol. Struct. 1993, 22: 381.
17. C.N. Pace; Evaluating Contribution of Hydrogen Bonding and Hydrophobic Binding to Protein Folding. Methods Enzymol. 1995, 259: 538.
18. A.M. Davis, S.J. Teague; Hydrogen Bonding, Hydrophobic Interactions, and Failure of the Rigid Receptor Hypothesis. Angew. Chem. Int. Ed. Engl. 1999, 38: 736.
19. J. Janin; Elusive Affinities. Proteins 1995, 21: 30.
20. B. Honig, A. Nicholls; Classical Electrostatics in Biology and Chemistry. Science 1995, 268: 1144.
21. A. van der Vaart, B.D. Bursulaya, C.L. Brooks, III, K.M. Merz, Jr.; Are Many-Body Effects Important in Protein Folding? J. Phys. Chem. B 2000, 104: 9554. 22. J. Sponer, J. Laszczynski, P. Hobza; Hydrogen Bonding and Stacking of DNA
Bases: a Review of Quantum-Chemical Ab Initio Stusies. J. Biomol. Struct. Dyn. 1996, 14: 117.
23. P. Hobza, J. Sponer; Structure, Energetics, and Dynamics of the Nucleic Acid Base Pairs: Nonempirical Ab Initio Calculations. Chem. Rev. 1999, 99: 3247. 24. B. Lee; Analyzing Solvent Reorganization and Hydrophobicity. Methods
Enzymol. 1995, 259: 555.
25. E. Grunwald, C. Steel; Solvent Reorganization and Thermodynamic Enthalpy-Entropy Compensation. J. Am. Chem. Soc. 1995, 117: 5687.
26. R.U. Lemieux; How Water Provides the Impetus for Molecular Recognition in Aqueous Solution. Acc. Chem. Res. 1996, 29: 373.
27. H.A. Sheraga; Theory of Hydrophobic Interaction. J. Biomol. Struct. Dyn. 1998, 16: 447.
28. J. Janin; Angströms and Calories. Structure 1997, 5: 473.
29. T. Ooi, M. Oobatake, G. Némethy, H.A. Sheraga; Accessible Surface Areas As a Measure of the Thermodynamic Parameters of Hydration of Peptides. Proc. Natl.
Acad. Sci. USA 1987, 84: 3086.
30. J. Janin; Quantifying Biological Specificity: the Statistical Mechanics of Molecular Recognition. Proteins 1996, 25: 438.
2.
T
HE
E
LECTROSPRAY
M
ECHANISM
The electrospray process is described in detail in several excellent review papers1-5, and only the key features will be described here.
2.1. Electrolytic vaporization of the solution
The solution containing the analyte is introduced in a capillary on which a high electric field is applied (Figure 2-1). The field causes a separation of the positive and negative charges in the solution. In the positive ion mode (when the capillary is the positive terminal), positive ions tend to move towards the counter-electrode and accumulate at the surface of the liquid at the tip. At a critical field the meniscus at the tip deforms into what is called the “Taylor cone”, which continuously produces droplets enriched in positive ions. Reversing the polarity of the power supply can generate negatively charged droplets instead. As electrospray produces a continuous current, redox processes must occur at the capillary and at the counter electrode to avoid charge accumulation6,7.
In practice, standard electrospray proceeds at flow rates of 1 to 100 µL/min. High flow rates are sometimes needed when coupled with separation methods like HPLC, depending on the column. At such flow rates the production of the droplets has to be assisted by a coaxial sheath gas or by ultrasounds (ionspray)8. The lower the flow rate, the lesser the need for spray assistance. Nanospray9,10 (flow rate of a few nL/min) is the quintessence of electrospray: the electric field is sufficient to maintain the continuous production of charged droplets. It is also the most sensitive variant of electrospray.
Figure 2-1. Production of charged droplets from the analyte solution. (adapted from reference 5)
2.2. Production of ions from charged droplets
Rayleigh fission of the droplets
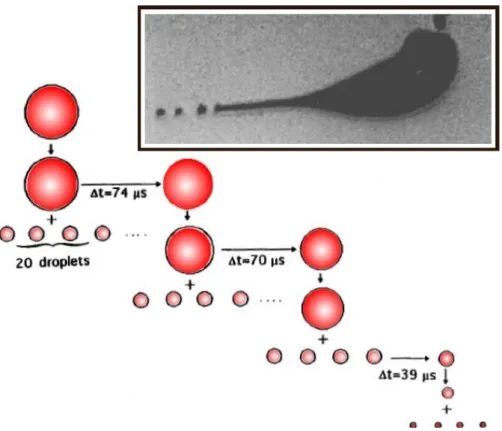
Solvent evaporation occurs due to collisions with a neutral gas (heated or not). The radius of the droplet decreases at constant charge until being close to what is called the Rayleigh limit, where the Coulombic repulsion between the charges overcomes the cohesive forces. This leads to the Coulomb fission of the droplet (Figure 2-2): small offspring droplets are produced that carry about 2% of the mass and 15% of the charge of the parent droplet. As evaporation carries on, the daughter droplets undergo fission themselves. This is at the origin of the very rapid reduction in size and charge of the droplets.
Figure 2-2. Droplet evolution scheme due to solvent evaporation at constant charge and Coulomb fissions at the Rayleigh limit (adapted from reference 5). The inset top right shows a flash shadowgraph of a droplet undergoing uneven Coulomb fission (from reference 11).
Production of desolvated ions
Two mechanisms can account for the production of desolvated ions in the gas phase: the ion evaporation model, proposed by Iribarne and Thomson12-14 and the charged residue model proposed by Dole15. Historically, these models had been proposed before the droplet fission scheme presented in the above section was established. The two models therefore have to be restated as follows5.
Ion evaporation model
According to this model, at an intermediate stage in the droplet’s lifetime (critical radius larger than the Rayleigh limit), the electric field on the surface of the droplet is sufficiently high so that solvated ions are emitted directly from charged droplets. It is
now generally admitted that small ions (salts,…) are produced predominantly by this mechanism16-18.
Charged residue model
This model assumes that the series of droplet fission events leads to a final droplet containing a single analyte molecule19. The last solvent molecules evaporate until the ion is completely desolvated. Large globular proteins are believed to be produced via this mechanism3,20.
2.3. Transfer of the ions to the mass analyzer
Electrospray is an atmospheric pressure source, but the mass spectrometer must be operated at low pressures (10-3 to 10-10 Torr, depending on the analyzer). The pressure is usually reduced in multiple stages (differential pumping), the different vacuum chambers being separated by small orifices, or by skimmers (Figure 2-3).
Figure 2-3. Typical instrument configuration for the transfer of the ions from the atmospheric pressure source to the analyzer region (adapted from the Micromass Q-TOF manual). In this case the counter-electrode has a pepperpot design, but this is not a general feature of ES sources.
The counter-electrode contains a hole for the ions to pass through. The skimmer is a cone-shaped metal piece. Voltage differences between the skimmer(s) and the other parts are responsible for the acceleration of the ions and/or of the charged droplets. Collision between the accelerated ions and the ambient gas in a high pressure region (atmospheric pressure or first pumping stage) increases the internal energy of the species: it favors the droplet evaporation and the fragmentation of the ions (collision-induced dissociation, see Chapter 3). The ion guiding system can include electronic lenses and/or RF-only multipoles.
2.4. Dependence of the sensitivity on the analyte
Of major concern to the mass spectrometrist (see Chapter 9) is whether the relative intensities in the MS spectra reflect the relative abundances of the analytes present in solution. The intensity of the signal corresponding to the analyte A+ depends on its concentration. Its response is defined as RA in:
] .[ ) ( + = + R A I A A (2.1)
Discrimination can arise from the mass analyzer, from the detector and from the electrospray process. The effect of the electrospray mechanism on the response of the analyte is discussed in this section in detail.
Ion evaporation model
This model assumes that the rate of evaporation of an ion from the droplet can be described by transition state theory (equation 2.2),
RT G A kTh e A k / * D -÷ ø ö ç è æ = (2.1)
where DG* is the free energy difference between the late transition state where an ion-solvent molecule cluster leaves the charged droplet and the initial intact droplet. To describe the analyte dependence of the sensitivity in ES mass spectrometry, Tang and Kebarle21,22 proposed a model based on the hypothesis that the ion evaporation rate
depends on the concentration in the droplet. For two analytes A and B, the ratio between the intensities is given by:
] [ ] [ ) ( ) ( + + = + + B k A k I I B A B A (2.3)
The response factors are therefore proportional to the evaporation rates of the analytes. The comparison between the theoretical results and experiments could however not yet validate this model due to experimental difficulties and uncertainties on the calculation of DG*’s2.
Surface-active analytes
In a paper published in 1993, Tang and Kebarle22 also mentioned that the surface activity of the analyte should be taken into account, as the ions do evaporate from the surface of the droplet. The ion abundance is therefore proportional to the surface concentration and not on the bulk concentration This gives:
] [ ] [ ) ( ) ( ) ( ) ( + + × × = + + B k K A k K I I B B S A A S B A (2.4)
where KS’s are constants expressing the surface activity. As ion cluster solvation
energies and surface activities are often closely correlated, it is difficult to attribute the relative responses either to the evaporation rate or to the surface activity effect. Moreover, the model does not explain the concentration dependence of the ion intensity on a broad concentration range22.
Equilibrium partitioning model
In 1997, Enke23 proposed a model to account for the concentration dependence of analyte response. The equilibrium partitioning model states that, whatever the exact mechanism, as the charges are located on the surface of the droplet, the molecules that are released as ions are those that are present at the surface of the droplet. The surface (which is charged due to an excess of ions of one polarity) is considered as a phase
separated from the neutral interior of the droplet. If the ion partitioning between these two phases is sufficiently rapid, one can define an equilibrium constant between the surface and the interior of the droplet. The concentration of excess charges on the surface of the droplet is determined by the experimental conditions. At low concentration, the surface is not saturated and all ions (for example A and B) can freely access the surface, independently of the equilibrium partitioning constants KA
and KB. At high concentration, the surface is saturated and the different analytes are in
competition for accessing the surface; the different responses will highly depend on
KA/KB. The behavior at low and high concentration is therefore reconciled in a single
model.
It must be emphasized that the surface activity effect can neither be related to the ion evaporation model, nor to the charged residue model. In the uneven Coulomb fission phenomenon, small offspring droplets are emitted from the surface of the parent droplet. Surface-active compounds will therefore be preferentially emitted in these offspring droplets and subsequently end up as free ions.
References
1. S.J. Gaskell; Electrospray: Principles and Practice. J. Mass Spectrom. 1997, 32: 677.
2. P. Kebarle, M. Peschke; On the Mechanisms by Which the Charged Droplets Produced by Electrospray Lead to Gas Phase Ions. Fres. J. Anal. Chem. 2000, 406: 11.
3. R.B. Cole; Some Tenets Pertaining to Electrospray Ionization Mass Spectrometry. J. Mass Spectrom. 2000, 35: 763.
4. M.H. Amad, N.B. Cech, G.S. Jackson, C.G. Enke; Importance of Gas-Phase Proton Affinities in Determining the Electrospray Ionization Response for Analytes and Solvents. J. Mass Spectrom. 2000, 35: 784.
5. P. Kebarle; A Brief Overview of the Present Status of the Mechanisms Involved in Electrospray Mass Spectrometry. J. Mass Spectrom. 2000, 35: 804.
6. A.T. Blades, M.G. Ikonomou, P. Kebarle; Mechanism of Electrospray Mass Spectrometry. Electrospray As an Electrolysis Cell. Anal. Chem. 1991, 63: 2109. 7. J. Fernandez de la Mora, G.J. Van Berkel, C.G. Enke, R.B. Cole, M.
Martinez-Sanchez, J.B. Fenn; Electrochemical Processes in Electrospray Ionization Mass Spectrometry. J. Mass Spectrom. 2000, 35: 939.
8. M.G. Ikonomou, A.T. Blades, P. Kebarle; Electrospray-IonSpray: a Comparison of Mechanism and Performance. Anal. Chem. 1991, 63: 1989.
9. M. Wilm, M. Mann; Analytical Properties of the Nanoelectrospray Ion Source.
Anal. Chem. 1996, 68: 1.
10. R. Juraschek, T. Dülcks, M. Karas; Nanoelectrospray - More Than Just a Minimized-Flow Electrospray Ionization Source. J. Am. Soc. Mass Spectrom. 1999, 10: 300.
11. A. Gomez, K. Tang; Charge and Fission of Droplets in Electrostatic Sprays.
12. J.V. Iribarne, B.A. Thomson; On the Evaporation of Small Ions From Charged Droplets. J. Chem. Phys. 1976, 64: 2287.
13. B.A. Thomson, J.V. Iribarne; Field Induced Ion Evaporation From Liquid Surfaces at Atmospheric Pressure. J. Chem. Phys. 1979, 71: 4451.
14. J.V. Iribarne, P.J. Dziedzic, B.A. Thomson; Atmospheric Pressure Ion Evaporation-Mass Spectrometry. Int. J. Mass Spectrom. Ion. Phys. 1983, 50: 331. 15. M. Dole, L.L. Mack, R.L. Hines; Molecular Beams of Macroions. J. Chem. Phys.
1968, 49: 2240.
16. P. Kebarle, L. Tang; From Ions in Solution to Ions in the Gas Phase. Anal. Chem. 1993, 65: 972A.
17. M. Gamero-Castaño, J. Fernandez de la Mora; Kinetics of Small Ion Evaporation From the Charge and Mass Distribution of Multiply Charged Clusters in Electrosprays. J. Mass Spectrom. 2000, 35: 790.
18. G. Wang, R.B. Cole; Charged Residue Versus Ion Evaporation for Formation of Alkali Metal Halide Clusters in Electrospray Ionization. Fres. J. Anal. Chem. 2000, 406: 53.
19. G. Schmelzeisen-Redeker, L. Bütfering, F.W. Röllgen; Desolvation of Ions and Molecules in Thermospray Mass Spectrometry. Int. J. Mass Spectrom. Ion. Proc. 1989, 90: 139.
20. M. Gamero-Castaño, J. Fernandez de la Mora; Mechanisms of Electrospray Ionization of Singly and Multiply Charged Salt Clusters. Fres. J. Anal. Chem. 2000, 406: 67.
21. L. Tang, P. Kebarle; Effect of Conductivity of the Electrosprayed Solution on the Electrospray Current. Factors Determining Analyte Sensitivity in Electrospray Mass Spectrometry. Anal. Chem. 1991, 63: 2709.
22. L. Tang, P. Kebarle; Dependence of Ion Intensity in Electrospray Mass Spectrometry on the Concentration of the Analytes in the Electrosprayed Solution. Anal. Chem. 1993, 65: 3654.
23. C.G. Enke; A Predictive Model for Matrix and Analyte Effects in Electrospray Ionization of Singly-Charged Ionic Analytes. Anal. Chem. 1997, 69: 4885.
3.
D
ISSOCIATION
K
INETICS IN
M
ASS
S
PECTROMETRY
3.1. Internal energy
The internal energy of a single molecule is its total energy above its electronic, vibrational and rotational ground state1. A population of molecules is characterized by an internal energy distribution P(E), which defines the probability of a species having a particular energy. The distributions P(E) are normalized to unity. The most probable energy distribution characterized by a given mean energy is the Maxwell-Boltzmann distribution: å -b b -= å i i i i i i E E n n ) exp( ) exp( (3.1)
where ni is the number of species in the state i of energy Ei, and b is the Lagrange
parameter of the constraint on the mean energy. If the sum on the individual states i is replaced by an integral over all energies dE, the degeneracy (= the density of states
N(E)) has to be considered. The constraint b can be expressed in terms of temperature if the mean thermal energy is fixed by energy exchanges with a bath at temperature T: b = 1/kT. This gives the following expression for P(E) at a temperature T:
ò = ¥ -0 / / ) ( ) ( ) ; ( dE e E N e E N T E P kT E kT E (3.2)
3.2. The Lindemann-Hinshelwood mechanism
In 1922 Lindemann2,3 suggested the separation of the dissociation reaction A B + C in two steps: (1) molecule A can be activated or deactivated by collisions with the bath gas M (with rate constants kc and k-c), and (2) an activated molecule (noted [A]*)
can dissociate in a unimolecular process characterized by the rate constant kuni. It is
now well established that at low pressure in a mass spectrometer, activation and deactivation can also occur by radiative processes (gain or loss of a photon, with rate constants kr and k-r)4-6.
A [A]* B + C kc[M] + kr k-c[M] + k-r
kuni
(3.3) The observed fragment formation rate d[B]/dt = kobs[A] depends on the relative values
of the activation, deactivation and dissociation rates. Application of the steady state approximation to [A]* gives the following expression for the observed rate constant:
uni r c r c uni obs k M k k k M k k k + + + = -- [ ] ) ] [ ( (3.4) At high pressure (when kc[M] and k-c[M] are higher than other rate constants), the
observed rate is unimolecular. At intermediate pressures, the observed rate is bimolecular. At very low pressures, the radiative processes are predominant, and the observed fragmentation is again unimolecular6.
The internal energy distribution P(E) is built up by the activation/deactivation processes. In the Lindemann theory, each collision of [A]* results in deactivation; this is the strong collision assumption. However, the weak collision case is probably more appropriate in “slow heating” activation methods in mass spectrometry4. Activation and deactivation are in this case multi-step processes involving small increments, with up-steps balanced by down-steps at the steady state. In Section 3.4, we will show how to calculate the unimolecular dissociation rate constant kuni as a function of the energy: k(E).
3.3. Collisional energy transfer
In a binary collision, the maximal energy available for transfer into internal energy is the relative energy in the center-of-mass frame of reference (Erel). A simple
relationship between the laboratory collision energy (Elab) and Erel is given by equation
(3.5): lab i n n rel m m m E E + = (3.5)
where mn is the mass of the neutral target gas and mi is the mass of the ion of interest.
The collision is inelastic if part of Erel is converted into internal energy7,8.
In single collision conditions, the collision has to be activating. Part of the relative translational energy has to be converted into internal energy of the ion. In the experimental conditions used throughout this study (Elab» 10 to 100 eV and high mass
ions), electronic excitation of the ions is usually ignored. Basically two mechanisms can account for the transfer of translational to vibrational energy7.
The first mechanism is the formation of a long-lived complex between the ion and the target gas. In this case all the relative kinetic energy Erel is present in the complex and
redistributed. When the complex dissociates, the fraction of Erel converted into internal
energy of the ion depends on the lifetime of the complex (which increases with the depth of the interaction potential energy well, with the number of degrees of freedom of the complex, and decreases with Erel), and on the fraction of the total number of
degrees of freedom of the complex present in the ion. The energy transfer is very efficient but works well only for low Erel values.
The second mechanism is called the “impulsive collision mechanism”. For large molecules, the collision can be viewed as inelastic with the whole molecule, but elastic with one subunit. The recoil of that subunit is responsible for the elongation of some bonds and the recoil energy is transferred to vibrational energy that can be subsequently redistributed. The efficiency of this mechanism is typically lower than for the mechanism of complex formation, but it is favored at higher Erel. The
interaction time between the target and the ion has to be in the order of a period of vibration.
The same mechanisms apply for each collision in the case of multiple collision conditions. This situation is encountered in the electrospray source, in MS/MS in the
quadrupole ion trap, and possibly in MS/MS in quadrupole collision cells. In the multiple collisions that an ion encounters during its lifetime, some can be activating and some can be deactivating. Hoxha et al.9 have shown that multiple collisions in the electrospray source can lead ultimately to a Boltzmann-like internal energy distribution.
3.4. Unimolecular dissociation theory
RRKM theory of unimolecular dissociation: k(E)
The (Rice-Rampsberger-Kassel-Marcus) RRKM theory of unimolecular dissociation3,10-14 is based on two assumptions: one is the existence of a transition state which irreversibly separates the reactant from the products of the reaction, and the other is the statistical redistribution of the total internal energy among the degrees of freedom of the reactant before the dissociation takes place15-17. RRKM is a statistical theory: the dissociation rate depends on the ratio between the number of favorable complexions (for which there is enough energy in the reaction coordinate to cross the transition state characterized by an energy barrier E0) and the total number of
complexions (all the possible ways of distributing the internal energy in the molecule). The microcanonical unimolecular rate constant is given by:
) ( ) ( ) ( ) ( ) ( 0 0 0 E hN dE E N E hN E E G E k E E u u ‡ ‡ ò × × s = -× s = -(3.6) where s is the reaction path degeneracy, E0 is the difference between the zero point
energy of the transition state and the zero point energy of the reactant, G‡(E - E0) is the
number of states of the transition state whose energy lies in the range [0, E - E0], h is
the Plank constant, N(E) is the density of states of the reactant at energy E, and N‡(Eu)
is the density of states of the reactant at energy Eu. Calculation of k(E) requires the
knowledge of E0, the density of states of the reactant, and that of the transition state.
The latter is the most difficult to evaluate because it requires the geometry and the frequencies of the transition state.
Substantial simplification of the RRKM equation is possible if the density of states is given by the classical approximation. This leads to the RRK equation:
1 0 ) ( -÷÷ø ö ççè æ -× n = DOF s E E E E k (3.7)
where ns is a frequency factor and DOF is the number of degrees of freedom of the
reactant. Though oversimplified, this equation is useful to help understanding some of the factors influencing the rate constant. The internal energy has to be higher than the barrier E0 for the reaction to proceed (it there is no tunnel effect), and the higher the
internal energy, the faster the reaction: there are more chances to have an energy E >
E0 in the particular degree of freedom which is the reaction coordinate s. Moreover,
the larger the number of degrees of freedom in the reactant, the slower the reaction: there are more ways to redistribute the internal energy, and thus less chance for it to go in the reaction coordinate. The RRK formula is convenient to give an estimate of the rate constant.
The kinetic shift
Figure 3-1 shows a typical k(E) curve. The reaction starts at the threshold E0, and the
rate constant increases as the available energy increases. The time scale of the experiment limits the range of k that are measurable and prevents from observing the reaction at the true threshold E0. An example, adapted from reference 18, is given in
Figure 3-1 for a quadrupole instrument. It was calculated that only the ions dissociating with a rate constant ³ 104 s-1 can be detected as fragments. This results in
an apparent threshold Eapp larger than the true threshold E0. The difference between the Eapp and E0 is called the kinetic shift1,19,20.
Figure 3-1. Typical k(E) curve: result of a RRKM calculation on p-CH3 benzylpyridinium cation with E0 = 1.6
eV and a loose transition state. The minimum rate constant that allows the observation of a fragment is 104 s-1. The
apparent threshold is therefore equal to 2.9 eV.
3.5. Dissociation kinetics of ions with an internal energy
distribution
Here the ensemble is no more microcanonical, as the ion have an internal energy distribution P(E), and not a single energy E.
The rapid energy exchange limit
When the activation/deactivation rates are higher than the dissociation rate, the internal energy distribution P(E) is determined by the equilibrium established by activation/deactivation, and is not perturbed by the negligible contribution of the dissociation4,5,21. This limiting case is sometimes reached in multiple collisional activation or with blackbody radiative activation of large molecules at very low pressures. In multiple collision activation, the distribution P(E) depends on the mean energy reached when activation and deactivation events occur at the same rate, and
P(E) takes the form of a Maxwell-Boltzmann distribution. This distribution can be
assigned a temperature, called the effective temperature1,22-26 (Teff): the term
“effective” is used because this is not strictly a thermal equilibrium with a bath gas at temperature T.
In blackbody infrared radiation dissociation (BIRD), the temperature of the Boltzmann distribution is equal to the temperature of the walls of the reaction chamber. The observed dissociation rate constant (the canonical rate constant) is the average of the unimolecular rate constant k(E) over the energy distribution P(E):
ò = ¥ 0 ( ) ( ) E obs P E k E dE k (3.8)
and if k(E) is given by the RRKM equation (3.6) and P(E) by the Maxwell-Boltzmann distribution (3.2), it can be demonstrated that the observed rate constant dependence on the temperature takes the form of the Eyring equation:
÷ ø ö ç è æ D ÷ ø ö ç è æ D = RT H R S h kT T
kobs( ) exp * exp * (3.9)
In practice, the experimental values of the rate constant as a function of temperature are fitted with the Arrhenius equation:
÷÷ø ö ççè æ -= kT E A T kobs( ) .exp a (1.19)
A plot of ln(kobs) versus 1/T yields the activation energy Ea (slope) and the
pre-exponential factor A (intercept). Ea is an experimental value that can be related to the
true threshold E0 by the Tolman theorem: the activation energy is the difference
between the thermal energy of reacting molecules (thermal energy of the transition state + E0) and the thermal energy of all reactant molecules3,27. In the rapid energy
exchange limit, Ea » E0, as the Boltzmann distribution is not perturbed by the
dissociation5,6,21.
The slow energy exchange limit
When the dissociation rate is higher than the activation/deactivation rates, the limiting step is now activation: as soon as a molecule has enough internal energy, it dissociates4 and the energy distribution is depleted at high energies. The situation is
more complicated because the observed dissociation rate constant depends on the activation parameters, in addition to the characteristics of the transition state. Determination of the relationship between kobs and the threshold E0 requires modeling
of the activation process. If the internal energy distribution can be characterized by a temperature, Arrhenius plots of experimental data give an experimental value of Ea
and A, but the average energy of molecules undergoing reaction is lower due to the depletion of the distribution at higher energies: Ea < E0, and the pre-exponential factor A is underestimated as well21,28.
An interesting case to consider is the metastable decay of a population of ions characterized with an energy distribution P(E). During metastable decay (during a time
t), ions unimolecularly dissociate with kuni depending on their initial energy, and no
more activation/deactivation occurs. In this case, all parent ions with an energy E ³
Eapp (Eapp depending on the time t and on k(E), see Figure 1-5) will dissociate. After a
time t, the starting internal energy distribution P(E) is truncated for energies greater than Eapp5,28,29 (Figure 3-2).
Figure 3-2. Typical Maxwell-Boltzmann internal energy distribution: P(E) for p-CH3 benzylpyridinium cation at T = 1000 K.
If t = 10-4 s, Eapp = 2.95 eV (see Figure 3-1). The fraction of parent
ions that fragment before 10-4 s is given by the integral below the
Intermediate cases
In intermediate cases where activation, deactivation and fragmentation proceed on the same time scale, a detailed modeling of the activation/deactivation and dissociation processes by random walk simulations or master equation is required6,20,21,29-32. The probability and the energy step size of the activation and deactivation events must be known, and kuni is calculated for each energy E by the RRKM formalism.
3.6. High mass ions
With single collision activation in beam-type instruments (t = 10-4 – 10-6 s), observing dissociation is increasingly difficult when the mass of the parent ion increases. This is due first to the low relative kinetic energy that can be transferred to the ion during collision with a small neutral, and second to the large kinetic shift resulting from the high number of degrees of freedom (high density of states) of the molecule. Other techniques are therefore preferred for the study of high mass ion dissociation. Ion trapping (QIT or FTICR) instruments can be used to access longer reaction times (t = 10-2 – 102 s) and therefore to lower the kinetic shift. The number of collisions can also be increased: this is known as “slow heating”4. Moreover, for high mass ions, the thermal energy content of the ions before collision can become substantial as the number of atoms increases33 and should not be neglected.
As the number of degrees of freedom increases, RRKM calculations and modeling of activation and deactivation processes in order to relate the observed rate constant to the true threshold E0 become challenging. An elegant bypass is the BIRD method. For
large molecules, as the density of states increases, radiative processes can become competitive at low pressures (typical of FTICR instruments). The reaction rates can be measured as a function of the temperature of the walls of the ICR chamber, and the activation energy is determined from an Arrhenius plot. A true thermal equilibrium is established within the reaction vessel, through IR photon absorption and emission. For other activation methods, a convenient way to describe the internal energy distribution of high mass molecules is by considering an effective temperature Teff, which is the
temperature of the Maxwell-Boltzmann distribution that would produce the same effect as the true distribution. However, deviation from the rapid energy exchange
limit is a major problem for relating kobs to E0. Moreover, the problem of how Teff
varies with the size of the ion in given activation conditions has not been established yet, so that the effective temperatures found for model small ions can not be transposed yet to high mass ions.
Finally, a more fundamental issue for high mass ions is whether they still behave statistically, i.e. whether the energy is redistributed on the whole molecule before dissociation occurs. It seems that energy transfer may be more efficient than for small molecules, or that energy transfer into some moiety of the molecule leads to dissociation before complete randomization8; this means that the RRKM formalism may not be valid. But the fact that internal energy may not be relaxed before dissociation takes place is not in contradiction with a statistical behavior of the whole population of molecules, as internal energy input by collision is a nonselective process which can lead to a statistical initial sampling of the molecular phase space.
References
1. K. Vékey; Internal Energy Effects in Mass Spectrometry. J. Mass Spectrom. 1996, 31: 445.
2. F.A. Lindemann, S. Arrhenius, I. Langmuir, N.R. Dhar, J. Perrin, W.C. Lewis; Discussion. Trans. Faraday Soc. 1922, 17: 598.
3. J.I. Steinfeld, J.S. Francisco, W.L. Hase Chemical Kinetics and Dynamics; Prentice Hall: New Jersey, 1999, Chapter 11, pp. 324-389.
4. S.A. McLuckey, D.E. Goeringer; Slow Heating in Tandem Mass Spectrometry. J.
Mass Spectrom. 1997, 32: 461.
5. R.C. Dunbar, T.B. McMahon; Activation of Unimolecular Reactions by Ambient Blackbody Radiation. Science 1998, 279: 194.
6. W.D. Price, P.D. Schnier, R.A. Jockusch, E.F. Strittmatter, E.R. Williams; Unimolecular Reaction Kinetics in the High-Pressure Limit Without Collisions.
J. Am. Chem. Soc. 1996, 118: 10640.
7. S.A. McLuckey; Principles of Collisional Activation in Analytical Mass Spectrometry. J. Am. Soc. Mass Spectrom. 1991, 3: 599.
8. A.K. Shulka, J.H. Futrell; Tandem Mass Spectrometry: Dissociation of Ions by Collisional Activation. J. Mass Spectrom. 2000, 35: 1069.
9. A. Hoxha, C. Collette, E. De Pauw, B. Leyh; Mechanism of Collisional Heating in Electrospray Mass Spectrometry: Ion Trajectory Calculations. J. Phys. Chem.
A 2001, 105: 7326.
10. W. Forst The Theory of Unimolecular Reactions; New York, Londres, 1973. 11. R.G. Gilbert, S.C. Smith Theory of Unimolecular and Recombination Reactions;
Oxford, 1990.
12. J.C. Lorquet; Whither the Statistical Theory of Mass Spectra. Mass Spectrom.
13. T. Baer, P.M. Mayer; Statistical Rice Ramsperger Kassel Marcus Quasiequilibrium Theory Calculations in Mass Spectrometry. J. Am. Soc. Mass
Spectrom. 1997, 8: 103.
14. W.L. Hase; Some Recent Advances and Remaining Questions Regarding Unimolecular Rate Theory. Acc. Chem. Res. 1998, 31: 659.
15. I. Oref, B.S. Rabinovitch; Do Highly Reactive Polyatomic Molecules Behave Ergodically ? Acc. Chem. Res. 1979, 12: 166.
16. B.K. Carpenter; Dynammic Behavior of Organic Reactive Intermediates. Angew.
Chem. Int. Ed. Engl. 1998, 37: 3340.
17. D. Boyall, K.L. Reid; Modern Studies of Intramolecular Vibrational Energy Redistribution. Chem. Soc. Rev. 1997, 26: 223.
18. C. Collette, L. Drahos, E. De Pauw, K. Vékey; Comparison of the Internal Energy Distributions of Ions Produced by Different Electrospray Sources. Rapid
Commun. Mass Spectrom. 1998, 12: 1673.
19. C. Lifshitz; Time-Resolved Appearance Energies, Breakdown Graphs, and Mass Spectra: the Elusive "Kinetic Shift". Mass Spectrom. Rev. 1982, 1: 309.
20. R.C. Dunbar; New Approaches to Ion Thermochemistry Via Dissociation and Association. Adv. Gas Phase Ion Chem. 1996, 2: 87.
21. W.D. Price, E.R. Williams; Activation of Peptide Ions by Blackbody Radiation: Factors That Lead to Dissociation Kinetics in the Rapid Energy Exchange Limit.
J. Phys. Chem. A 1997, 101: 8844.
22. P.D. Schnier, J.C. Jurchen, E.R. Williams; The Effective Temperature of Peptide Ions Dissociated by Sustained Off-Resonance Irradiation Collisional Activation in Fourier Transform Mass Spectrometry. J. Phys. Chem. B 1999, 103: 737. 23. K.G. Asano, D.E. Goeringer, S.A. McLuckey; Thermal Dissociation in the
Quadrupole Ion Trap: Ions Derived From Leucine Enkephalin. Int. J. Mass
24. D.E. Goeringer, K.G. Asano, S.A. McLuckey; Ion Internal Temperature and Ion Trap Collisional Activation: Protonated Leucine Enkephalin. Int. J. Mass
Spectrom. 1999, 182/183: 275.
25. K.G. Asano, D.J. Butcher, D.E. Goeringer, S.A. McLuckey; Effective Ion Internal Temperatures Achieved Via Boundary Activation in the Quadrupole Ion Trap : Protonated Leucine Enkephalin. J. Mass Spectrom. 1999, 34: 691.
26. L. Drahos, R.M.A. Heeren, C. Collette, E. De Pauw, K. Vékey; Thermal Energy Distributions Observed in Electrospray Ionization. J. Mass Spectrom. 1999, 34: 1373.
27. D.G. Truhlar; Interpretation of the Activation Energy. J. Chem. Educ. 1978, 55: 309.
28. R.C. Dunbar; Kinetics of Low-Intensity Infrared Laser Photodissociation. The Thermal Model and Application of the Tolman Theorem. J. Chem. Phys. 1991, 95: 2537.
29. R.C. Dunbar; Kinetics of Thermal Unimolecular Dissociation by Ambient Infrared Radiation. J. Phys. Chem. 1994, 98: 8705.
30. D.E. Goeringer, K. Asano, S.A. McLuckey; Ion Internal Temperature and Ion Trap Collisional Activation: Protonated Leucine Enkephalin. Int. J. Mass
Spectrom. Ion. Proc. 1998, 182/183: 275.
31. K. Asano, D.E. Goeringer, S.A. McLuckey; Thermal Dissociation in the Quadrupole Ion Trap: Ions Derived From Leucine Enkephalin. Int. J. Mass
Spectrom. Ion. Proc. 1998, 185/186/187: 207.
32. L. Drahos, K. Vékey; MassKinetics: a Theoretical Model of Mass Spectra Incorporating Physical Processes, Reaction Kinetics and Mathematical Descriptions. J. Mass Spectrom. 2001, 36: 237.
33. L. Drahos, K. Vékey; Determination of the Thermal Energy and Its Distribution in Peptides. J. Am. Soc. Mass Spectrom. 1999, 10: 323.
4.
E
LECTROSPRAY
M
ASS
S
PECTROMETRY OF
N
ONCOVALENT
C
OMPLEXES
The capability of electrospray ionization mass spectrometry for detecting a noncovalent complex has been first demonstrated in 19911. Since then, the literature concerning supramolecular complex analysis by ES-MS is constantly growing. The complexes studied to date include synthetic systems (cation-macrocycle, supramolecular assemblies,…), and complexes of biochemical interest (protein-protein, protein-ligand, protein-DNA, protein-RNA associations, etc…), and this list is not exhaustive. The goal of this chapter is not to make a comprehensive literature overview, but to classify the various information electrospray ionization mass spectrometry can provide about supramolecular complexes.
4.1. Information on the species present in solution
Determination of the stoichiometry of the complexes and
identification of their constitutive ligands
The great advantage of mass spectrometry for the characterization of noncovalent complexes is of course the possibility to measure the masses of the species, and thus to allow a rapid and unambiguous assignment of the stoichiometry of the observed complexes. Their constituents can also be identified by their masses, and if necessary by MS/MS or MSn experiments. MSn is useful for the identification of a constituent by its fragmentation after the breaking of the complex in a first MS/MS step.
The critical point when starting the study of a new system is to determine whether or not the observed complexes reflect the specific interactions occurring in solution. Are all the complexes in the solution detectable by MS (aren't there false negatives)? Are all the detected complexes really present in solution (aren't there false positives)? Whether mass spectrometry accurately reflects the composition of the solution depends on the experimental parameters. Smith et al.2,3 have suggested a series of tests to discriminate between specific and nonspecific complexes:
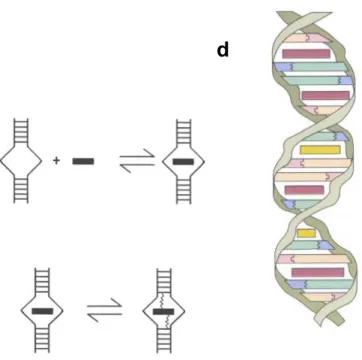
(i) Specific molecular recognition results in complexes of well-defined stoichiometries, with defined binding constants. However, nonspecific aggregation, often driven by electrostatic interactions, results in random association. Experimental conditions must be tuned to minimize random aggregation and to allow only the observation of the specific complexes of well-defined stoichiometries4. One way to do so is to investigate the influence of the dilution of the sample: if few molecules are present per droplet, electrostatic aggregation upon evaporation of the solvent is minimized.
(ii) According to Smith et al.2,3, the lability of a complex may also be indicative of its specificity: a specific complex is supposed to be more stable in the gas phase than a nonspecific one. It will thus survive longer to collisional activation in the source of the spectrometer. A fine tuning of the cone voltage of the source is necessary to disrupt the nonspecific complexes while keeping intact the specific ones, achieving nevertheless a sufficient desolvation of these species.
(iii) The composition of the solution is also a very important parameter: biological complexes are often stable only in a narrow range of solution pH and ionic force, and do rarely tolerate the addition of organic co-solvents. These conditions are unfortunately not ideal for electrospray ionization mass spectrometry. Adding organics like methanol or acetonitrile in the solution to obtain a stable spray, changing the pH to enhance the ionization yield, often result in a denaturation of the complex. However, this can be used to test the specificity of the observed complex. When performing the analysis in denaturing solution conditions, no more complex should be observed, as it is no more present in the solution.
(iv) The specificity of an observed ligand-substrate complex can also be unambiguously proved by comparison with a solution in which the ligand (or the substrate) has been replaced by a molecule of homologous structure, but which is known not to bind to the substrate (or to the ligand). For that test solution, no
complex should be observed in ES-MS because none is present in solution, all other parameters being the same.
Determination of relative and absolute binding constants in
solution
While the position of the peaks on the m/z scale allows the identification of the species, their intensities can be related to the concentrations in solution. Electrospray ionization mass spectrometry thus offers the possibility of an alternative method for determining binding constants in solution. The validation of such new method of course implies the comparison of the results with constants determined in solution by proven traditional methods (fluorescence, UV or NMR titration, titration calorimetry,…).
Establishing for one of the ligands a calibration of the intensity (number of counts) as a function of the solution concentration allows the determination of the concentration of free ligand upon titration of a known quantity of substrate by that ligand. The concentration of bound ligand is calculated by the difference between the total amount of ligand added and the free ligand concentration determined using the calibration curve. A Scatchard plot5 of the results of the titration gives access to the stoichiometry and the association constant of the complex6,7.
Another method for determining Ka (eq. 1.4) is to measure the relative intensity of the
peaks corresponding to the complex AB and to the free substrate A (or B), and to calculate the ratio of the concentrations by equation (4.1), assuming that the response factors of A and AB are identical:
] [ ] [ ) ( ) ( A AB A I AB I = (4.1)
The association constant can be determined with a single mass spectrum8-12 or by fitting data obtained by a titration experiment13-15. This methodology can be applied to the case of complexes with multiple stoichiometries15 or when different ligands are in competition for binding to a given target10,12,16. The assumption that the response factors of the complex and the free ligand are the same, has been validated by comparison with independent solution-phase data in the case of vancomycin-peptide
complexes10. This has been attributed to the fact that the peptide is imbedded in the complex and that the conformation of vancomycin does not change.
An important factor worth to mention is the strong influence of the ion activation in the electrospray source. The ideal case is when the specific complexes are sufficiently stable to reach the detector. If not, it will cause an underestimation of the binding constant10.
A method for determining the ratio between the response factors of the complex and the free ligands is to perform two independent measurements in which the equilibrium was shifted completely to the left, then to the right, by using appropriate media. In one study of the dimer Û hexamer equilibrium of citrate synthase17, a correction factor of
0.77 was determined, and the equilibrium association constant in the solution of interest could be determined subsequently. Such a procedure to determine the ratio of the response factors is rigorous, but not of general applicability.
The determination of binding selectivities by measuring the ratio of two complexes when two ligands are in competition (equimolar mixture) for a given substrate18-28, mainly applied to cation-crown ether complexes, is also based on a similar approximation: the response factors of the two complexes have to be the same. Application of this method for the screening of a library of ± 250 synthetic peptides
for a given receptor has been reported29. The quantification and identification of the ligands were made by MS/MS and MSn in a FTICR mass spectrometer.
By comparison of the mass spectrometric results with the theoretical intensities (calculated from known association constants19,20,22,23 or determined experimentally by shifting the equilibria to the right by adding an excess of reactant18,30), the approximation was proven to be valid when comparing complexes of the same host with different guest cations, but not in the opposite situation19,20,22,23. When trying to generalize the results, we see that the response factor is very sensitive to both the conformation and the charge of the considered molecule. The question is how sensitive is the method to conformational variations, and how to predict in which cases the method will (or won't) give acceptable results.
A method avoiding any approximation on the response factors has been recently proposed by Kempen and Brodbelt31. It consists in monitoring the intensity of a reference complex before and after the addition of a competing host or guest. The calibration curve of the intensity of the reference complex requires the knowledge of the equilibrium association constant Ka of that complex.
Study of the conformation of the complexes in solution
The conformation of the complexes in solution can also be studied by hydrogen/deuterium exchange with a detection by high resolution mass spectrometry9,32,33. In this case, if the complex is formed quantitatively in solution, there is no more requirement for maintaining the complex intact in the mass spectrometer. The subunits can be studied separately if they come from the dissociation of the specific complex, provided that no rearrangement of the deuterium atoms occurs in between.
4.2. Study of noncovalent complexes in the gas phase
Measurement of equilibrium constants in the gas phase
Measuring equilibrium constants in the gas phase is very difficult experimentally. For example, for the equilibrium (4.2), the determination of the equilibrium constant requires the measurement of the ratio of the charged species (given by the relative intensities of these charged species), but also the ratio between the partial pressures of the neutrals, which are not detected by the mass analyzer.
[Ligand1 + M+] + Ligand2 F [Ligand2 + M+] + Ligand1 (4.2)
2 1 ) 1 ( ) 2 ( 2 1 ] 1 [ ] 2 [ Ligand Ligand M Ligand M Ligand Ligand Ligand eq p p I I p M Ligand p M Ligand K = × × + × + = + + + + + + (4.3)
This method is only applicable to sufficiently volatile ligands (for example small crown ethers and cryptands34-37, or small organic molecules complexed by charged cavitands38,39), and the relative pressures of the neutrals are measured by indirect ways like their relative protonation yields. This is of course the major source of error. The most suitable instrument allowing equilibration for a sufficiently long time is the FTICR-MS.
The comparison between the solution phase and the gas phase equilibrium constants revealed very interesting features. Macrocyclic34 and cryptate effects35 persist in the gas phase: they are thus not only due to the effect of the solvent, but the
pre-arrangement of the donor groups intrinsically play a role in the stability of the complex. However, the "best fit" principle, according to which the most stable complexes in solution are obtained when the closest match between the cation size and the ligand cavity is achieved, is not verified in the gas phase. The gas phase affinity depends directly on the number of donor atoms in the ligand, and on the charge density of the cation. In solution, the smallest cations are also the most solvated ones, and there is competition between the solvent and the ligand for binding the cation.
Dissociation of the complexes in the gas phase
In all the methods mentioned below, some internal energy is given to the complex, which causes its unimolecular dissociation in the gas phase. As only the dissociation occurs, it is not an equilibrium like in the previous case. The dissociation can be monitored in time, but most often the dissociation time is fixed, either by instrumental constraints, or by the experimentalist.
Collision-induced dissociation (CID)
Internal energy is given by collisions, either in the electrospray source (source-CID)
40-44 or in MS/MS experiment45-48. In MS/MS, the complex is mass-selected before CID.
In source-CID, all ions produced by electrospray undergo collisional activation, but it allows the study of very large complexes (too high m/z to be selected for MS/MS42). Most papers report the dissociation as a function of the collision energy in the laboratory frame of reference, or more simply as a function of the experimental parameters as tuned directly on the mass spectrometer (orifice-skimmer voltage in electrospray source, activation amplitude in SORI-CID, …). Only few papers report the energy in the center-of-mass frame of reference44,45, which is particularly important when comparing complexes of different masses. The discussion of the results is always based on the qualitative comparison between the resistance to dissociation in the gas phase and the stability in solution. These comparisons are sometimes made via a parameter E50 or V50, which is the energy or voltage at which 50% of the complex is