Shp-2 is critical for ERK and metabolic engagement
downstream of IL-15 receptor in NK cells
Charlène Niogret
1
, S.M.Shahjahan Miah
2
, Giorgia Rota
1
, Nicolas P. Fonta
1,3
, Haiping Wang
4,5
, Werner Held
4
,
Walter Birchmeier
6
, Veronica Sexl
7
, Wentian Yang
8
, Eric Vivier
9,10,11
, Ping-Chih Ho
4,5
,
Laurent Brossay
2
& Greta Guarda
1,3
The phosphatase Shp-2 was implicated in NK cell development and functions due to its
interaction with NK inhibitory receptors, but its exact role in NK cells is still unclear. Here we
show, using mice conditionally de
ficient for Shp-2 in the NK lineage, that NK cell
develop-ment and responsiveness are largely unaffected. Instead, we
find that Shp-2 serves mainly to
enforce NK cell responses to activation by IL-15 and IL-2. Shp-2-de
ficient NK cells have
reduced proliferation and survival when treated with high dose IL-15 or IL-2. Mechanistically,
Shp-2 de
ficiency hampers acute IL-15 stimulation-induced raise in glycolytic and respiration
rates, and causes a dramatic defect in ERK activation. Moreover, inhibition of the ERK and
mTOR cascades largely phenocopies the defect observed in the absence of Shp-2. Together,
our data reveal a critical function of Shp-2 as a molecular nexus bridging acute IL-15 signaling
with downstream metabolic burst and NK cell expansion.
https://doi.org/10.1038/s41467-019-09431-3
OPEN
1Department of Biochemistry, University of Lausanne, 1066 Epalinges, Switzerland.2Department of Molecular Microbiology and Immunology and Graduate
Program in Pathobiology, Division of Biology and Medicine, Brown University Alpert Medical School, Providence, RI 02912, USA.3Università della Svizzera italiana (USI), Faculty of Biomedical Sciences, Institute for Research in Biomedicine, 6500 Bellinzona, Switzerland.4Department of Oncology UNIL CHUV, University of Lausanne, 1066 Epalinges, Switzerland.5Department of Fundamental Oncology, University of Lausanne, 1066 Epalinges, Switzerland.6 Max-Delbrueck-Center for Molecular Medicine (MDC) in the Helmholtz Society, 13125 Berlin, Germany.7Department for Biomedical Sciences, Institute of Pharmacology and Toxicology, University of Veterinary Medicine, 1210 Vienna, Austria.8Department of Orthopaedics, Rhode Island Hospital and Brown University Alpert Medical School, 1 Hoppin Street, Providence, RI 02903, USA.9Centre d’Immunologie de Marseille-Luminy, Aix Marseille Université, Inserm, CNRS, Avenue de Luminy, 13288 Marseille, France.10Service d’Immunologie, Hôpital de la Timone, Assistance Publique-Hôpitaux de Marseille, 13385
Marseille, France.11Innate Pharma Research Labs., Innate Pharma, 117 Avenue de Luminy, 13276 Marseille, France. These authors contributed equally:
Charlène Niogret, S. M. Shahjahan Miah. These authors jointly supervised this work: Laurent Brossay, Greta Guarda. Correspondence and requests for materials should be addressed to L.B. (email:laurent_brossay@brown.edu) or to G.G. (email:greta.guarda@irb.usi.ch)
123456789
N
atural killer (NK) cells are innate cytotoxic lymphocytes
poised to eliminate infected or transformed cells. NK cell
effector functions are tightly regulated by the balance of
activating and inhibitory signals. In healthy individuals, the
bal-ance is dominated by inhibitory signals. This is accomplished via
the recognition of self-molecules, such as major
histocompat-ibility (MHC) class I, by a variety of inhibitory receptors
expressed at their cell surface
1,2. Interestingly, inhibitory receptor
engagement by MHC class I molecules, somewhat
counter-intuitively, is also required during NK cell development for
conferring optimal NK cell function
1–4. In support of this, NK
cells from MHC class I-deficient animals are largely
hypor-esponsive to activating receptor-mediated stimuli
4–6. NK cell
inhibitory receptor signaling is mediated by phosphatases,
including the SH2-containing inositol phosphatase-1 (SHIP-1)
and the crucial SH2 domain-containing tyrosine phosphatase-1
(Shp-1)
7–11, which is recruited to the inhibitory receptor
immu-noreceptor tyrosine-based inhibitory motifs (ITIM) upon
engagement. Confirming the critical role of inhibitory receptor
engagement in NK cell education, Shp-1-deficient NK cells are
hyporesponsive.
Shp-2 (encoded by the gene Ptpn11) is a tyrosine phosphatase
that—together with its close relative Shp-1—belongs to the
family of SH2 domain-containing protein tyrosine phosphatases
(PTPs)
12. Both phosphatases bear two SH2 domains in their
N-terminal part followed by a PTP domain responsible for the
catalytic activity. In the inactive state, the SH2 domains bind the
PTP region, thereby blocking access of substrates to the active
site. This auto-inhibition is relieved upon binding of the SH2
domains to phosphotyrosine residues on targets, including ITIMs
of inhibitory receptors, rendering the catalytic site accessible
12.
As shown by the embryonic lethality of full-body deleted mice,
Shp-2 plays essential developmental functions, being involved in
cell growth, differentiation, proliferation, and survival
12. In
humans, SHP-2 loss-of-function results in Leopard syndrome, a
severe disease marked by skeletal malformation, short stature,
heart disease and mental retardation. SHP-2 gain-of-function
mutations result in Noonan syndrome, which shares clinical
features with Leopard syndrome
13. Shp-2 exerts atypical effects,
as it has mainly been ascribed positive roles in regulating growth
factor and hormone receptor signaling. The best-characterized
functions of Shp-2 are the positive regulation of the
mitogen-activating protein kinases (MAPK) and—to some extent—the
modulation
of
the
phosphoinositide
3-kinase
(PI3K)-Akt and mammalian target of rapamycin (mTOR) pathway
downstream of various growth factor receptors in different
tissues
12,14–18. Shp-2 has therefore been proposed to
depho-sphorylate negative regulators of the MAPK pathway
12. Along
these lines, SHP-2 overactivation is involved in cancer
develop-ment and novel inhibitors have been developed to treat these
malignancies
19,20. Last, as SHP-2 has been shown to interact with
the ITIMs of NK cell inhibitory receptors
21,22, an inhibitory role
in NK cells was predicted. However, this assumption has not been
experimentally confirmed.
Because Shp-2 is required for embryonic development, we
generate mice conditionally deficient for Shp-2 in the NK lineage.
In contrast to Shp-1 and SHIP-1 phosphatases, we
find that Shp-2
is largely dispensable for NK cell education. Instead, the absence
of Shp-2 is disadvantageous when NK cells are exposed to high
IL-15 doses. This phenotype is linked to a markedly impaired
engagement of ERK and to a compromised metabolic activation.
In agreement with these
findings, Shp-2-deficient Ly49H
+NK
cells have defective proliferation during MCMV infection. Taken
together, these data uncover an unanticipated role of Shp-2 in NK
cells, identifying this phosphatase as an essential node in NK cell
metabolism downstream of the IL-15 receptor.
Results
Ncr1cre Ptpn11
fl/flmice exhibit increased NK cell numbers.
Ptpn11 is expressed in NK cells, as shown by measuring transcript
abundance in developing bone marrow (BM) as well as splenic
NK cells of intermediate CD27
+CD11b
+(DP) and mature CD27
−CD11b
+(CD11b SP) stage (Supplementary Fig. 1a). We thus
sought to determine the contribution of Shp-2 to NK cell
development and functions by generating two independent NK
cell-specific knockout lines. In one case, Ptpn11
fl/fl(exons 3 and
4) mice were crossed to the Ncr1cre
Kideleter strain (knock-in for
a Cre recombinase under the control of the Ncr1 promoter, which
is active in NK cells at the immature-mature stage; hereafter
referred to as Ncr1
KiPtpn11
fl/fl)
15,23. This led to a virtually
complete Shp-2 deletion in NK cells (Supplementary Fig. 1b). In
the second case, Ptpn11
fl/fl(exon 11) mice were bred with the
Ncr1cre
Tgdeleter strain (transgenic for Cre under the control of
the Ncr1 promoter; hereafter referred to as Ncr1
TgPtpn11
fl/fl)
24,25.
As the efficiency of Cre-mediated deletion in this model was not
complete, these mice were further crossed to a reporter strain
expressing YFP upon Cre recombinase activity, which faithfully
paralleled Shp-2 deletion (Supplementary Fig. 1c).
We next assessed the abundance of NK lymphocytes in the
spleen of Ncr1
KiPtpn11
fl/fland Ncr1
TgPtpn11
fl/flmice.
Interest-ingly, and in contrast to Shp-1 deficient animals
7, we found that
NK cell frequency and number were higher in mice conditionally
deficient for Shp-2 in the NK lineage than in controls (Fig.
1
a, b).
We next assessed whether this phenotype was observed during
their development. No significant differences were observed in
percentages and numbers of CD122
+NK cells, as well as in their
developmental stages, as measured by the sequential acquisition
of NK1.1 and DX5 in the bone marrow (BM) of Ncr1
KiPtpn11
fl/flmice or Ncr1
KiPtpn11
wt/wtcontrols (Supplementary Fig. 1d and
e). However, maturation of Shp-2-deficient BM NK cells was
slightly altered, exhibiting increased percentages and numbers of
the most mature CD11b SP subset (Fig.
1
c). We also analyzed the
maturation status of NK lymphocytes in spleen and liver. Similar
to the BM, frequency and number of CD11b SP NK cells were
higher than in controls in the spleen of both Shp-2-deficient
models, and in the liver (Fig.
1
d, e, and f). In the liver, similarly to
other organs, conventional NK cell frequency and number were
increased. In contrast, ILC1 (CD49a
+DX5
−) frequency and
number were decreased (Supplementary Fig. 1f). Importantly,
mixed BM chimeras demonstrated that Shp-2 controlled the
numbers of mature NK cells in a cell-intrinsic manner
(Supplementary Fig. 1g). Taken together, data from two
independent mouse models show that Shp-2 limits the number
of the most mature NK cell subset.
Shp-2-deficient NK cells are educated. Because inhibitory
receptors expressed on NK cells have been shown to recruit
Shp-2, we investigated the education state of NK cells lacking this
phosphatase
21,22. We
first characterized the receptor repertoire,
which exhibits increased levels of Ly49 inhibitory receptors and
decreased expression of KLRG1 in non-educated NK cells, as
exemplified by NK cells derived from β2 m
−/−mice (Fig.
2
a).
However, Shp-2 deficiency did not cause such changes, allowing
expression of a largely normal repertoire (Fig.
2
a).
To assess the role of Shp-2 in NK cell effector functions, we
first measured their ability to produce cytokines and cytotoxic
mediators in response to phorbol 12-myristate 13-acetate (PMA)/
ionomycin stimulation. No defects in Granzyme A (GzmA),
GzmB, or degranulation (quantified by surface CD107α) were
observed (Fig.
2
b). We then examined the effector response to
“missing-self” targets and induced by engagement of two well
characterized NK cell activating receptors, NKG2D and Ly49H.
We performed an in vitro killing assay using RMA cells (H-2
b)
and variants lacking MHC class I (RMA-S), or bearing the
NKG2D ligand H60 (RMA-H60
26) as targets. We found that
Shp-2-deficient and wild-type in vivo primed NK cells killed RMA-S
and RMA-H60 to comparable extents (Fig.
2
c). Using RMA cells
transfected with the Ly49H ligand M157, we observed that
Shp-2-deficient and wild-type Ly49H
+NK cells exhibited comparable
degranulation levels (Fig.
2
d). Taken together, these data
demonstrate that the absence of Shp-2 does not impair NK cell
effector functions. This contrasts with the hyporesponsive
phenotype of both SHIP-1 and Shp-1 deficient NK cells
7–11.
Role of Shp-2 in response to IL-15. Our
finding that
Shp-2-deficient mature NK cells were increased in numbers as compared
with control NK cells led us to investigate their response to IL-15,
which is essential for NK cell proliferation and survival
27. We
first
assessed the expression of the IL-15 receptor (IL-15R) chains on
Ptpn11-deficient and control NK cells
28. Both common
γ subunit
(γc; CD132) and IL-15Rβ chain (CD122) were expressed at normal
levels, ruling out a defect of IL-15 receptor cell surface expression
(Supplementary Fig. 2a and b). We next investigated whether the
response of Shp-2-deficient NK cells to IL-15 was altered. At low
IL-15 concentration Shp-2-deficient NK cells presented a survival
advantage, as shown by the increased number of recovered cells
(Fig.
3
a) and the lower percentage of dying cells (propidium iodide
(PI)
+; Fig.
3
b). Conversely, high IL-15 concentration was
detri-mental to these cells, as observed both at 7 ng/ml, in the absence of
cell division, as well as at 50 ng/ml, in the presence of proliferation,
as shown by cell trace Violet (CTV) and PI staining (Fig.
3
a, b).
Notably, the defective expansion of NK cells was also observed in
response to high doses IL-2 (Fig.
3
c, d).
Spleen
b
NK cells (%) Spleen ** NK cells (%)a
NK1.1 CD3/CD19 * * ** Ncr1Tg Ptpn11fl/fl Ncr1Tg Ptpn11wt/fl 2.40 75.3 2.68 83.2 0 1 2 3 4 5 0 1 2 3 0 2 4 6 8 0 1 2 3 4 4.79 0 0 105 10 5 2.69 ** *** **** Cell subset (%) BMd
c
34.6 24 36.3 5.18 43.2 38.4 17 1.37 0 20 40 60 NS NS * 0.0 0.5 1.0 1.5 Cell subset (%) ** *** *** * NS * Spleen 0 20 40 60 80 100 0.0 0.5 1.0 1.5 2.0 2.5 5.94 30.5 62.2 1.44 3.44 21.8 72.6 2.16 Liverf
CD27 SP DP CD11b SP Cell subset (%) **** *** **** * NS **** 0 20 40 60 80 100 0.0 0.2 0.4 0.6 0.8 1.0 6.41 46.3 46.3 0.92 3.57 28.2 67.0 1.29 CD27 SP DP CD11b SPe
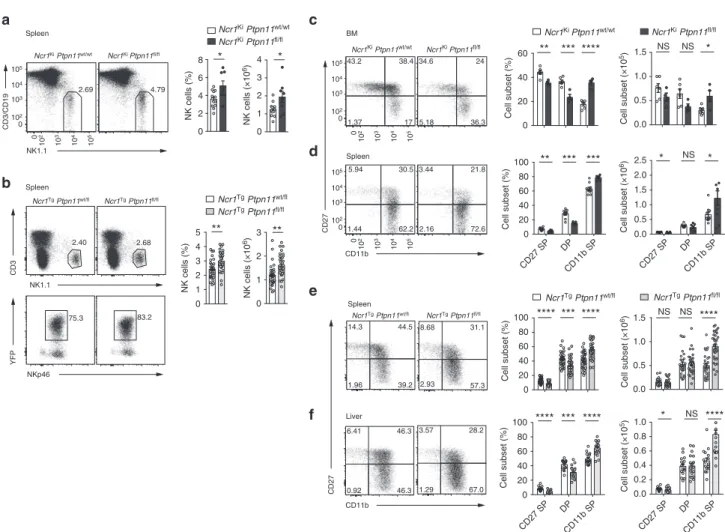
Cell subset (%) **** *** **** Spleen 0.0 0.5 1.0 1.5 0 20 40 60 80 100 NS NS **** 14.3 44.5 39.2 1.96 8.68 31.1 57.3 2.93 Ncr1Tg Ptpn11fl/fl NK1.1 CD3 NKp46 YFP CD11b CD27 CD27 SP DP CD11b SP CD27 SP DP CD11b SP CD11b CD27 NK cells (×10 6) 104 10 4 103 10 3 102 0 105 104 103 102 0 105 104 103 102 10 2 0 210 310 410 510 0 10 5 10 4 10 3 10 2 Ncr1Ki Ptpn11wt/wt Ncr1Ki Ptpn11fl/fl Ncr1Tg Ptpn11wt/fl Ncr1Tg Ptpn11fl/fl Ncr1Ki Ptpn11wt/wt Ncr1Ki Ptpn11fl/fl NK cells (×10 6) Ncr1Ki Ptpn11wt/wt Ncr1Ki Ptpn11fl/fl Ncr1Tg Ptpn11wt/fl Ncr1Tg Ptpn11fl/fl Ncr1Ki Ptpn11wt/wt Ncr1Ki Ptpn11fl/fl Cell subset (×10 5) Cell subset (×10 6) Ncr1Tg Ptpn11wt/fl Cell subset (×10 6) Cell subset (×10 5)Fig. 1 Loss of Shp-2 leads to increased mature NK cell numbers. a, b Representativeflow cytometric image, frequency, and number of splenic NK cells (gated as NK1.1+CD3/CD19−) of Ncr1KiPtpn11fl/fl(dark gray) and control mice (white) are depicted (a) or of splenic NK cells (gated as NK1.1+CD3−YFP +NKp46+) of Ncr1TgPtpn11fl/fl(light gray) or Ncr1TgPtpn11wt/fl(white) mice (b) are depicted. c, d Analysis of NK cells from Ncr1KiPtpn11fl/fland control
mice.c Representative cytometric plot of BM NK cells (gated as CD122+NK1.1+NKp46+CD3/CD19−) stained with CD27 and CD11b; percentage and number of CD27 single-positive (CD27 SP; CD27+CD11b−), double-positive (DP; CD27+CD11b+), and CD11b single-positive (CD11b SP; CD27−CD11b+) populations are shown.d Representative cytometric plot of splenic NK cells (gated as NK1.1+NKp46+CD3/CD19−) stained with CD27 and CD11b; percentage and number of the afore-mentioned subsets are shown.e As in (d), but for NK cells gated as NK1.1+CD3−YFP+NKp46+from Ncr1TgPtpn11fl/fl
or Ncr1TgPtpn11wt/flmice.f Frequency and number of CD27 SP, DP, and CD11b SP conventional NK cells (gated as CD45+NK1.1+CD3−YFP+NKp46+DX5 +CD49a−) from Ncr1TgPtpn11fl/fland control mice in the liver and a representative staining of CD27 and CD11b expression.a, b Results represent the
mean ± SEM of n= 8 (Ncr1KiPtpn11fl/fl) and n= 13 (Ncr1KiPtpn11wt/wt) (a), n= 29 (Ncr1TgPtpn11wt/fl) and n= 35 (Ncr1TgPtpn11fl/fl) (b) mice per genotype,
are a pool of three (a) and nine (b) experiments, which are representative of at leastfive (a) and eleven (b) independent experiments. c–f Results represent mean ± SEM of n= 4 (Ncr1KiPtpn11fl/fl) and n= 6 (Ncr1KiPtpn11wt/wt) (c), n= 7 (Ncr1KiPtpn11fl/fl) and n= 10 (Ncr1KiPtpn11wt/wt) (d), n= 29 (Ncr1Tg
Ptpn11wt/fl) and n= 35 (Ncr1TgPtpn11fl/fl) (e), and n= 16 (Ncr1TgPtpn11wt/fl) and n= 20 (Ncr1TgPtpn11fl/fl) (f) mice per genotype, are a pool of two (d), nine
(e, f) experiments and representative of at least three (c, d), and eleven (e, f) independent experiments. Statistical comparisons are shown; *p≤ 0.05, **p≤ 0.01, ***p ≤ 0.001, ****p ≤ 0.0001, NS, non-significant; Student’s t-test. Source data are provided as a Source Data file
The survival advantage at low IL-15 doses was consistent with
the accumulation of Shp-2-deficient NK cells observed under
physiological conditions in vivo (Fig.
1
). Given the important role
of the antiapoptotic protein B cell leukemia/lymphoma 2 (Bcl-2)
in sustaining survival of resting NK lymphocytes
29, we next
determined its expression level in knockout and control NK cells.
We found that Shp-2 deficient NK cells expressed higher Bcl-2
levels than control NK cells (Supplementary Fig. 2c).
Interest-ingly, while Bcl-2 expression decreased throughout maturation of
wild-type NK cells, it remained constant in Shp-2-deficient NK
lymphocytes, in agreement with the increased numbers of the
CD11b SP subset (Supplementary Fig. 2d). To validate these
findings, we assessed the effects of the Bcl-2 inhibitor ABT-199
on survival of co-cultured Shp-2-deficient and control NK cells.
Bcl-2 inhibitor treatment preferentially affected the survival of the
former, as shown by the decrease of the ratio of living
Shp-2-deficient over control NK cells (Fig.
3
e). Furthermore, inhibition
of myeloid cell leukemia sequence 1 (Mcl1), a second major
antiapoptotic protein, did not revert the survival advantage of
Shp-2-deficient cells (Supplementary Fig. 2e) at low IL-15
concentrations, underscoring the contribution of Bcl-2.
We next wondered whether the effects of Shp-2 deficiency in
presence of low and high IL-15 concentrations were recapitulated
by supplying the Shp-2 inhibitor SHP099 to wild-type NK cell
cultures
20. While SHP099 decreased NK cell expansion at high
15 doses, it did not increase their survival in the presence of low
IL-Positive NK cells (%)
CD94 Ly49A Ly49G2 Ly49I Ly49D Ly49H KRLG1
B2m–/– 0 20 40 60 80 0 20 40 60 80 0 20 40 60 0 20 40 60 80 0 20 40 60 80 ** **** NS NS NS NS NS*** ** **** NS**** * ** Granzyme B MFI Granzyme A MFI NS CD107 α Granzyme A Granzyme B PMA/Iono NS * PMA/Iono
RMA RMA-S RMA-H60
Killing (%) Effector:Target ratio Ncr1Ki Ptpn11fl/fl Ncr1Ki Ptpn11wt/wt 0.25 2.02 93.7 4.03 0.931 45.9 49.2 3.97 0.331 38.1 59.1 2.44 0 0 0.0715 0.937 96 3 1.08 0.0572 1.67 97.2 2.3 0.162 1.3 96.2 15 33.2 26.6 25.1 10.3 29.5 37.1 23.2 0 20 40 60 0 500 1000 1500 0 5000 10,000 15,000 20,000 Ncr1Ki Ptpn11fl/fl Ncr1Ki Ptpn11wt/wt Ncr1Ki Ptpn11fl/fl Ncr1Ki Ptpn11wt/wt 0 20 40 60 Ncr1Tg Ptpn11fl/fl Ncr1Tg Ptpn11wt/fl NS NS NS % Max m157 0 20 40 60 0 10 20 30 40 10:1 3:1 1:1 10:1 3:1 1:1 10:1 3:1 1:1 NS NS NS NS NS * NS ** NS 0 20 40 60 80 100 Ncr1Ki Ptpn11wt/wt Ncr1Ki Ptpn11fl/fl CD107 α + NK cells (%) 105 105 104 104 103 103 102 102 Ly49H + CD107 α + NK cells (%) – RMA RMA-m157
a
b
c
d
Fig. 2 Shp-2 is largely dispensable for NK cell effector functions. a Graphs depict percentages of CD94+, Ly49A+, Ly49G2+, Ly49I+, Ly49D+, Ly49H+, and KLRG1+splenic NK cells (gated as NK1.1+CD3/CD19−) from Ncr1KiPtpn11wt/wt(white), Ncr1KiPtpn11fl/fl(dark gray), and B2m−/−(green) mice.
b Graph and a representative cytometric plot illustrate the production of granzyme A and B by splenic NK cells (gated as NK1.1+NKp46+CD3/CD19−) after phorbol 12-myristate 13-acetate and ionomycin stimulation (PMA/Iono).c NK cells isolated from polyinosinic:polycytidylic acid (polyI:C)-treated Ncr1Ki
Ptpn11wt/wtor Ncr1KiPtpn11fl/flmice were plated with RMA, RMA-S, or RMA-H60 cells at the indicated ratios. The graph depicts percentage killing of target
cells, as measured by quantifying PI−living target cells.d Naive splenocytes from Ncr1TgPtpn11fl/fl(light gray) mice or heterozygote littermate controls
(white) were incubated with RMA cells or RMA-m157 cells (expression of m157 is illustrated in the graph on the left). Percentage of YFP+Ly49H+CD107α
+NK cells in each group was determined byflow cytometry (illustrated in the graph on the right). a, b Results represent the mean ± SEM of n = 4 (Ncr1Ki
Ptpn11fl/flor B2m−/−) and n= 6 (Ncr1KiPtpn11wt/wt) mice per genotype and are representative of at least three (a) and two (b) independent experiments.
c, d Results represent the mean ± SD of n= 3 (c), n = 4 (for non-stimulated conditions) and n = 5 (for RMA conditions) (d) technical replicates and are representative of at least two (c) and three (d) independent experiments. Statistical comparisons are shown; *p≤ 0.05, **p ≤ 0.01, ***p ≤ 0.001, ****p ≤ 0.0001, NS, non-significant; Student’s t-test. Source data are provided as a Source Data file
15 concentrations (Fig.
3
f). This suggests that the survival advantage
of Shp-2-knockout NK cells reflects an adapted state of these cells to
their defective condition in vivo, rather than a direct effect of Shp-2
activity, and we thus focused on the effects at high doses.
Shp-2 supports features linked to NK cell activation. Our
findings that the survival and expansion of Shp-2-deficient NK
cell were impaired at high IL-15 doses (Fig.
3
a, b) led us to
investigate whether the absence of Shp-2 affected NK cell
acti-vation by acute IL-15 exposure. Under these conditions, NK
lymphocytes acquire a blastoid morphology with increased
granularity. We thus examined the morphology of
Shp-2-deficient and control NK cells cultured in the presence of
var-ious IL-15 doses. Although the size and, in particular, the
0102103104105 0 50 100 150 200 250 – 0.1 ng/ml 50 ng/ml Cell number CTV 7 ng/ml 1 ng/ml 0.3 ng/ml Day 5 in vitro Ncr1Ki Ptpn11fl/fl Ncr1Ki Ptpn11wt/wt PI FSC-A Ncr1Ki Ptpn11fl/fl Ncr1Ki Ptpn11wt/wt Day 5 in vitro (IL-15) – 0.1 ng/ml 0.3 ng/ml 1 ng/ml 7 ng/ml 50 ng/ml (IL-15) IL-15 (ng/ml): Cell number CTV – 50 ng/ml (IL-2) 0 500 1000 1500 Day 4 in vitro Ncr1Ki Ptpn11fl/fl Ncr1Ki Ptpn11wt/wt PI FSC-A Day 4 in vitro – 50 ng/ml (IL-2) 90.7 8.91 0.0895 0.339 93.8 5.1 0.157 0.901 6.9 6.94 85.9 0.282 20.1 7.75 71.1 1.09 Living cells Dead cells % IL-2 (ng/ml): Living cells 50 ABT-199 inhibitor (20 nM) Living cells Ratio KO:WT Day 4 in vitro No treatment 1 7 0.3 0.1 IL-15 (ng/ml): Ratio KO:WT Ratio KO:WT Ratio KO:WT IL-2 (ng/ml): Dead cells % 50 Ratio KO:WT IL-15 (ng/ml): 1 50 7 0.3 0.1 Living NK cells (n°) Ncr1Ki Ptpn11fl/fl Ncr1Ki Ptpn11wt/wt 0 50K100K150K200K250K 92.9 1.85 0.168 5.07 94.4 2.53 0.19 2.89 83.3 1.71 10.4 4.64 92.5 2.96 2.58 1.92 81.8 1.98 10.4 5.74 71.2 1.63 19 8.17 68.1 1.35 26 4.55 72.5 2.42 22.1 2.94 61.3 2.64 32.6 3.41 44.3 3.72 49.8 2.23 62.2 14.5 22 1.38 36.6 10.9 51.5 0.987 0.1 ng/ml Living NK cells (n°) 50 ng/ml Day 4 in vitro *** ** *** (IL-15) 0 10,000 20,000 30,000 40,000 NS NS NS* 0 1000 2000 3000 4000 5000 Ncr1Ki Ptpn11fl/fl WT NK cells 0 1 2 3 4 0 0.5 1 1.5 2 0.0 0.5 1.0 1.5 0.0 0.5 1.0 1.5 2.0 2.5 * P = 0.0778 * * 0.0 0.5 1.0 1.5 2.0 2.5 105 104 103 102 0 0102103104105 105 104 103 102 0 0 50K100K150K200K250K SHP099 1 μ M – SHP099 0.5 μ M SHP099 0.25 μ M – – – SHP099 0.25 μ M SHP099 0.5 μ M SHP099 1 μ Ma
b
c
d
f
e
1 50 7 0.3 0.1Fig. 3 Ptpn11-deficient NK cells show a biphasic response to IL-15. a–d Enriched NK cells from Ncr1KiPtpn11wt/wt(blue; congenically marked) and Ncr1Ki
Ptpn11fl/fl(red) mice were co-cultured for 5 days in the presence of the indicated amounts of 15 (a, b) or were co-cultured for 4 days with 50 ng/ml of
IL-2 (c, d). a, c Histograms represent the amount and cell division (CTV dilution) of Shp-IL-2-deficient and control NK living cells in each condition (quantitative flow cytometry acquisition) and ratios thereof. b, d Representative flow cytometry plots show the percentage of dead cells (PI+) among knockout and
control NK cells and ratios thereof.e Enriched Shp-2-deficient and congenically marked control NK cells were co-cultured for 4 days in the presence of the indicated amounts of IL-15 and 0 (black triangles) or 20 nM ABT-199 (pink triangles). The graph depicts the ratio of living knockout over control NK cells.f Enriched NK cells from C57BL/6 wild-type mice (blue), or Shp-2-deficient NK cells from Ncr1KiPtpn11fl/flmice (red) as control, were cultured for 4 days in
the presence of 0.1 or 50 ng/ml IL-15 and 0, 0.25, 0.5, or 1μM SHP099. Graphs depict the number of living (PI−) NK cells. Results represent the mean ± SD of n= 3 (a, b) and n = 4 (c, d, f) replicates, or of n = 3 independent experiments (e; average of each condition/experiment). Results are representative of at leastfive (a, c), two (b, d), or three (e, f) independent experiments. Statistical comparisons are shown in (e), (f); NS, non-significant, *p ≤ 0.05, **p ≤ 0.01, ***p≤ 0.001; Student’s t-test unpaired (f) and Student’s t-test paired (e). Source data are provided as a Source Data file
granularity of Shp-2-deficient NK cells augmented in response to
IL-15 (Fig.
4
a), they increased significantly less than in wild-type
NK cells. This difference was mainly due to non-divided
Shp-2-deficient cells (Fig.
4
b), suggesting that cell division occurred after
reaching a given size and granularity. To better understand this
phenomenon, we assessed cell cycle entry and granularity when
cells are starting to divide. The proliferation marker Ki67 was
expressed in highly granular cells (Fig.
4
c). Furthermore, highly
granular, non-divided Shp-2-deficient NK cells were significantly
reduced as compared with the control counterparts (Fig.
4
c), but
not the proportion of Ki67
+NK cells among them (Fig.
4
d). This
indicates that, in Shp-2-deficient cells, the division defect in
response to IL-15 correlates with the granularity defect.
These results prompted us to analyze size and granularity of
Shp-2-deficient NK cells under physiological conditions in naive
animals. We found that NK cells from BM and spleen of Ncr1
KiPtpn11
fl/flmice were significantly affected in both parameters
(Supplementary Fig. 3a and Fig.
4
e), especially in the CD11b SP
NK cell stage (Supplementary Fig. 3b and Fig.
4
f). This phenotype
was also observed in splenic CD11b SP NK cells from the Ncr1
TgPtpn11
fl/flline (Supplementary Fig. 3c and d). Importantly, the
defect was cell-intrinsic as the decreased size and granularity was
conserved in Shp-2-deficient NK cells from mixed BM chimeric
mice (Supplementary Fig. 3e and f). Altogether, these results
suggest a role for Shp-2 in NK cell metabolism, alike what has
been established in a variety of non-immune tissues.
Shp-2 mediates metabolic rewiring in response to high IL-15.
Similar to other immune cells, metabolic activation was recently
revealed to be a critical event in NK cell activation, proliferation
as well as survival
30. The results described above led us to
0.1 0.3 IL-15 (ng/ml): 1 7 50 0.1 0.3 IL-15 (ng/ml): 1 7 50 FSC (% of control) SSC (% of control) Spleen 90 95 100 105 110 70 80 90 100 110 **** **** Ncr1KiPtpn11fl/fl Ncr1KiPtpn11wt/wt * * ** ** NS *** ** *** NS *** FSC (% of control) SSC (% of control) 90 100 110 120 130 50 100 150 200 250 % Max % Max Ncr1KiPtpn11fl/fl Ncr1KiPtpn11wt/wta
IL-15 50 ng/ml *** **** ** * 100K 150K 200K 250K 0 20 40 60 80 100 Non-divided Divided % Max FSC-A 0 20 40 60 80 100 SSC-A 85 90 95 100 105 110 FSC (% of control) 70 80 90 100 110 120 SSC (% of control) % Max Non-divided Divided Non div.Divided 0 50Kb
Non div.Divided 100K 150K 200K 250K 0 50K SSC-A Ki67 0 5 10 15 20 25 **** SSC high (%) 0 10 20 30 40 50 Ki67 + (%) among SSC high NS Day 2 IL-15 50 ng/ml Ncr1KiPtpn11fl/fl Ncr1KiPtpn11wt/wt Ncr1KiPtpn11fl/fl Ncr1KiPtpn11wt/wt Ncr1KiPtpn11fl/fl Ncr1KiPtpn11wt/wt Day 2 IL-15 50 ng/ml 8.89 17.1 105 104 103 102 0 100K 150K 200K 250K 0 50Kc
d
0 20 40 60 80 100 0 20 40 60 80 100 FSC SSC 100K 150K 200K 250K 0 50K 100K 150K 200K 250K 0 50Ke
FSC (% of control) SSC (% of control) Spleen 90 95 100 105 110 70 80 90 100 110 90 95 100 105 110 70 80 90 100 110 90 95 100 105 110 70 80 90 100 110 * **** **** ** *** **** CD27 SP DP CD11b SP Ncr1KiPtpn11fl/fl Ncr1KiPtpn11wt/wtf
Fig. 4 Shp-2-deficiency alters NK cell size and granularity. a, b Enriched NK cells from Ncr1KiPtpn11wt/wt(blue; congenically marked) and Ncr1KiPtpn11fl/fl
(red) mice were co-cultured for 5 days in the presence of the indicated amounts of IL-15.a Quantification of the geometric mean of forward scatter (FSC) and side scatter (SSC) of knockout and control NK cells (the average of the NK cells in culture with 0.1 ng/mL of IL-15 from Ncr1KiPtpn11wt/wtmice was set
as 100%).b Quantification and representative flow cytometry plots depicting the geometric mean of FSC and SSC of non-divided and divided NK cells (the average of the non-divided NK cells from Ncr1KiPtpn11wt/wtmice was set as 100%).c, d Enriched NK cells from Ncr1KiPtpn11wt/wt(white) and Ncr1Ki
Ptpn11fl/fl(dark gray) mice were co-cultured for 2 days in the presence of 50 ng/ml of IL-15. Representativeflow cytometry plots illustrating Ki67 and SSC
and a quantification of the percentage of SSChighcells (c) and of Ki67+among SSChigh(d) non-divided control and knockout NK cells (gated as NK1.1 +CD3/CD19−and cell trace violet (CTV) high).e, f Representative cytometric profile and quantification of FSC and SSC for total (e), CD27 SP, DP, and
CD11b SP NK cell populations (f) in the spleen (gated as NK1.1+NKp46+CD3/CD19−). For quantification, the average of Ncr1KiPtpn11wt/wtwas set as
100%. Results represent the mean ± SD of n= 3 (a, b) and n = 10 (c, d) technical replicates per genotype and are representative of at least two independent experiments (a, b) or are a pool of two independent experiments (c, d). Results represent the mean ± SEM of n= 10 (Ncr1KiPtpn11fl/fl) and n=
13 (Ncr1KiPtpn11wt/wt) mice (e, f) per genotype and are a pool of three independent experiments (e, f). Statistical comparisons are shown; *p≤ 0.05, **p ≤
hypothesize that the expression of Shp-2 might orchestrate
proper NK cell metabolic activity following exposure to IL-15. By
examining cellular metabolic activity with Seahorse technology,
we found that basal and maximal glycolytic rate of
Shp-2-deficient NK cells (as shown by extracellular acidification) were
reduced (Fig.
5
a). This suggested that Shp-2-deficient NK cells
failed to engage aerobic glycolysis to support their expansion. In
addition, Shp-2-deficient NK cells also displayed reduced basal
oxygen consumption and spare respiratory capacity as measured
by oxygen consumption rates (OCR) (Fig.
5
b), indicating that
they might lack the ability to adjust mitochondrial activity for
energy production in response to metabolic stress. Taken
toge-ther, these results demonstrate that Shp-2-deficient NK cells were
unable to properly raise both glycolytic and oxidative
phos-phorylation capacities in response to IL-15, which may contribute
to their phenotypic defects.
Shp-2 is a key mediator of IL-15-induced ERK activation. To
gain insight into the molecular mechanisms leading to the altered
IL-15 response of Shp-2-deficient NK cells, we investigated the
different known IL-15-dependent signaling pathways. These
include the engagement of Janus kinase (Jak)-Signal transducer
and activator of transcription (STAT) 5, mTOR, and extracellular
signal-regulated kinases (ERKs) (Fig.
6
a)
27,30–34. Whereas
Shp-2-deficient NK cells had nearly normal levels of STAT5
phosphor-ylation after 30 min of IL-15 stimulation, phosphorphosphor-ylation of S6, a
target of mTOR complex 1 (mTORC1)
30,33–36, was strongly
decreased while phosphorylation of ERK was abrogated (Fig.
6
b).
To ensure that the results were not biased by the different
composition of the NK cell maturation subsets, we assessed their
respective phosphorylation status of S6 and ERK by
flow
cyto-metry. We found that signaling defects were present in all NK cells,
irrespective of the maturation stage (Fig.
6
c). Similar signaling
defects were witnessed after 1 h of IL-15 stimulation, with the
exception of ERK, whose induction is too weak to be robustly
detected (Supplementary Fig. 4a). Importantly, Shp-2-deficient NK
cells exhibited lower basal levels of S6 and ERK phosphorylation,
indicating that Shp-2 constitutively contributed to these pathways,
likely downstream of endogenous IL-15 (Fig.
6
c).
In order to exclude indirect effects of Shp-2 deficiency, we
assessed phosphorylation of S6 and ERK following stimulation
with PMA/ionomycin, which bypasses receptor proximal
signal-ing. We observed normal engagement of these pathways in
Shp-2-deficient NK cells (Supplementary Fig. 4b). We next stimulated
wild-type NK cells with IL-15 in the presence or absence of the
Shp-2 inhibitor SHP099. In agreement with the genetic approach,
we observed a virtually normal engagement of the Jak-STAT5
pathway, but a severe defect in ERK and S6 phosphorylation
(Fig.
6
d). To corroborate the in vitro results, we assessed the
in vivo role of Shp-2 in response to stimulation with IL-15/IL-15R
complexes
37. One-day post-treatment, we evaluated IL-15
signaling in NK cells ex vivo. In agreement with the in vitro
studies, we found that control NK cells presented prominent
phosphorylation of ERK and S6, while their Shp-2-deleted
counterparts displayed a strong defect in these signaling pathways
(Fig.
6
e). Taken together, these results demonstrate that—
downstream of IL-15R—Shp-2 is required for ERK and,
presumably, mTORC1 engagement
30,33–36.
a
IL-15 50 ng/ml overnight 0 20 40 60 80 100 0 20 40 60 80 Time (min) ECAR (mpH/min ) 0 20 40 60 80 100 0 50 100 150 200 Time (min) OCR (pmol/min ) Ncr1Ki Ptpn11fl/fl Ncr1Ki Ptpn11wt/wt Ncr1Ki Ptpn11fl/fl Ncr1Ki Ptpn11wt/wtb
FCCP Oligomycin Antimycin A/ rotenone Antimycin A/ rotenone 2DG Oligomycin 2DG FCCP IL-15 50 ng/ml overnight****
OCR (pmol/min) SRC OCR (pmol/min)****
Basal OCR ECAR (mpH/min) Basal ECAR****
0 20 40 60 80 0 50 100 150 0 10 20 30 40Fig. 5 Ptpn11-deficient NK cells show a defective energetic response to IL-15. a, b Extracellular acidification rate (ECAR, a) and oxygen consumption rates (OCR,b) prior and after addition of the indicated mitochondrial inhibitors (oligomycin, trifluoromethoxy carbonylcyanide phenylhydrazone (FCCP), antimycin A, rotenone, and 2-deoxy-D-glucose (2DG) were measured for NK cells from Ncr1KiPtpn11wt/wt(blue) and Ncr1KiPtpn11fl/fl(red) mice cultured
overnight in the presence of IL-15 (50 ng/ml). SRC (spare respiratory capacity). Results represent the mean ± SD of n= 6 (Ncr1KiPtpn11wt/wt) and n= 9
(Ncr1KiPtpn11fl/fl) replicates per genotype and are representative of at least three independent experiments. Statistical comparisons are shown on bar
mTOR and ERK contribute to IL-15-driven NK cell expansion.
We next wondered whether the effect of Shp-2 on S6
phos-phorylation is mediated by ERK. ERK has been reported to
suppress the mTORC1 inhibitor tuberous sclerosis complex
(TSC), thereby activating the mTORC1 pathway, and can further
regulate S6 phosphorylation through 90 kDa ribosomal S6
kinase
38–40. We therefore assessed the effects of the
mitogen-activated protein kinase kinase (MKK/MEK) inhibitor PD98059
on S6 phosphorylation. PD98059 partially reduced S6
phos-phorylation induced by IL-15 exposure, while it had no effect on
STAT5 (Fig.
7
a). Importantly, in agreement with previous
find-ings
30, Torin2, an inhibitor of mTORC1 and mTORC2,
com-pletely prevented S6 phosphorylation (Fig.
7
a). We also assessed
the phosphorylation of Akt at position 308, which is regulated by
PI3K and contributes to Akt-mediated inactivation of the TSC
complex and the subsequent mTORC1 activation
41. Interestingly,
we found that Akt phosphorylation at position 308 was largely
dependent on Shp-2 after 30 min and 1 h of stimulation (Fig.
7
b
and Supplementary Fig. 5a). Altogether, these data suggest that
Shp-2 regulates PI3K-Akt and ERK engagement, which might
further contribute to mTORC1 and S6 activation (Supplementary
Fig. 5b).
To test whether defective ERK and mTORC1 signaling in
Shp-2-deficient cells account for the proliferation and the survival
defects observed in response to high IL-15 (Fig.
3
a, b and Fig.
4
c,
d), we cultured wild-type NK cells for 4 days in the presence of
PD98059 or Torin2. These inhibitors were supplied at low
concentrations in order to minimize aspecific effects. Reducing
the activity of ERK and, most prominently, mTOR led to
decreased proliferation and lower numbers of living NK cells
(Fig.
7
c). In addition, a reduction of NK cell size and granularity
was observed (Fig.
7
d). Taken together, these data support the
hypothesis that signaling by mTOR and ERK contribute to the
effects of Shp-2 in response to IL-15.
b
c
d
CD122 CD132 IL-15 JAK1 JAK3 ? ERK1/2 STAT5 mTORC1 S6a
Ncr1 Ki Ptpn11 wt/wt Ncr1 Ki Ptpn11 fl/fl Ncr1 Ki Ptpn11 wt/wt Ncr1 Ki Ptpn11 fl/fl IL-15 – p-STAT5 STAT5 p-S6 p-ERK1/2 S6 Actin IL-15 – – SHP099 – SHP099 100 100 25 35 35 35 25 35Wild type NK cells
100 100 35 35 25 35 35 25 kDa kDa MFI
e
IL-15 in vivo p-S6 p-ERK1/2 p-ERK1/2 p-S6 0 500 1000 1500 2000 CD27 SP DP CD11b SP 0 500 1000 1500 CD27 SP DP CD11b SP*** *** **** ****
**** ****
*
***
* ****
*
****
MFI Ncr1Ki Ptpn11fl/fl Ncr1Ki Ptpn11wt/wt IL-15 Ncr1Ki Ptpn11fl/fl IL-15 Ncr1Ki Ptpn11wt/wt MFI Ncr1Ki Ptpn11fl/fl Ncr1Ki Ptpn11wt/wt IL-15/IL-15R complexes Ncr1Ki Ptpn11fl/fl IL-15/IL-15R complexes Ncr1Ki Ptpn11wt/wt NS*
*
**
0 100 200 300 400 500 0 50 100 150 200 250 70 70 130 130 p-STAT5 STAT5 p-S6 p-ERK1/2 S6 Actin 70 70Fig. 6 Ptpn11-deficient NK cells have a curtailed response to 15. a Schematic representation of the main signaling pathways engaged downstream of IL-15R in NK cells.b, c Purified NK cells (b) or splenocytes (c) from Ncr1KiPtpn11wt/wtand Ncr1KiPtpn11fl/flmice were cultured in vitro for 30 min in the
presence of 50 ng/ml IL-15 (blue and red, respectively) or left untreated (white and dark gray, respectively). Phosphorylation of STAT5, ERK, and S6 were measured by immunoblot analysis (b) and byflow cytometry in CD27 SP, DP, and CD11b SP NK cell subsets (gated as NK1.1+and CD3/CD19−) (c). d Purified NK cells from C57BL/6 wild-type mice were cultured in vitro for 30 min in the presence of 50 ng/ml IL-15 or left untreated and in the presence of 4μM SHP099. Phosphorylation of the indicated proteins was measured by immunoblot analysis. Actin was used as loading control (b, d).
e Phosphorylation of ERK and S6 (expressed as geometric MFI) on splenic NK cells of untreated mice or of mice treated with IL-15/IL-15R complexes 1 day prior to the analysis are illustrated. Results represent the mean ± SEM of n= 5 (Ncr1KiPtpn11wt/wt) and n= 6 (Ncr1KiPtpn11fl/fl) (c), n= 6 (Ncr1KiPtpn11fl/fl)
and n= 7 or n = 8 (Ncr1KiPtpn11wt/wt) (e) mice per genotype and are a pool of two independent experiments (e) or representative of at least two
independent experiments (b–d). Statistical comparisons are shown (c, e); *p ≤ 0.05, **p ≤ 0.01, ***p ≤ 0.001, ****p ≤ 0.0001, NS, non-significant; Student’s t-test. Source data are provided as a Source Data file
Loss of Shp-2 affects MCMV-induced NK cell expansion. To
study the effects of endogenous IL-15 in vivo, we examined NK
cell homeostatic proliferation following adoptive transfer into
lymphopenic animals
42,43. CPD-labeled NK cells isolated from
Ncr1
TgPtpn11
fl/flwere mixed at a 1:1 ratio with congenically
marked B6.SJL NK cells and co-transferred into Rag2
−/−Il2Rg
−/−recipients. We found that wild-type NK cells divided significantly
more than Shp-2-deficient NK cells (Fig.
8
a), confirming an
essential role of Shp-2 in IL-15-driven proliferation in vivo.
However, despite their impaired division, Shp-2-deficient NK
cells were overrepresented (Fig.
8
b), consistent with their survival
advantage at low IL-15 doses (Fig.
3
) and increased numbers at
steady state in vivo (Fig.
1
).
To dissect Shp-2 contrasting roles in a more defined and
physiologically relevant infectious setting, we took advantage of
the well characterized MCMV model
44–46. In this model,
engagement of the activating receptor Ly49H by the MCMV
protein m157 leads to preferential expansion of Ly49H
+NK cells,
as Ly49H signaling amplifies the response to IL-15
(Supplemen-tary Fig. 6a)
44. We reasoned that the absence of Shp-2 may be
disadvantageous for the Ly49H
+NK cells, but might improve the
survival of Ly49H
−NK cells. To test this hypothesis, NK
cells isolated from Ncr1
TgPtpn11
fl/flwere mixed at a 1:1 ratio
with B6.SJL NK and transferred into NK cell-deficient mice
(Ncr1cre
KiROSA-DTA mice), which were simultaneously infected
with MCMV. Seven days post-infection, Shp-2-deficient and
control donor NK cells were found at the same ratio (Fig.
8
c).
However, wild-type NK cells were overrepresented in the Ly49H
+subset, while Shp-2-deficient NK cells in the Ly49H
−subset
(Fig.
8
d). These data illustrate the importance of Shp-2 in
calibrating IL-15-induced signaling to optimize a specific NK cell
response during viral infection.
Discussion
The effects of Shp-2 on NK cell development and functions have
not been defined. Using two different mouse lines conditionally
deficient for Shp-2 in the NK lineage, we found that NK cell
development appeared for the most part normal, with the
exception of an increased number of the most mature NK cells.
Unexpectedly, we also observed that NK cell effector functions
were not impaired in these animals. Shp-2 binding to
phos-phorylated ITIMs has been well documented, in particular in the
context of T-cell inhibitory receptors
21,22,47–49. However, its
in vivo function in both NK and T cells is less clear. In fact, we
recently reported that genetic deletion of Ptpn11 did not revert
MFI p-STAT5 p-S6 IL-15
****
*
NS p-AKT308 CD27 SP DP CD11b SP NS**
*
****
*
***
0 50 100 150 200 MFI Living NK cells (n°)**
****
****
****
50.2 49.8 51.6 48.4 0102 103 104 105 0 1000 2000 3000 4000 5000 20.1 79.9 – Cell number CTV 0 10,000 20,000 30,000 40,000 50,000****
***
0 200 400 600 0 200 400 600 800 IL-15***
****
**
Day 4 IL-15 50 ng/ml IL-15 WT NK cells 90 95 100 105 110 FSC (% of control) SSC (% of control) 110 80 90 100 120 PD98059 25 μM Torin2 5 nM Day 4 IL-15 50 ng/ml Torin2 PD98059 – Torin2 PD98059 – Torin2 PD98059 – IL-15 Ncr1Ki Ptpn11fl/fl IL-15 Ncr1Ki Ptpn11wt/wt Ncr1Ki Ptpn11fl/fl Ncr1Ki Ptpn11wt/wt IL-15 WT NK cells WT NK cells Torin2 PD98059 – – Torin2 PD98059 – –a
b
c
d
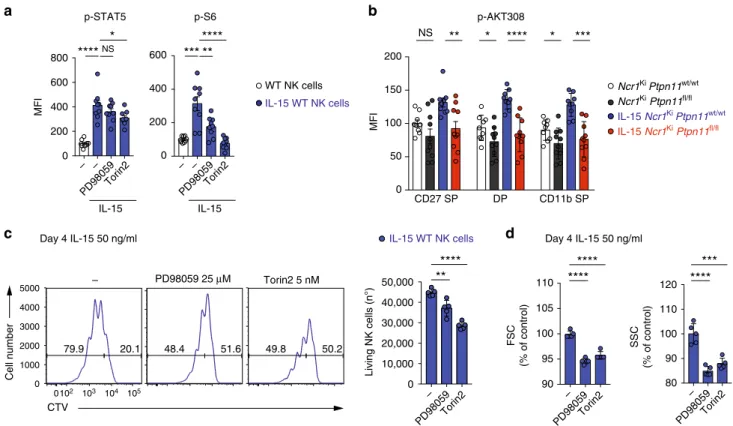
Fig. 7 mTOR and ERK inhibition phenocopy the expansion defect of Shp-2-deficient NK cells. a Splenocytes from C57BL/6 wild-type mice were cultured in vitro for 30 min in the presence of 50 ng/ml IL-15 (blue) and in the presence of 50µM PD98059 or 250 nM Torin2, or left untreated (white). Phosphorylation of the indicated proteins was measured byflow cytometry. b Splenocytes from Ncr1KiPtpn11wt/wtand Ncr1KiPtpn11fl/flmice were cultured
in vitro for 30 min in the presence of 50 ng/ml IL-15 (blue and red, respectively) or left untreated (white and dark gray, respectively). Phosphorylation of Akt (position 308) was measured byflow cytometry in CD27 SP, DP, and CD11b SP NK cell subsets (gated as NK1.1+and CD3/CD19−). For quantification, the average of the untreated NK cells from Ncr1KiPtpn11wt/wtmice was set as 100%.c, d NK cells from C57BL/6 wild-type mice were cultured in vitro with
50 ng/ml IL-15 for 4 days; PD98059 was added daily (day 0, 1, 2, and 3) at a concentration of 25μM, while Torin2 was added once (day 0) at a concentration of 5 nM.c Histograms represent the amount and cell division (CTV dilution) of living NK cells in each condition (quantitativeflow cytometry acquisition) and graph the number of living NK cells (gated as propidium iodide (PI)–NK1.1+CD3/CD19–) after 4 days of culture for each condition. d Graphs depict the geometric mean of FSC and SSC of non-divided NK cells across conditions (gated as PI–NK1.1+CD3/CD19−and cell trace violet (CTV) high). For quantification, the average of IL-15-expanded NK cells was set as 100%. Results represent the mean ± SEM of n = 9 (a), n = 9 (Ncr1KiPtpn11wt/ wt) and n= 10 mice (Ncr1KiPtpn11fl/fl) (b) and are a pool of two independent experiments (a, b). Results represent the mean ± SD of n= 5 technical
replicates and are representative of two independent experiments (c, d). Statistical comparisons are shown (a–d); *p ≤ 0.05, **p ≤ 0.01, ***p ≤ 0.001, ****p≤ 0.0001, NS, non-significant; Student’s t-test. Source data are provided as a Source Data file
the dysfunctional state of exhausted T cells
50. Altogether, these
data suggest that redundant mechanisms compensate for Shp-2
absence and that Shp-2 fulfills other functions in these cells.
The importance of Shp-2 in controlling the development of
several organs and tissues by relaying signaling from growth
factor receptors to MAPKs is well-established
12,17,51. In NK cells,
activation of this pathway, as well as metabolism and proliferation
are tightly regulated by selected cytokines, especially IL-15
27,30–33.
We therefore investigated whether Shp-2 regulated the NK cell
response to IL-15. Notably, we found that, in the absence of
Shp-2, IL-15-induced MAPK signaling was abolished. Our data
fur-ther suggest that Shp-2 is important for metabolic activation
through regulation of the PI3K-Akt-mTORC1 axis, although the
relevance of the Akt-mTORC1 connection in NK cells remains to
be clarified
35,41, or indirectly through its effects on ERK.
Over a decade ago, recruitment of Shp-2 to the IL-15 receptor
was shown in response to IL-2 and IL-15 in both T and NK cells
and a positive role for Shp-2 in ERK activation was observed
downstream of IL-2 receptor in
fibroblasts
52–55, supporting our
data on the importance of Shp-2 downstream of the 15 and
IL-2 receptors. However, Shp-IL-2 deficiency does not phenocopy the
NK cell defects observed in IL-15- and PI3K-deficient mice or in
mice conditionally deficient for mTORC1 and mTORC2 in the
NK lineage
30,34,43,56. In these mouse models, NK cells present
severe developmental, maturation, and numerical defects, while
Shp-2 deficiency leads to rather increased numbers of the most
mature NK cells. Regarding the mechanism, we have unveiled
that Shp-2 uncouples the Jak-STAT5 from the ERK pathway and
future investigations are required to more precisely define the
intersection of Shp-2 with the totality of the signaling cascades
induced by IL-15.
It has been recently reported that constitutive metabolic
over-activation is detrimental for NK cell development and survival
in vivo
57,58. NK cells lacking Tsc1 exhibited an overactive
phe-notype and underwent apoptosis
57. In addition, NK cells deficient
for the transcription factor Rfx7 presented an increased
metabo-lism and were preferentially lost at physiological/limiting cytokine
concentrations, while had a survival advantage at high IL-15
doses
58. These
findings mirror the results described here, showing
that the lowered metabolic state of Shp-2-deficient NK cell helps
their maintenance and accumulation both in vivo and at low IL-15
concentrations in vitro, while is unfavorable at high IL-15 doses. In
line with these results, NK cell responses to low IL-15 doses are
dominated by the Jak-STAT5 pathway, which is nearly normal in
the absence of Shp-2
30. Similarly to NK cells deficient for
3-phosphoinositide-dependent kinase 1 (PDK1), an upstream
acti-vator of mTORC1, Shp-2-deficient NK cells express higher levels
of Bcl-2, which supports their survival
29,41,59. This antiapoptotic
protein was particularly abundant in the CD11b SP subset, strongly
correlating with their accumulation. However, the increased
sur-vival at limiting IL-15 doses was not recapitulated by in vitro
treatment of wild-type NK cells with the Shp-2 inhibitor. This
discrepancy could be explained by broader effects of the inhibitor
or suggest that this phenotype reflects an adaptation occurring
during development in vivo, a point that might be relevant with
respect to long-term treatment with Shp-2 inhibitors.
Not surprisingly, given the impaired signaling pathways, Shp-2
deletion affected the metabolic reprogramming of NK cells, which
MCMV infection day 7 0 20 40 60 80 100 NK cells (%) 0 20 40 60 80 100 NS
****
Mode CPD Ncr1Tg Ptpn11fl/fl B6 control****
0 20 40 60 80 Ly49H + NK cells (%) Ly49H – NK cells (%) B6 control 0 20 40 60 80 Ncr1Tg Ptpn11fl/fl NK cells (%)****
***
0 20 40 60 80 NK cells (%)****
MCMV infection day 7 B6 control Ncr1Tg Ptpn11fl/fl B6 control Ncr1Tg Ptpn11fl/fl B6 control Transfer into Rag2–/–Il2rg–/– recipient miceDivisions 1–3Divisions 4–7
Ncr1Tg Ptpn11fl/fl
a
b
c
d
Fig. 8 Shp-2 mediates NK cell activation in response to IL-15 in vivo. a, b CPD-labeled splenic YFP+NK cells from Ncr1TgPtpn11fl/fl(CD45.2+; light gray line
and bars) mice were sorted and injected at a 1:1 ratio with sorted splenic NK cells from B6.SJL (CD45.1+; black line and white bars) congenic mice into recipient Rag2−/−Il2Rg−/−mice. Percentage of cells in divisions 1–3 or 4–7 (a) and relative proportion of total NK cells were determined at day 4
post-transfer (b). c, d Splenic YFP+NK cells from Ncr1TgPtpn11fl/flROSAEYFP(CD45.2+) mice were sorted and injected at a 1:1 ratio with sorted splenic NK cells
from B6.SJL (CD45.1+) congenic mice into MCMV infected NK cell-deficient mice (Ncr1creKiROSA-DTA). Frequencies of total NK cells (c), and of Ly49H+ and Ly49H−NK cells (d) were determined at day 7 post-infection. Results represent mean ± SEM of n= 3 mice (a, b) or of n = 13 mice (c, d), and are representative of three independent experiments (a, b) or a pool of three independent experiments (c, d). Statistical comparisons are shown; ***p≤ 0.001, ****p≤ 0.0001, NS, non-significant; Student’s t-test. Source data are provided as a Source Data file
presented lower glycolysis, oxidative phosphorylation, as well as
spared respiratory capacity following IL-15 exposure. As a
con-sequence, Shp-2 deficient NK cells failed to increase their cellular
mass and granularity and did not divide at high IL-15 doses.
Importantly, this expansion defect was recapitulated upon IL-2
stimulation and during MCMV infection in Ly49H
+NK cells,
which have augmented sensitivity to IL-15
44.
Altogether, our data demonstrate that Shp-2 is critical in the
context of acute IL-15 stimulation and in the presence of an
activating co-stimulus in vivo. We therefore propose that Shp-2
main function in NK cells is not to calibrate the threshold of NK
cell reactivity but instead to mediate IL-15 signaling, actively
favoring specific NK cell responses. A growing number of clinical
studies aim to harness NK cell anti-tumor immunity, while
selective Shp-2 inhibitors have been developed for treatment of
cancers relying on this pathway
60. Based on our data, we argue
that therapeutic approaches combining Shp-2 inhibition with NK
cell stimulating regimens should be reevaluated and possibly
avoided. The use of this inhibitor might instead be beneficial in
the management of the aggressive large granular lymphocyte
leukemia, which has been proposed to depend on IL-15
61–63.
Methods
Mice. NK cell-specific knockout mice for Ptpn11 were generated by crossing either the Ptpn11fl/flmice15to the Ncr1creKideleter strain23or the Ptpn11fl/flmice24to the
Ncr1creTgmice64, generating Ncr1KiPtpn11fl/fland Ncr1TgPtpn11fl/fl, respectively. Ncr1creTgPtpn11fl/flmice were crossed to R26R-EFYP mice to monitor cre activity. For genotyping Ncr1KiPtpn11fl/flmice, Ptpn11-floxed alleles were detected by PCR amplification using a set of two primers that amplify a 300 bp wt band and a 380 bpfloxed band (forward primer 5′-ATGACTCCTGAAGCCCATTG-3′ and reverse primer 5′-TTCCCATCACCTCAGACTCC-3′). For genotyping Ncr1Tg Ptpn11fl/flmice, Ptpn11-floxed alleles were detected by PCR amplification using a set of two primers that amplify a 312 bp wt band and a 430 bpfloxed band (forward primer 5′-TAGCTGCTTTAACCCTCTGTGT-3′; reverse primer 5′-CATCAGA GCAGGCCATATTCC-3′).
Ptpn11fl/fl15, Ncr1creKi, B6.SJL,β2m−/−, and C57BL/6 mice, all on a C57BL/6 (H2b) background, were bred under specific pathogen-free conditions at the animal facility of the University of Lausanne. Sex- and age-matched 6–14-week-old mice were used for the experiments. All animal experimental protocols were approved by the Veterinary office regulations of the State of Vaud, Switzerland, and all methods were performed in accordance with the Swiss guidelines and regulations.
C57BL/6, B6.SJL (B6.SJL-Ptprca Pepcb/BoyJ), R26R-EFYP (B6.129×1 Gt(ROSA) 26Sortm1(EYFP)Cos/J), and ROSA-DTA (B6.129P2-Gt(ROSA)26Sortm1(DTA)Lky/J) mice were purchased from The Jackson Laboratory (Bar Harbor, ME). Rag2−/− Il-2Rg−/−(B10;B6-Rag2tm1FwaIl2rgtm1Wjl) mice were purchased from Taconic Biosciences (Germantown, NY). Ptpn11fl/fl24, Ncr1creTg25and the above-mentioned mice were bred in pathogen-free facilities at Brown University. For MCMV experiments, the ROSA-DTA mice were crossed to Ncr1creKimice to generate Ncr1creKiROSA-DTA recipient mice, which are deficient in NK cells. Sex-and age-matched 6–12-week-old mice were used for the experiments. The studies performed at Brown University were carried out in strict accordance with the recommendations in the Guide for the Care and Use of Laboratory Animals, as defined by the National Institutes of Health (PHS Assurance #A3284-01). Animal protocols were reviewed and approved by the Institutional Animal Care and Use Committee (IACUC) of Brown University. All animals were housed in a centralized and AAALAC-accredited research animal facility that is fully staffed with trained husbandry, technical, and veterinary personnel.
Mixed bone marrow chimeras. Donor BM cells were obtained from sex-matched control mice (CD45.1/2) and Ncr1KiPtpn11fl/flmice (CD45.2) byflushing femurs and tibias and mixed in a 1:1 ratio. A total of 5 × 10⁶BM cells were injected intravenously into recipient mice (CD45.1), which had been previously lethally irradiated with 900 rad. The recipients were allowed to reconstitute for at least 6 weeks. Frequency of CD45.2 and CD45.1/2 NK cells was determined byflow cytometry.
Murine lymphocytes isolation. For what concerns Ncr1KiPtpn11fl/fldata: sple-nocytes were obtained by mechanical disruption of the spleen and bone marrow cells were obtained byflushing femurs. Red blood cells were lysed.
For what concerns Ncr1TgPtpn11fl/fldata: mice were sacrificed with isoflurane. Cardiac puncture was performed prior to organ removal. Spleens were processed with a GentleMACS Dissociator,filtered through nylon mesh, and layered onto a Lympholyte-M gradient (Cedarlane Laboratories Ltd., Canada). Lymphocytes were harvested from the gradient interface. Livers were perfused before removal, processed in PBS with 1% serum with the GentleMACS, andfiltered through nylon
mesh. Samples were washed three times and suspended in 40% Percoll and layered on 70% Percoll. Lymphocytes were harvested from the gradient interface and washed once.
NK cell preparation and culture. For in vitro NK cell experiments, congenically marked splenic NK cells from either control or Ncr1KiPtpn11fl/flmice were isolated using the EasySep mouse NK cell isolation kit (Stemcell Technologies Cat. No. 19855) according to the manufacturer’s recommendations. NK cell enrichment was confirmed by flow cytometry. NK cells were then grown in RPMI 1640 (Life technologies/Cat number 61870010) supplemented with 10% FCS, 100 U/ml penicillin, 100 µg/ml streptomycin, 1 mM sodium pyruvate, 50 µM 2-mercaptoethanol (all from Life technologies), and 10 mM HEPES buffer (Bio-concept) and incubated at 37 °C in 5% CO2with recombinant mouse IL-15
PeproTech/Cat number 210-15) or IL-2 (PeproTech/Cat number 212-12) for 4 or 5 days in the presence or not of Bcl-2 inhibitor (ABT-199 from BioVision), Mcl-1 inhibitor (S63845 from Selleckchem), Shp-2 inhibitor (SHP099 from Selleckchem), the MEK (MAP kinase kinase) inhibitor (PD 98059 from Adipogen), or the mTORC1 inhibitor (Torin2 from Selleckchem) as indicated.
Cell labeling and in vitro proliferation analysis. Labeling of cells with 5 µM cell trace violet (CTV from Life Technologies) was performed in PBS 1% FCS at 37 °C for 20 min. In order to analyze proliferation, cell divisions were traced by dye dilution at theflow cytometer.
In vitro killing assay. RMA, RMA-S, and RMA-H6026cell lines were maintained
in RPMI 1640 (Life technologies/Cat number 61870010) supplemented with 10% fetal calf serum (FCS, from PAA), 100 U/ml penicillin, 100 µg/ml streptomycin, 50 µM 2-mercaptoethanol (all from Life Technologies) at 37 °C with 5% CO2.
For NK cells: control and Ncr1KiPtpn11fl/flrecipient mice were pre-treated with 150 µg of polyinosinic:polycytidylic acid (polyI:C) (InvivoGen) by intraperitoneal injection 1 day before the experiment. Splenocytes were collected after mechanical disruption of the spleen and enriched for NK cells (Stemcell Technologies, Cat. No. 19855). In total, 1 × 10⁴CTV-labeled target cells (RMA, RMA-S, or RMA-H60) were then co-cultured with NK cells in NK cell medium in a 96-well plate for 4 h in the incubator at 37 °C at the following ratios 10:1, 3:1, or 1:1 NK cells per target. Analysis of the cells was then performed byflow cytometry. RMAs rejection is shown as percentage of killing.
NK cell degranulation assay. To generate the RMA-m157 transfectants, the retroviral vector pMX encoding MCMV157 ORF was kindly provided by Dr. Heusel (Washington University). RMA target cells were retrovirally transduced and M157 cell surface expression monitored using the anti-M157 mAb Clone 6H1.2.1 (Kindly provided by Dr. Yokoyama Washington University). High expressors for M157 were cell sorted.
For the stimulation with RMA-m157, splenocytes (1 × 10⁶/well) from Ncr1Tg Ptpn11fl/flmice or heterozygote littermate controls were incubated for 6 h with 1 × 10⁵RMA cells or RMA-m157 cells in the presence of Golgi-STOP solution and anti-CD107α antibody. Following incubation, cells were stained with anti-CD3, NK1.1, anti-Ly49H, and NKp46 antibody. Percentage of YFP+Ly49H+CD107α+ NK cells in each group was determined byflow cytometry.
Seahorse analysis. NK cells were enriched from control and Ncr1KiPtpn11fl/fl mice and stimulated overnight with recombinant mouse IL-15 (50 ng/mL Pepro-Tech) at 37 °C. The following day, 2.5 × 10⁵enriched NK cells were seeded in a Seahorse Bioscience culture plate in DMEM (Sigma) with 10 mM glucose (Sigma), 2 mM glutamine (Life Technology) in a non-CO2incubator for at least 30 min.
Basal OCR and ECAR were then measured by an XF96 Seahorse Extracellular Flux Analyzer following the manufacturer’s instruction. Basal OCR and ECAR were calculated as the mean of thefirst three time points (basal) for each replicate in Ncr1Ki Ptpn11wt/wtand Ncr1Ki Ptpn11fl/flmice. For the calculation of the SRC, the mean of basal OCR was subtracted to the mean of the three time points at maximal OCR for each replicate in Ncr1Ki Ptpn11wt/wtand Ncr1Ki Ptpn11fl/flmice. NK cell activation in vitro and in vivo. For cytokine stimulation in vitro, sple-nocytes or enriched NK cells from control and Ncr1KiPtpn11fl/flmice were left unstimulated or stimulated with recombinant mouse IL-15 (50 ng/mL PeproTech) for 30 min or 1 h at 37 °C and analyzed for intracellular protein phosphorylation by flow cytometry or immunoblot analysis. In some experiments as indicated, NK cells were treated for 30 min with the Shp-2 inhibitor (SHP099 from Selleckchem), the MEK (MAP kinase kinase) inhibitor (PD 98059 from Adipogen), or the mTORC1 inhibitor (Torin2 from Selleckchem) prior to IL-15 stimulation. NK cells were then analyzed byflow cytometry or immunoblot analysis, as described in the specific sections.
For PMA/ionomycin stimulation in vitro, splenocytes from control and Ncr1Ki Ptpn11fl/flmice were left unstimulated or stimulated either 15 min with 12.5 nM PMA plus 0.125 µg/ml ionomycin or 2 h with 50 nM PMA plus 0.5 µg/ml ionomycin followed by 2 h with Brefeldin A (10 µg/mL Enzo Life Science) for the detection byflow cytometry of intracellular protein phosphorylation and cytokine