HAL Id: dumas-03141412
https://dumas.ccsd.cnrs.fr/dumas-03141412
Submitted on 15 Feb 2021
HAL is a multi-disciplinary open access
archive for the deposit and dissemination of sci-entific research documents, whether they are pub-lished or not. The documents may come from teaching and research institutions in France or abroad, or from public or private research centers.
L’archive ouverte pluridisciplinaire HAL, est destinée au dépôt et à la diffusion de documents scientifiques de niveau recherche, publiés ou non, émanant des établissements d’enseignement et de recherche français ou étrangers, des laboratoires publics ou privés.
Is post-stroke depression associated to brain imaging
parameters?
Marie-Adeline Siegerth
To cite this version:
Marie-Adeline Siegerth. Is post-stroke depression associated to brain imaging parameters?. Human health and pathology. 2020. �dumas-03141412�
AVERTISSEMENT
Ce document est le fruit d'un long travail approuvé par le
jury de soutenance.
La propriété intellectuelle du document reste entièrement
celle du ou des auteurs. Les utilisateurs doivent respecter le
droit d’auteur selon la législation en vigueur, et sont soumis
aux règles habituelles du bon usage, comme pour les
publications sur papier : respect des travaux originaux,
citation, interdiction du pillage intellectuel, etc.
Il est mis à disposition de toute personne intéressée par
l’intermédiaire de
l’archive ouverte DUMAS
(Dépôt
Universitaire de Mémoires Après Soutenance).
Si vous désirez contacter son ou ses auteurs, nous vous
invitons à consulter la page de DUMAS présentant le
document. Si l’auteur l’a autorisé, son adresse mail
apparaîtra lorsque vous cliquerez sur le bouton « Détails »
(à droite du nom).
Dans le cas contraire, vous pouvez consulter en ligne les
annuaires de l’ordre des médecins, des pharmaciens et des
sages-femmes.
Contact à la Bibliothèque universitaire de Médecine
Pharmacie de Grenoble :
UNIVERSITÉ GRENOBLE ALPES UFR DE MÉDECINE DE GRENOBLE
Année : 2020
IS POST-STROKE DEPRESSION ASSOCIATED TO BRAIN IMAGING
PARAMETERS?
LA DEPRESSION POST AVC EST-ELLE ASSOCIEE A DES
PARAMETRES D’IMAGERIE CEREBRALE?
THÈSE
PRÉSENTÉE POUR L'OBTENTION DU TITRE DE DOCTEUR EN MÉDECINE DIPLÔME D’ÉTAT
Marie-Adeline SIEGERTH
THÈSE SOUTENUE PUBLIQUEMENT A LA FACULTÉ DE MÉDECINE DE GRENOBLE
Le : 7 Septembre 2020
DEVANT LE JURY COMPOSE DE :
Président du jury et Directeur de thèse : Pr Dominic PERENNOU
Membres : Pr Olivier DETANTE, Dr Monica BACIU, Pr Alexandre KRAINIK, Pr Mircea POLOSAN
L'UFR de Médecine de Grenoble n'entend donner aucune approbation ni improbation aux opinions émises dans les thèses : ces opinions sont considérées comme propres à leurs auteurs.
6 Remerciements...8 Résumé...9 Abstract... 11 INTRODUCTION...13 THEORICAL PART... 15 1. Post-stroke depression (PSD)...16
2. Aphasic Depression Rating Scale (ADRS)...16
3. White matter hyperintensities (WMH)...17
3.1 Physiopathology...17 3.2 Fazekas scale... 17 3.3 Clinical consequences...18 EXPERIMENTAL PART... 20 METHODS... 21 1. Study design...21 2. Ethical consideration...21 3. Participants...22 4. Clinical data... 23 4.1 Depression assessment...23
4.2 Other clinical assessment...23
5. Brain imaging...24
5.1 Acquisition... 24
5.2 White matter hyperintensities (WMH)... 24
5.3 Brain imaging reconstruction... 24
6. Stroke volume... 25
7.1 Behavioral analysis... 25
7.2 Descriptive method: overlap mapping and substraction mapping... 26
7.3 Voxel-based lesion symptom mapping (VLSM)... 27
8. Classical statistical analyses...27
RESULTS... 28
1. Demographical and clinical features of participants...28
2. Influence of the WMH on PSD...28
3. Influence of the stroke volume on PSD... 29
4. Influence of the stroke location on PSD... 29
4.1 Behavior analysis...29
4.2 Overlap mapping, substraction mapping and VLSM analysis...29
DISCUSSION... 30
1. PSD and WMH... 30
2. PSD and stroke location/volume...31
3. Limitations... 32
4. Reactional or organic PSD...32
CONCLUSION...34
References...41
Appendix...45
8
Remerciements
Au Pr Perennou pour m'avoir proposé ce travail de thèse, votre accompagnement tout au long de mon internat, votre disponibilité et votre pédagogie.
Aux Pr Detante, Dr Baciu, Pr Polosan et Pr Krainik d'avoir accepté de participer à la lecture et à la soutenance de ce travail en tant que membres du jury.
A Louis, pour ta collaboration durant la réalisation de ce travail.
A Céline, pour ton investissement, ta rigueur, ta pédagogie et ta patience. A Julien, pour ta pédagogie, ta patience et ta gentillesse.
A Margo, Héléna et Camille pour votre aide précieuse qui a contribué à l'aboutissement de cette thèse. A Françoise, pour votre bienveillance, générosité, humanité, esprit d'équipe et pédagogie.
A l'ensemble des médecins qui ont contribué à ma formation au cours de l'internat.
Aux professionnels paramédicaux et rééducateurs avec qui j'ai pu travailler dans la joie et la bonne humeur auprès des patients.
A mes parents, pour votre amour et votre soutien sans relâche durant ce long parcours d'étude. Vous m'avez permis de réaliser un métier passionnant et qui me tenait à cœur d'exercer. Vous m’avez transmis de belles valeurs humaines qui fondent le médecin que je suis devenue.
A mon frère, François, ton soutien, ton écoute et tes précieux conseils dès la première année et à chaque année passée m'ont aidé à garder confiance et motivation.
A ma grand-mère et Josette pour votre amour et pour avoir toujours été fières de moi.
A Val, Charlène, Marine, Céline, Émeraude et Lara pour tous les bons moments partagés ensemble, votre soutien, votre amitié fidèle et bienveillante depuis nos rencontres respectives à différents moments de mon parcours. A Anaïs pour tout l'amour que tu me portes et le bonheur de partager la vie avec toi. Pour la force, la bienveillance et le précieux soutien que tu m'apportes au quotidien.
Résumé
Introduction: la dépression est une complication fréquente après un accident vasculaire
cérébral (AVC). Cette complication a un impact négatif sur la rééducation et la récupération fonctionnelle. Plusieurs études comportementales suggèrent que la dépression post-AVC pourrait être un phénomène réactionnel. Cette interprétation laisse penser qu’il n’existe pas de lien entre la dépression post-AVC et une ou plusieurs aires cérébrales spécifiques. Ce point reste débattu et il n’a encore jamais été investigué par des techniques modernes d’analyse statistique basées sur l’imagerie cérébrale et réalisé sur une cohorte conséquente incluant un grand nombre de participants afin d’exclure un résultat faussement négatif. C’est l’objectif de notre étude.
Méthode: il s’agit d’une étude annexe issue de la cohorte DOBRAS (Determinants of Balance
Recovery After Stroke), dans laquelle les participants sont régulièrement et systématiquement évalués à 30 (± 3) (J30) et 60 (± 3) (J60) jours après l’AVC. La dépression était évaluée par l’ Aphasic Depression Rating Scale (ADRS), un outil spécifique pour la dépression post-AVC, en présence ou non d’une aphasie (scores entre 0 et 32, seuil diagnostic à partir de 11 inclus). L’imagerie cérébrale a été réalisée grâce à l’Imagerie par Résonance Magnétique (IRM) à environ deux mois de l’AVC (Nagaraja et al., 2020). Nous avons recherché le lien entre la dépression post-AVC et trois paramètres d’imagerie: les structures altérées par l’AVC (Voxel-based Lesion Symptom Mapping (VLSM)), le volume de l’AVC (nombre de voxels) et les hypersignaux de substance blanche (selon la classification de Fazekas).
Résultats: au total 126 patients ont été analysés. Leur age médian était de 65.9 [58.1-72.4] ans.
Dans notre population il existait une prédominance masculine (n=85 (67%)). Les patients ont étaient principalement évalués pour la dépression à J30 (n=70, 55%). Parmi eux 53 (42%) étaient dépressifs. L’ADRS médiane était de 10 [6-15]. La dépression et sa sévérité étaient
10 associées à l’existence d’hypersignaux de substance blanche (p=0.011), mais pas au volume de l’AVC (p=0.619) ni à une structure cérébrale spécifique.
Conclusion: la dépression post-AVC doit être particulièrement détectée en cas
d’hypersignaux de substance blanche à l’IRM. L’absence d’aire cérébrale spécifique en lien avec la dépression post-AVC plaide en faveur de l’hypothèse réactionnelle.
Mots clés: AVC, dépression, ADRS, imagerie cérébrale, hypersignaux de substance blanche,
Abstract
Background and purpose: the depression is a common complication after stroke, which has a
negative impact on the rehabilitation and the recovery. Some behavioral findings suggest that post-stroke depression (PSD) could be a reactional phenomena, an interpretation that would predict no relationship with a specific brain area. This point, which remains debated, has never been investigated by modern technics of brain imaging analyses on a cohort including an adequate number of individuals to exclude false negative results. This was the objective of the present study.
Methods: it is an ancillary study from the DOBRAS (Determinants of Balance Recovery
After Stroke) cohort, in which participants were regularly and systematically assessed on 30 (± 3) (D30) and 60 (± 3) (D60) days after stroke. The depression was assessed by the Aphasic Depression Rating Scale (ADRS) a specific tool quantifying PSD, regardless aphasia (scores from 0 to 32, cut off egal or over 11). Brain imaging were analyzed on Magnetic Resonance Imaging (MRI) around 2 months after stroke (Nagaraja et al., 2020). We sought the relationship between PSD and three brain imaging parameters: structures affected by the stroke (Voxel-based Lesion Symptom Mapping (VLSM)), stroke volume (number of voxels) and white matter hyperintensities (WMH) (assessed by the Fazekas scale).
Results: a total of 126 individuals were analyzed. Their median age was 65.9[58.1-72.4] years and 85 (67%) males. They had been mostly assessed on D30 (n=70, 55%). Among them 53 (42%) were depressive. The median ADRS score was 10 [6-15]. Depression and its severity were associated to the existence of WMH (p=0.011), but not with stroke volume (p=0.619), not any specific areas.
12 brain structure related advocates for the reactional hypothesis of PSD.
Key words: stroke, depression, Aphasic Depression Rating Scale (ADRS), brain imaging,
White Matter Hyperintensities (WMH), Voxel-based Lesion Symptom Mapping (VLSM), stroke volume
INTRODUCTION
Depression is a common complication after stroke. It has been shown that its prevalence varies between 20 % and 65 % (Hackett et al., 2005). The functional and cognitive impairment, the dependance and disability level are associated to the post-stroke depression (PSD) (Ayerbe et al., 2013). In addition, the depression also results in a negative impact on the rehabilitation and the functional recovery. This behavioral findings suggest that PSD could be a reactional phenomena. However, a previous study demonstrated that stroke patients were significantly more depressed than equally impaired orthopaedic patients, suggesting that a vascular phenomenon may be involved in depression (Folstein et al., 1977). Several studies have gone further in the study of the link between depression and brain injury. Indeed, many of them have been interested in the relationship between the brain injury location and depression. First of all, an old study demonstrated that a group of patients with left hemispheric stroke were significantly more depressed than a group with traumatic injury to the left hemisphere, with the ischemic lesions tending to be more anteriorly situated than the traumatic lesions (Robinson et al., 1981). Recently, several studies (Vataja et al., 2001, Murakami et al., 2013, Yang et al., 2015, Levada et al., 2018) have found that patients with left hemispheric and limbic strokes were more depressive. However, Robinson et al. demonstrated that patients with anterior right damages also presented PSD, although milder than for left stroke (Robinson et al., 1983). In addition, other authors analysed the relationship between depression and lesions more specifically affecting the white matter, in particular the white matter hyperintensities (WMH) and the microbleeds. Liang et al. demonstrated that microvascular lesions were post stroke depression predictors after three months (Liang et al., 2017). Bae et al. demonstrated that the periventricular WMH were associated with an earlier depression whereas the depression was more severe and later when the hyperintensities were
14 deep (Bae et al., 2019). The periventricular white matter hyperintensities (PWMH) were associated to a chronic depression evolution and a less therapeutic efficiency (Diegez et al. 2004). Moreover, Tang et al. wrote several papers and demonstrated that the lobar microbleeds were predictors of a less depression symptoms remission and the suicide was more frequent when the patients had frontal and thalamic microbleeds (Tang et al., 2010-2014).
The literature which studies the link between vascular lesions and depression is broad, the methodologies are variable because depression is assessed with various scales, the brain imaging and the statistics also vary and lead to divergent conclusions. Then PSD physiopathology is still unclear and the PSD neural bases stay a mystery. From now on the resort to the magnetic resonance imaging (MRI) in stroke and the statistical analysis is more successful to study neural bases of PSD. One of them is the voxel-based lesion symptom mapping (VLSM), which use the MRI, generating data as good as from functional MRI (Bates et al., 2003) and only few studies use VLSM to study PSD (Abe et al., 2010). In addition, aphasic patients are often excluded, resulting in a possible bias.
In this study, we hypothesize that PSD has an organic and not only reactional origin. Using VLSM analysis in a cohort of subjects including aphasics, we investigate the relationship between brain imaging parameters and the PSD emergence 2 months after stroke.
16
1. Post-stroke depression (PSD)
PSD is a frequent complication after stroke. That is an important topic at the subacute phase due to its negative impact on the recovery and on the rehabilitation. About risk factors, the methodology varies according to studies, that is probably responsible for major differences in risk factors for PSD reported in the literature. The most frequently cited risk factors for PSD are sex (female), history of depression, stroke severity, functional impairment or level of handicap, level of independence, family and social support (De Ryck et al., 2014). We suppose that PSD is a reactional mood disorder particularly due to the functional and cognitive impairment (Ayerbe et al., 2013) and the dependance (living in a nursing home (Burvill et al., 1997)) though the physiopathology still not clear.
Indeed, several studies have gone further in the study of the link between PSD and brain injury. Many of them have been interested in the relationship between the brain injury location and depression (Robinson et al., 1981, Robinson et al., 1983, Vataja et al., 2001, Murakami et al., 2013, Yang et al., 2015, Levada et al., 2018). Other studies have found a relationship between WMH, microbleeds and PSD (Liang et al., 2017 ; Bae et al., 2019). The methodologies are variable because PSD is assessed with various scales, aphasics individuals are often exluded, the brain imaging and the statistics to analyze the relationship between stroke location and PSD are variable.
In our study, we have included aphasic individuals and we have evaluated them with the Aphasic Depression Rating Scale (ADRS). We have analyzed the relationship between three brain imaging parameters (stroke volume, stroke location, WMH) and PSD.
2. Aphasic Depression Rating Scale (ADRS)
ADRS was developed to detect and measure depression in aphasic patients during the subacute stage of stroke (Bénaïm et al., 2004). The items of ADRS are filled-in during the
rehabilitation staff and with the pluridisciplinary team. This scale is particularly appropriate for the rehabilitation stage. ADRS evaluate the somatic symptoms (including insomnia, loss of appetite, constipation, fatigability) of the depression, Bénaïm et al. demonstrated that the presence of these symptoms is often associated with depression and that ADRS displays a good sensitivity and a good specificity (Bénaïm et al., 2004). We have chosen this scale to assess the PSD in our study because we have included aphasic individuals whereas previous studies often excluded them and also because we have studied the PSD at 2 months after stroke, so on subacute stage.
ADRS is presented onAppendix.
3. White matter hyperintensities (WMH)
3.1 Physiopathology
WMH are types of subcortical brain damages due to small vessel disease (Pantoni et al., 2010). The WMH physiopathology is incompletely known. Abnormalities of vessels structures are described (a loss of smooth muscular wall, a lumen reduction and a vessel wall thickening) and cause a blood flow reduction and a loss of vascular brain auto regulation. These dysfunctions lead to a chronic and a subclinical ischemia which cause a loss of white matter (demyelination, hyperintensities on T2-weighted MRI).
3.2 Fazekas scale
Fazekas scale (Fazekas et al., 1987) is the most used in clinical practice and research to quantify white matter lesions on MRI, on T2 FLAIR (Fluid Attenuated Inversion Recovery). According to their locations (deep white matter (DWM), periventricular white matter (PVWM)) and their extension, the WMH are graded as follow: grade 0 (absent), grade 1 (caps or pencil-thin lining in PVWM, punctate foci in DWM), grade 2 (smooth halo in PVWM,
18 beginnig confluence in DWM), grade 3 (irregular PVWM extending into the deep white matter, large confluent areas in DWM). We used it in our study but simplifying the score regardless the location of WMH .
3.3 Clinical consequences
On LADIS (leukoaraiosis and disability) study, older adults who seek medical attention for non-disabling complaints, severe age related changes in white matter independently and strongly predict rapid global functional decline (Inzitari et al., 2009). Beyond the presence of WMHs which has an impact on functional capabilities, Moon et al. demonstrated that a speed progression of WMH is associated with gait and walk declin among older adults (Moon et al., 2018). We could think that the recovery after stroke is influence by the WMH and we suppose that the functional capacities after rehabilitation are less great when the individuals have a severe leukoaraiosis. About this hypothesis, a meta-analysis (Georgakis et al., 2019) concluded that the presence and severity of WMH are associated with [...] functional impairment, stroke recurrence, and mortality after ischemic stroke. Sagnier et al. demonstrated that the mesure of the white matter integrity early after an ischemic stroke is an important factor to predict the functional outcome (Rankin Scale Modified) and may be additional markers to include in studies evaluating post-stroke recovery (Sagnier et al., 2020). White matter lesions might reduce brain plasticity and cognitive reserve (Galluzzi et al., 2008). Concerning the PSD and WMH, Tang et al. demonstrated that, in comparison with the non-PSD group, patients in the PSD group had severe deep WMH (Tang et al., 2010). Severe deep WMH remained an independent predictor of PSD.WMH increase with the age just as stroke. Also, we could considere WMH is a predictor and a confunding factor of PSD. In our study, we considered WMH of 2 ways. At first, we have analyzed the relationship between the ADRS score and WMH. In a second time, we have performed lesional analyses which had
as objective to research if there are specific brain areas associated with PSD. Because, WMH still a confunding factor of PSD and we have decided that the individuals with severe WMH (Fazekas 3) were excluded of lesional analyses. Indeed, we avoided the confusion bias in analyses of the relationship between stroke location and PSD.
20
EXPERIMENTAL PART
METHODS
1. Study design
This work was a monocentric observational ancillary study using the data of the DOBRAS cohort (ClinicalTrial.gov NCT03203109). In DOBRAS cohort, the participants were comprehensively assessed in routine care, initially in the first weeks after the admission in the rehabilitation ward of Grenoble-Alpes University hospital. The participants were regularly and systematically assessed at 30 (± 3) (D30) and 60 (± 3) (D60) days after stroke. The DOBRAS-depression study was focused on the occurrence of PSD, assessed with the ADRS (Bénaïm et al., 2004) before D60 and with an evaluation of the behavioral factors and anatomical features. In our study, there were two types of approach concerning anatomical features: on the one hand, on the totality of individuals included in the study, we analyzed the link between PSD and WMH, between PSD and the basic stroke caracteristics (side, vascular location, stroke volume) through the brain damages evaluated on the MRI controlled at the subacute stage. On the other hand, we excluded the severe WMH, because this is a confunding factor of PSD. We analyzed the lesional data with a substraction mapping and a VLSM analysis to study the link between PSD and a specific brain area.
2. Ethical consideration
The DOBRAS study was performed with Helsinki declaration and was registered at the National Committee for Informatics and Freedom (Commission nationale informatique et liberté; CNIL No. 2014874 v1) which is the French equivalent of the information Commisionner's Office in the United Kingdom. According to French law, observational studies do not require approval by an ethics committee, provided participants have been
22 informed of the specific research and are not opposed. All possible participants were informed about the study verbally and by writing. Participants who refused to share their clinical data for research purposes fulfilled an opposition paper.
3. Participants
From January 2012 to September 2018, 208 consecutives individuals were included in the DOBRAS data base. Inclusion criteria for DOBRAS were : adults between 18 and 80 years ; with a first unilateral hemispheric stroke (no cerebellar or brainstem's stroke) which was confirmed by MRI or CT-scan. Exclusion criteria for DOBRAS were : previous stroke ; others neurological diseases (peripherical neurologic diseases, movement disorder diseases, neuromuscular diseases, vestibular diseases); cognitive or psychological disorders prior to stroke ; unstable medical conditions.
For the present study, supplementary specific eligibility criteria were applied. We included individuals with an ADRS score assessed before D60 and a MRI performed at subacute stage (around 2 months). Two months after the stroke is the interval being recommended to avoid overestimating stroke volume and to better analyze brain structures encroached by the stroke (Nagaraja et al., 2020). We excluded the individuals with early (first week) MRI controls because the perilesional oedema distorts the stroke boundaries. Individuals with late (> 4 months) MRI controls were also excluded because the brain imaging had no mapping with the ADRS score made before D60. Also excluded, individuals with bilateral or multiple strokes or severe subarachnoid hemorrhage detected after a careful reading of MRI and brain hernia in acute phase of stroke.
Previous studies demonstrated the link between the PSD and the white matter hyperintensities (WMH) (Bae et al., 2019 ; Dieguez et al., 2004). We could considere WMH is a predictor and a confunding factor of PSD, so to avoid a confusion bias in the lesional analysis, we have
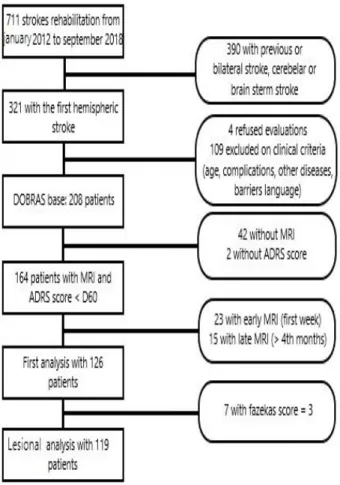
excluded the individuals with a severe WMH (Fazekas grade 3). The flowchart of study is represented infigure 1.
The anatomo-clinical correlation and particularly VLSM method did not provide a theoretical number of participants. However, it seemed reasonable to include more than 30 patients by referring to relevant scientific literature (Karnath et al., 2019).
4. Clinical data
4.1 Depression assessment
The depression was assessed by ADRS which is a specific scale for PSD assessment, in individuals with or without aphasia, at the subacute stage after stroke (Bénaim et al., 2004 ; 2010). As recommended, the ADRS questionnaire was filled-in by a trained psychologist during a multidisciplinary staff of our neurorehabilitation ward, with the help of the whole team. The ADRS scores range from 0 to 32 (Bénaïm et al., 2004). The depression was diagnosed for ADRS scores over 11 to get a 62 % sensitivity and 81 % specificity. In clinical routine, the depression was assessed on D30 and/or on D60. For this study, we kept the worst ADRS score as primary outcome. We have constituated two groups: depressive and non-depressive individuals.
4.2 Other clinical assessment
The disability was assessed by the Functional Independance Measure (FIM) (Granger et al., 1986).
24
5. Brain imaging
5.1 Acquisition
MRI was performed with 1,5 Tesla machine, either Magnetom Vision plus (Siemens, Erhlangen, Germany) or Achieva (Philips, Amsterdam, The Netherlands). A T1-weighted high-resolution, a T2-weighted and a fluid attenuated inversion recovery (FLAIR) were acquired.
5.2 White matter hyperintensities (WMH)
WMH of the hemisphere spared by the stroke was graded with the Fazekas scale (Fazekas et
al., 1987) on T2-FLAIR sequences, by a radiologist. Fazekas 0 (no WMH), Fazekas 1 (light
WMH), Fazekas 2 (moderate WMH), Fazekas 3 (severe WMH).
In our study, we considered WMH of 2 ways. At first, we analyzed the relationship between the ADRS score and WMH, for that we definied 2 groups: no/light WMH and moderate/severe WMH . In a second time, we performed lesional analyses which had as objective to research if there were specific brain areas associated with PSD. Because, severe WMH could include a confusion bias, we decided that the individuals with severe WMH (Fazekas 3) were excluded of lesional analyses.
5.3 Brain imaging reconstruction
The lesions were reconstructed by using MRIcron (Rorden & Brett, 2000) from MRI axial slices (axial AC-PC, T2 FLAIR, 4-mm thickness). The lesions were drawn manually by a first operator on axial slices of a T1-weighted MRI template from the Montreal Neurological Institute (www.bic.mni.mcgill.ca/cgi/icbm_view) normalized to Talairach’s space and controlled by a second operator. Both operators were blinded to clinical measurements and
study hypothesis. The disagreements were resolved by consensus. Individual brain lesions were superimposed by using MRIcron (http://www.mccauslandcenter.sc.edu/mricro/mricron). We did not use an automatic segmentation and a normalisation algorithms because the manual reconstruction is more reliable than these techniques (Kimberg et al., 2007) for analysis on patients with advanced age. Indeed, with aging the cerebral architecture is frequently modified (mostly ventricular dilatation or cerebral atrophy) (Rorden et al., 2007). In our behavioral data in function of the proportion of right and left lesions in depressive and non-depressive individuals(table 1)the right lesions were flipped so that the left hemisphere is the damaged one and the right non damaged. This method allows to increase the statistical power. This step allowed us to obtain the stroke volumes and their locations in order to analyze the relationship between the stroke volume, the stroke location and PSD.
6. Stroke volume
Nys et al. demonstrated that the severity of depressive symptoms was related to the stroke volume (Nys et al., 2005). So, we analyzed the relationship between the stroke volume which was defined in voxels during the brain imaging reconstruction and PSD. The stroke volume was determined as the amount of hemisphere encroached on by the lesion (number of voxels for the lesion /number of voxels for the hemisphere) (Karnath et al., 2004).
7. Stroke location
7.1 Behavioral analysis
The stroke location has often been studied in its link with the PSD. In our study, we performed several analyses about stroke location. First, a behavioral analysis of the stroke location. The location could be classified of many ways (Levada et al., 2018), we have chosen a classification according to the vascular territories (Vataja et al., 2001). For each individual,
26 we defined 3 stroke location groups: superficial, deep and global. According to the vascular territories, when the lesion damaged the cortical area and the white matter out of the internal capsule the stroke was considered as superficial. When the lesion damaged the internal capsule or the basal ganglia the stroke was considered as deep. Finally when it was superficial and deep, we called it a global stroke. That is a vascular classification including several neural structures without a precious analysis of the location. That’s why we will use two complementary methods using brain imaging reconstruction. First, a descriptive method with the substraction mapping (frequency mapping). Second, a statistical method using VLSM analysis to study the link between the cerebral damage and PSD.
7.2 Descriptive method: overlap mapping and substraction
mapping
First, we presented a description of our population with mappings of all stroke reconstructed in MRIcron, which called an overlapping. This overlapping represented for each voxel, the number of patients who had an injury in that voxel. We performed an overlapping of all individuals, depressive and non depressive individuals. The substraction of the overlapping of depressive and non depressive call the frequency mapping (substraction mapping). The frequency mapping allowed to see if the cerebral areas were differents between the depressive and non depressive individuals. Then, we performed a Chi2 test to analyze statistically this comparaison and know if there were specific brain area associated with the PSD. Nevertheless, it seemed interesting and more precise to do an analysis without a previous depression or location classification, so we performed a least statistical method using VLSM analysis (Karnath et al., 2004).
7.3 Voxel-based lesion symptom mapping (VLSM)
We performed, a statistical method using VLSM. VLSM analyzed the relationship between cerebral damage and behavior represented by a continous variable (ADRS score) on voxel by voxel basis, as in functional neuroimaging (Bates et al., 2003). It was a lesional analysis based on a voxelwise approach with an independent test (non-parametric mapping (NPM) in a toolbox) computed for every voxel of the whole brain (Bates et al., 2003). To avoid an increase of the error risk (p value) due to the analyses repeating, we performed a Bonferroni correction.
VLSM allowed a great spatial resolution and was adapted when there was not a strong a priori prediction regarding the spatial location of the cerebral injury (Rorden et al., 2007).
8. Classical statistical analyses
The continuous data are presented as median with the interquartile range [Q1-Q3], the dichotomized and categorical data as number (%). The continuous data were compared between two groups by Mann-Whitney U-test, the proportions were compared by chi-square or Fisher exact test. The effect sizes were calculated by using the Z values of the Mann-Whitney test, r=Z/√n and the X2 of the chi-square or Fisher exact test, v=√(X²/n*df). The
effect size (r or v) of 0.1, 0.3, and 0.5 represent a small, medium, and large effect, respectively. The correlations were calculated by using the Kruskall-Wallis. A p value < 0.05 was considered as statistically significant. The statistical analysis involved using SPSS 21.0. First, we studied demographical and clinical features of the participants. Then, we studied the influence of the WMH, the lesion size and the location on the PSD.
28
RESULTS
1. Demographical and clinical features of participants
A total of 126 individuals had an ADRS before D60 after the stroke and a MRI at the 67thday
(+/- 19 days) post-stroke. Their demographical and clinical features are presented in table 1. Their median age was 65.9 [58.1-72.4] years, with a male predominance (n=85, 67%). Concerning the characteristics of the stroke, there were more frequently an infarct (n=102, 81 %) in the left side (n=73, 58%).
Median ADRS score was 10 [6-15]. There were 53 (42%) depressive individuals and 73 (58%) non-depressive individuals (table 1). They had been mostly assessed on D30 (n=70, 55%). The depressive individuals differed from others by a worse functional independance(table 1). Our clinical data showed that the proportion of right and left lesions were comparable in depressive and non-depressive individuals (table 1). Moreover, we had compared the size of the lesion in right and left stroke and there was no significant difference (p=0.239). To increase statistical power, the right lesions were flipped on the left hemisphere.
2. Influence of the WMH on PSD
Among the 126 individuals, 25 (20 %) had no WMH (Fazekas grade 0), 56 (44 %) a light WMH (Fazekas grade 1), 38 (30 %) a moderate WMH (Fazekas grade 2), and 7 (6 %) a severe WMH (Fazekas grade 3) (figure 2). Due to the small number of individuals with a Fazekas grade 3, two groups were constituted as follows : no/light WMH (n=81 ; 64%) and moderate/ severe WMH (n=45, 36%). The group moderate/severe WMH had higher ADRS scores than the group none/light WMH (12 [8-17] vs 9 [6-14] ; p=0.011, r=0.23)(figure 3). The WMH were associated with the PSD and its severity.
3. Influence of the stroke volume on PSD
The stroke volume was comparable between the depressive and the non-depressive individuals (19994 [4279-48997] voxels vs 17934 [3412-39464] voxels ; p=0.619). This meant that the stroke volume was not associated with PSD.
4. Influence of the stroke location on PSD
4.1 Behavior analysis
ADRS scores were similar for superficial (n=48, 9 [6-15]), deep (n=45, 10 [6-16], and global (n=33, 10 [8-15]) strokes (z=1.692 ; p= 0.429). The lesion location was not associated with the PSD in this primary analysis.
4.2 Overlap mapping, substraction mapping and VLSM analysis
Figure 4 represents the overlap strokes mapping of the 119 individuals. The stroke damages were located on all arterial territories. The lesions were more frequently found in middle cerebral artery territory and deep structures which are often perfused by posterior cerebral artery. The prefrontal regions were more preserved in depressive group (figure 5A). Lesions were observed mainly in the internal and external capsule, the insula and in the basal ganglia in the depressive and non depressive individuals (figure 5 A, B). In both groups, occipital regions were relatively preserved (figure 5 A, B).
The mapping substraction (figure 5 C) between the depressive and the non-depressive individuals allowed us to obtain regions of interest (ROI) which were different between the depressive and the non depressive individuals. In the red area, the post arm of the internal capsule, the thalamus, the putamen and the corona radiata were more frequently injured in the depressive individuals whereas in the blue area, the caudate nucleus was more frequently
30 injured in the non-depressive individuals (figure 5 C). The Chi2 test was not significant. Then, the statistical analysis of the brain imaging using the VLSM analysis was not significant. There was not cerebral area associated with the ADRS score. According to the results of different steps to study the relationship between the stroke location and PSD, we could conclude there was not specific brain area associated with the PSD.
DISCUSSION
1. PSD and WMH
Our study showed a significant link between the presence of WMH and PSD. This conclusion is consistent with the more in-depth work of Bae et al. who had demonstrated in a population studied at 15 days and one year post-stroke that WMH periventricular were associated with early PSD while deep WMH was associated with PSD late and severe (Bae et al., 2019). From a pathophysiological point of view, Dieguez et al. evoked moreover the hypothesis of the vascular mechanism in the onset of PSD: the presence of both periventricular and deep WMH are associated with PSD with less remission more progression to chronicity and a poorer response to treatment (Dieguez et al., 2004). WMH are part of a subcategory of microvascular injury caused by cardiovascular risk factors. Among the other types of lesions microvascular that we can observe, we also describe the microbleeds. About that, Tang et al. has demonstrated in several publications the link between microbleeds and post-stroke depression: the presence of lobar microbleeds was associated with less of remission of depression over a period evaluating individuals at 3 and 15 months after stroke. Suicide was also more common in individuals with frontal lobar microbleeds whether early (7%) or late (14%) after stroke (Tang et al., 2010-2014). It would therefore appear that lesions of
microvascular origin (WHM and microbleeds) play an important role in the severity of depression, its course and therapeutic response. Prevention of microangiopathy is based on simple principles of controlling cardiovascular risk factors, in particular especially high blood pressure.
2. PSD and stroke location/volume
Furthermore, although we might have expected a link between the location and/or stroke volume with PSD, our study did not show a significant association concerning these two hypotheses. Indeed, one would have expected that the lesions large or in areas with high functional potential such as the internal capsule provide PSD due to the functional impairment engendered, such as walking which affects autonomy. Conversely, a right lesion more prone to anosognosia could suggest a protective factor of the PSD. A few articles in the literature also conclude that there is no link between location and PSD, Nys et al. have not shown a significant link between location of the recent stroke or a lacunar stroke and the occurrence of PSD (Nys et al., 2005). In the systematic review carried out by Carson et al., the location of the lesion was also not retained as a risk factor involved in PSD (Carson et al., 2000). We can however emphasize that our study has included a large series of patients compared to previous studies which were limited to a smaller sample individuals (Levada et al., 2018).
To date, our study is one of the only studies of the literature on neural bases hemispherical PSD performed in VLSM analysis and on a significant series of aphasic patients.
Our results suggest that the neural basis of depression may not be so simple to demonstrate because they probably pass through cortical and subcortical networks which would join. Liao
et al. who showed that depression chronic and severe disease in non-stroke patients was
associated with abnormal white matter in right frontal lobe, right fusiform gyrus, left frontal gyrus and the right occipital lobe. In this article, the role of the corpus callosum, the gyrus
32 right fusiform and inferior longitudinal fasciculus suggesting that any disconnection within the white matter of these systems could be at the origin of a depression (Liao et al., 2013). The VLSM analysis may not have been able to identify these networks, but methods such as diffusion tensor imaging would allow us to study more precisely the hypothesis of fronto subcortical dysconnection.
3. Limitations
Concerning the depression assessment, we have used the ADRS which is a scale with a good reliability. However, we might have been able to perfect assessment of mood with a complementary scale-type self-assessment scale face so that it remains usable in our aphasic individuals. Before ADRS, the Visual Analog Mood Scales (VAMS) (Arruda et al., 1999) was the depression scale for aphasic individuals. The association of ADRS and VAMS could then be very useful for assessing mood disorders in aphasic patients (Bénaïm et al., 2004). Concerning behavioral data, we have not assessed the anosognosia while it could be a factor impacting PSD because patients with anosognosia have not conscience of their difficulties and their dependance and we could think they are protected of PSD.
Concerning Fazekas scale, we have simplified the score and we have not considered independantly PWMH et DWMH whereas others studies had do that to study more precisely the relationship between WMH and PSD (Dieguez et al. 2004 ; Bae et al. 2019). Moreover, there were not enough individuals in our severe WMH (Fazekas 3) group to demonstrate a correlation between WMH severity and PSD.
4. Reactional or organic PSD
We can also think that the reactional part in connection with the loss autonomy (loss of walking, balance disorder, cognitive decline), disability, impaired quality of life play a role in
the onset of PSD. It is advisable to remain attentive to the clinical and iconographic risk factors (WMH and microbleeds), in order to identify subjects at risk of PSD to take them into load early and efficiently and thus limit symptoms and consequences that this complication causes.
Our study demonstrated a significant link between WMH and PSD. On the other hand, we did not demonstrate the link between stroke volume, stroke location and PSD. The introduction and re-evaluation of anti-depressant treatments are essential, the association of supportive psychotherapy with anti-depressants is clearly indicated for patients who accept it. By limiting the negative symptoms of depression, we can expect better patient participation during their rehabilitation phase and thus lead to a more complete recovery with a more satisfactory quality of life less inclined to promote depressive symptoms.
34
CONCLUSION
This is the largest series in which were sought the relationships between depression and brain imaging parameters such as structures altered by the stroke (voxel-based lesion symptom mapping,VLSM), stroke volume (number of voxels), and white matter hyperintensities (WMH) assessed with the Fazekas scale. A total of 126 individuals were analyzed. Their median age was 65.9 [58.1-72.4] years, with a male predominance (n=85, 67%). They had been mostly assessed on D30 (n=70, 55 %). The depression was assessed by the Aphasic Depression Rating Scale (ADRS), a specific tool quantifying post-stroke depression (PSD), regardless aphasia (score ranging from 0 to 30, depression ≥ 11). Among them 53 (42%) were depressive and the median ADRS score was 10 [6-15]. Brain imaging were analyzed on MRI performed around 2 months after the stroke, using modern brain imaging analyses technics. PSD and its severity was only associated to the existence of a WMH, not with stroke volume or any specific brain areas. We conclude that PSD must be particularly detected in case of WHM. The absence of specific brain structure related advocates for the reactional hypothesis of PSD.
36 Table 1. General and clinical features
All (n = 126) Depressive (n = 53) Non depressive (n = 73)
p value (size effect)
Age (years) 65.9 [58.1-72.4] 65.6 [57.4-69.4] 66.5 [58.5-72.8] 0.477 Male (%) 85 (68) 33 (62) 52 (71) 0.608 Left lesion (%) 73 (58) 29 (55) 44 (60) 0.533 Ischemic stroke (%) 102 (81) 44 (83) 58 (80) 0.615 ADRS score 10 [6-15] 16 [14-18] 7 [5-9] < 0.001 (r = 0.85) FIM 105 [78-117] 98 [67-113] 110 [87-119] 0.013 (r = - 0.22)
ADRS score: Aphasic Depression Rating Scale score ; FIM: Funtional Independance Measure Age, ADRS score, FIM are represented by median [first quartile Q1 - third quartile Q3]. Sex, lesion side and lesional mechanism are represented by the number and the proportion (%). Statistical significant is p value < 0.05
Figure 2. Proportion of individuals on a total of 126 individuals according to their Fazekas scores
Max: maximum ; Min: Minimum ; Q1: first quartile 1 ; Q3: third quartile ; ADRS: Aphasic Depression Rating Scale ; WMH: White Matter Hyperintensities
* p = 0.011
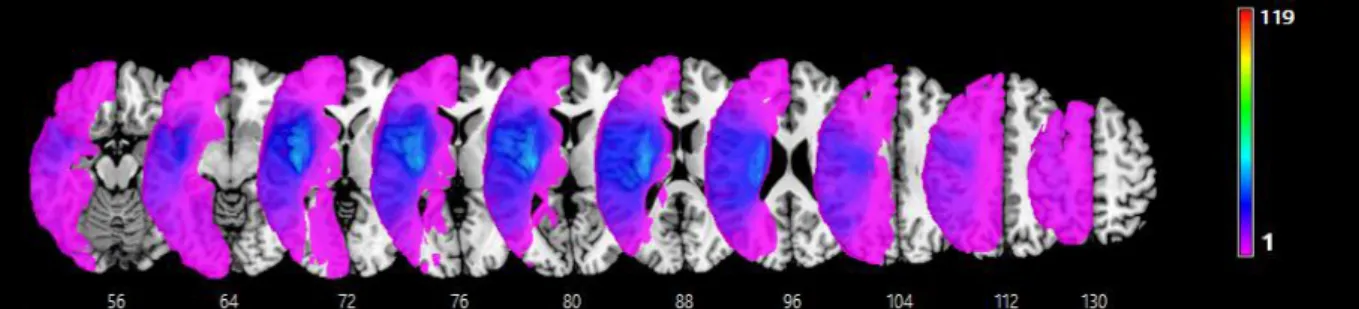
38 Figure 4 : Overlay lesion plots of the 119 stroke individuals. The number of overlapping lesions is illustrated by different colors coding increasing frequency from violet (n=1) to red (n=119 stroke individuals; n=47, depressive individuals; n=72 non depressive individuals). Talairach z-coordinates (Talairach and Tournoux, 1988) of each transverse section are given.
Figure 5. (A) overlay lesion plots of 47 stroke individuals with depression and (B) 72 stroke individuals without depression. The number of overlapping lesions is illustrated by different colors coding increasing frequency from violet (n=1) to red (n=47, depressive individuals; n=72 non depressive individuals). Talairach z-coordinates (Talairach and Tournoux, 1988) of each transverse section are given.
(C) Overlay plot of the substracted superimposed lesions of the patients with depression minus the individuals without depression. The percentage of overlapping lesions of the depressive individuals after substraction of non depressive individuals is illustrated by five different colors coding increasing frequencies from dark red (difference: 1-16.7%) to yellow (difference 83.5-100%) and indicating regions damaged more frequently in patient with depression than in patient without disorder. Each color represents 16.7% increments. The colors from dark blue ( difference 1-16.7%) to light blue (difference 83.4 -100%) indicate regions damaged more frequently in patients without depression than in patients with depression. Talairach z-coordinates (Talairach and Tournoux, 1988) of each transverse section are given.
References
Abe, O., Yamasue, H., Kasai, K., Yamada, H., Aoki, S., Inoue, H., Takei, K., Suga, M., Matsuo, K., Kato, T., Masutani, Y., & Ohtomo, K. (2010). Voxel-based analyses of gray/white matter volume and diffusion tensor data in major depression. Psychiatry Research: Neuroimaging, 181(1), 64‑70. https://doi.org/10.1016/j.pscychresns.2009.07.007 Arruda, J. E., Stern, R. A., & Somerville, J. A. (1999). Measurement of mood states in stroke patients : Validation of the
visual analog mood scales. Archives of physical medicine and rehabilitation, 80(6), 676‑680.
Ayerbe, L., Ayis, S., Wolfe, C. D. A., & Rudd, A. G. (2013). Natural history, predictors and outcomes of depression after stroke : Systematic review and meta-analysis. British Journal of Psychiatry, 202(1), 14‑21. https://doi.org/10.1192/bjp.bp.111.107664
Bae, K.-Y., Kang, H.-J., Kim, J.-W., Kim, S.-W., Kim, J.-T., Park, M.-S., Cho, K.-H., & Kim, J.-M. (2019). Associations of white matter hyperintensities with poststroke depression : A 1-year longitudinal study. International Journal of
Geriatric Psychiatry, 34(1), 162‑168. https://doi.org/10.1002/gps.5005
Bates, E., Wilson, S. M., Saygin, A. P., Dick, F., Sereno, M. I., Knight, R. T., & Dronkers, N. F. (2003). Voxel-based lesion– symptom mapping. Nature Neuroscience, 6(5), 448‑450. https://doi.org/10.1038/nn1050
Benaim, C., Cailly, B., Perennou, D., & Pelissier, J. (2004). Validation of the Aphasic Depression Rating Scale. Stroke, 35(7), 1692‑1696. https://doi.org/10.1161/01.STR.0000130591.95710.20
Burvill, P., Johnson, G., Jamrosik, K., Anderson, C., & Stewart‐Wynne, E. (1997). Risk factors for post‐stroke depression.
International journal of geriatric psychiatry, 12(2), 219‑226.
Carson, A. J., MacHale, S., Allen, K., Lawrie, S. M., Dennis, M., House, A., & Sharpe, M. (2000). Depression after stroke and lesion location : A systematic review. The Lancet, 356(9224), 122‑126. https://doi.org/10.1016/S0140-6736(00)02448-X
De Ryck, A., Brouns, R., Geurden, M., Elseviers, M., De Deyn, P. P., & Engelborghs, S. (2014). Risk factors for poststroke depression : Identification of inconsistencies based on a systematic review. Journal of geriatric psychiatry and
neurology, 27(3), 147‑158.
Dieguez, S., Staub, F., Bruggimann, L., & Bogousslavsky, J. (2004). Is poststroke depression a vascular depression?
Proceedings of the First Congress of the International Society for Vascular Behavioural and Cognitive Disorders (VAS-COG 2003), 226(1), 53‑58. https://doi.org/10.1016/j.jns.2004.09.012
Fazekas, F., Chawluk, J. B., Alavi, A., Hurtig, H. I., & Zimmerman, R. A. (1987). MR signal abnormalities at 1.5 T in Alzheimer’s dementia and normal aging. American journal of roentgenology, 149(2), 351‑356.
Folstein, M. F., Maiberger, R., & McHugh, P. R. (1977). Mood disorder as a specific complication of stroke. Journal of
Neurology, Neurosurgery & Psychiatry, 40(10), 1018‑1020.
Galluzzi, S., Lanni, C., Pantoni, L., Filippi, M., & Frisoni, G. B. (2008). White matter lesions in the elderly : Pathophysiological hypothesis on the effect on brain plasticity and reserve. Journal of the neurological sciences,
42
273(1‑2), 3‑9.
Georgakis, M. K., Duering, M., Wardlaw, J. M., & Dichgans, M. (2019). WMH and long-term outcomes in ischemic stroke : A systematic review and meta-analysis. Neurology, 92(12), e1298‑e1308.
Granger, C. V., Hamilton, B. B., Keith, R. A., Zielezny, M., & Sherwin, F. S. (1986). Advances in functional assessment for medical rehabilitation. Topics in geriatric rehabilitation, 1(3), 59‑74.
Hackett, M. L., & Anderson, C. S. (2005). Predictors of Depression after Stroke : A Systematic Review of Observational Studies. Stroke, 36(10), 2296‑2301. https://doi.org/10.1161/01.STR.0000183622.75135.a4
Hackett, M. L., Yapa, C., Parag, V., & Anderson, C. S. (2005). Frequency of Depression After Stroke : A Systematic Review of Observational Studies. Stroke, 36(6), 1330‑1340. https://doi.org/10.1161/01.STR.0000165928.19135.35
Inzitari, D., Pracucci, G., Poggesi, A., Carlucci, G., Barkhof, F., Chabriat, H., Erkinjuntti, T., Fazekas, F., Ferro, J. M., & Hennerici, M. (2009). Changes in white matter as determinant of global functional decline in older independent outpatients : Three year follow-up of LADIS (leukoaraiosis and disability) study cohort. Bmj, 339, b2477.
Karnath, H.-O., Fruhmann Berger, M., Küker, W., & Rorden, C. (2004). The anatomy of spatial neglect based on voxelwise statistical analysis : A study of 140 patients. Cerebral Cortex, 14(10), 1164‑1172.
Karnath, H.-O., Sperber, C., & Rorden, C. (2019). Reprint of : Mapping human brain lesions and their functional consequences. Mapping diseased brains, 190, 4‑13. https://doi.org/10.1016/j.neuroimage.2019.01.044
Kimberg, D. Y., Coslett, H. B., & Schwartz, M. F. (2007). Power in Voxel-based Lesion-Symptom Mapping. Journal of
Cognitive Neuroscience, 19(7), 1067‑1080. https://doi.org/10.1162/jocn.2007.19.7.1067
Levada, O. A., & Troyan, A. S. (2018). Poststroke Depression Biomarkers : A Narrative Review. Frontiers in Neurology, 9, 577‑577. PubMed. https://doi.org/10.3389/fneur.2018.00577
Liang, Y., Deng, M., Chen, Y.-K., Mok, V., Wang, D.-F., Ungvari, G. S., Chu, C.-W. W., Berge, E., & Tang, W.-K. (2017). Enlarged perivascular spaces are associated with health-related quality of life in patients with acute ischemic stroke.
CNS Neuroscience & Therapeutics, 23(12), 973‑979. https://doi.org/10.1111/cns.12766
Liao, Y., Huang, X., Wu, Q., Yang, C., Kuang, W., Du, M., Lui, S., Yue, Q., Chan, R., Kemp, G., & Gong, Q. (2013). Is depression a disconnection syndrome? Meta- analysis of diffusion tensor imaging studies in patients with MDD.
Journal of Psychiatry & Neuroscience, 38(1), 49‑56. https://doi.org/10.1503/jpn.110180
Moon, S. Y., de Souto Barreto, P., Rolland, Y., Chupin, M., Bouyahia, A., Fillon, L., Mangin, J. F., Andrieu, S., Cesari, M., & Vellas, B. (2018). Prospective associations between white matter hyperintensities and lower extremity function.
Neurology, 90(15), e1291‑e1297.
Murakami, T., Hama, S., Yamashita, H., Onoda, K., Kobayashi, M., Kanazawa, J., Yamawaki, S., & Kurisu, K. (2013). Neuroanatomic Pathways Associated with Poststroke Affective and Apathetic Depression. The American Journal
of Geriatric Psychiatry, 21(9), 840‑847. https://doi.org/10.1016/j.jagp.2013.01.057
Nagaraja, N., Forder, J. R., Warach, S., & Merino, J. G. (2020). Reversible diffusion-weighted imaging lesions in acute ischemic stroke : A systematic review. Neurology, 94(13), 571‑587.
Nys, G. M. S., van Zandvoort, M. J. E., van der Worp, H. B., de Haan, E. H. F., de Kort, P. L. M., & Kappelle, L. J. (2005). Early depressive symptoms after stroke : Neuropsychological correlates and lesion characteristics. Journal of the
Neurological Sciences, 228(1), 27‑33. https://doi.org/10.1016/j.jns.2004.09.031
Pantoni, L. (2010). Cerebral small vessel disease : From pathogenesis and clinical characteristics to therapeutic challenges.
The Lancet Neurology, 9(7), 689‑701.
Robinson, R. G., Kubos, K. L., Starr, L. B., Rao, K., & Price, T. R. (1983). Mood changes in stroke patients : Relationship to lesion location. Comprehensive Psychiatry, 24(6), 555‑566. https://doi.org/10.1016/0010-440X(83)90024-X Robinson, R. G., & Szetela, B. (1981). Mood change following left hemispheric brain injury. Annals of Neurology, 9(5),
447‑453. https://doi.org/10.1002/ana.410090506
Rorden, C., & Brett, M. (2000). Stereotaxic display of brain lesions. Behavioural neurology, 12(4), 191‑200.
Rorden, C., & Karnath, H.-O. (2004). Using human brain lesions to infer function : A relic from a past era in the fMRI age?
Nature Reviews Neuroscience, 5(10), 812‑819. https://doi.org/10.1038/nrn1521
Rorden, C., Karnath, H.-O., & Bonilha, L. (2007). Improving Lesion-Symptom Mapping. Journal of Cognitive Neuroscience,
19(7), 1081‑1088. https://doi.org/10.1162/jocn.2007.19.7.1081
Sagnier, S., Catheline, G., Dilharreguy, B., Linck, P.-A., Coupé, P., Munsch, F., Bigourdan, A., Debruxelles, S., Poli, M., & Olindo, S. (2020). Normal-appearing white matter integrity is a predictor of outcome after ischemic stroke. Stroke,
51(2), 449‑456.
Talairach, J., & Tournoux, P. (1988). Co-planar stereotaxic atlas of the human brain : 3-dimensional proportional system: an
approach to cerebral imaging. Georg Thieme.
Tang, W K, Chen, Y. K., Lu, J. Y., Chu, W. C. W., Mok, V. C. T., Ungvari, G. S., & Wong, K. S. (2010). White matter hyperintensities in post-stroke depression : A case control study. Journal of Neurology, Neurosurgery &
Psychiatry, 81(12), 1312. https://doi.org/10.1136/jnnp.2009.203141
Tang, W. K., Liu, X. X., Chen, Y. K., Abrigo, J., Chu, W. C. W., Mok, V. C. T., Ungvari, G. S., & Wong, K. S. (2014). Pontine Microbleeds and Depression in Stroke. Journal of Geriatric Psychiatry and Neurology, 27(3), 159‑164. https://doi.org/10.1177/0891988714522699
Tang, Wai Kwong, Chen, Y. K., Liang, H. J., Chu, W. C. W., Mok, V. C. T., Ungvari, G. S., & Wong, K. S. (2012). Cerebral Microbleeds and Suicidality in Stroke. Psychosomatics, 53(5), 439‑445. https://doi.org/10.1016/j.psym.2012.04.001
Tang Wai Kwong, Chen Yangkun, Liang Huajun, Chu Winnie Chiu Wing, Mok Vincent Chung Tong, Ungvari Gabor Sandor, & Wong Ka Sing. (2014). Cerebral Microbleeds as a Predictor of 1-Year Outcome of Poststroke Depression. Stroke, 45(1), 77‑81. https://doi.org/10.1161/STROKEAHA.113.002686
Tang, Wai Kwong, Lu, J. Y., Chen, Y. K., Chu, W. C. W., Mok, V., Ungvari, G. S., & Wong, K. S. (2010). Association of Frontal Subcortical Circuits Infarcts in Poststroke Depression : A Magnetic Resonance Imaging Study of 591 Chinese Patients With Ischemic Stroke. Journal of Geriatric Psychiatry and Neurology, 24(1), 44‑49.
44 https://doi.org/10.1177/0891988710392375
Tang, W.K., Chen, Y. K., Lu, J. Y., Chu, W. C. W., Mok, V. C. T., Ungvari, G. S., & Wong, K. S. (2011). Cerebral microbleeds and symptom severity of post-stroke depression : A magnetic resonance imaging study. Journal of
Affective Disorders, 129(1), 354‑358. https://doi.org/10.1016/j.jad.2010.08.007
Vataja, R., Pohjasvaara, T., Leppävuori, A., Mäntylä, R., Aronen, H. J., Salonen, O., Kaste, M., & Erkinjuntti, T. (2001). Magnetic Resonance Imaging Correlates of Depression After Ischemic Stroke. JAMA Psychiatry, 58(10), 925‑931. https://doi.org/10.1001/archpsyc.58.10.925
Yang, S., Hua, P., Shang, X., Cui, Z., Zhong, S., Gong, G., & Humphreys, G. W. (2015). A significant risk factor for poststroke depression : The depression-related subnetwork. Journal of Psychiatry & Neuroscience : JPN, 40(4), 259‑268. PubMed. https://doi.org/10.1503/jpn.140086
Appendix
ADRS Items (Bénaïm et al., 2004)
Item 1. Insomnia–Middle
0: No difficulty
1: Patient indicates being restless and disturbed during thenight/observed sleep disturbance 2: Waking during the night; any getting out of bed (except to goto the toilet)
Item 2. Anxiety–Psychic
0: No difficulty
1: Some tension and irritability 2: Worrying about minor matters
3: Apprehensive attitude apparent in patient’s face or speech
4: Fears indicated (verbal or nonverbal expression) withoutquestioning
Item 3. Anxiety–SomaticSymptoms can be gastrointestinal (dry mouth, flatulence, indiges-tion, diarrhea, cramps, belching); cardiovascular (palpitations, head-aches); respiratory (hyperventilation, sighing). Other symptoms in-clude urinary frequency, sweating.
0: Absent 1: Mild 2: Moderate 3: Severe
46
Item 4. Somatic Symptoms–Gastrointestinal
0: None
1: Loss of appetite but continues to eat; heavy feelings in abdomen
2: Difficulty eating (not due to arm paresis); requests or requireslaxatives or medication for bowels or for gastrointestinal symptoms
Item 5. Hypochondriasis
0: Not present
1: Self-absorption (bodily) 2: Preoccupation with health
3: Frequent complaints, requests for help, etc. 4: Hypochondriacal delusions
Item 6. Loss of WeightRating is by measurement and does not take into account loss ofweight that occurred during the acute poststroke phase.
0: 0.5 kg weight loss per week
1: 0.5 kg to 1 kg weight loss per week 2: > 1kg weight loss per week
Item 7. Apparent SadnessItem represents despondency, gloom, and despair (more than justordinary transient low spirits) reflected in speech (not available incase of severe aphasia), facial expression, and posture. Rating is bydepth and inability to brighten mood.
0: No sadness 1: between 0 and 2
3: between 2 and 4
4: Appears sad and unhappy most of the time 5: between 4 and 6
6: Looks miserable all the time; extremely despondent
Item 8. Mimic–Slowness of Facial Mobility (concernsonly the nonaffected side)
0: The head moves freely, resting flexibly on the body with thegaze either exploring the room or fixed on the examiner or on otherobjects of interest in an appropriate manner.
1: There may be some reduction of mobility, not easily confirmed.
2: Reduction of mobility is definite but mild; the gaze, while oftenfixed, is still capable of shifting; mimic, although monotonous, isstill expressive.
3: Patient does not move the head or explore the room and usuallystares at the floor, seldom looking at the examiner; patient is slow tosmile; expression is unchanging.
4: Face is completely immobile and painfully inexpressive.
Item 9. Fatigability (takes into account motor deficiency, if any)
0: Fatigability is not indicated spontaneously (by verbal ornonverbal communication) or after direct questioning.
1: Fatigability is not indicated spontaneously, but evidence of itemerges in the course of the interview.
2: Patient is distressed by fatigability in his everyday life (eating,washing, dressing, climbing stairs, or any other physical activity thepatient is usually able to do despite motor deficiency). 3: Fatigability is such that the patient must curb some activities.
SERMENT D’HIPPOCRATE
En présence des Maîtres de cette Faculté, de mes chers condisciples et devant l’effigie d’HIPPOCRATE,
Je promets et je jure d’être fidèle aux lois de l’honneur et de la probité dans l’exercice de la Médecine.
Je donnerai mes soi n s gratui tement à l ’i ndigent et n’exi gerai jamais un salaire au dessus de mon travail. Je ne participerai à aucun partage clandestin d’honoraires.
Admis dans l’intimité des maisons, mes yeux n’y verront pas ce qui s’y passe ; ma langue taira les secrets qui me seront conf iés et mon ét at ne servira pas à corrompre l es mœurs, ni à favori ser l e cri me.
Je ne permettrai pas que des considérations de rel igion, de nation, de race, de part i ou de classe sociale viennent s’interposer entre mon devoir et mon patient.
Je garderai l e respect absolu de la vie humaine.
Même sous la menace, je n’admettrai pas de faire usage de mes connaissances médicales contre les lois de l’humanité.
Respectueux et reconnaissant envers mes Maîtres, je rendrai à leurs enfants l’instruction que j’ai reçue de leurs pères.
Que les hommes m’accordent leur estime si je suis fidèle à mes promesses. Que je sois couvert d’opprobre et méprisé de mes confrères si j’y manque.