HAL Id: insu-00797057
https://hal-insu.archives-ouvertes.fr/insu-00797057
Submitted on 5 Mar 2013
HAL is a multi-disciplinary open access
archive for the deposit and dissemination of
sci-entific research documents, whether they are
pub-lished or not. The documents may come from
teaching and research institutions in France or
abroad, or from public or private research centers.
L’archive ouverte pluridisciplinaire HAL, est
destinée au dépôt et à la diffusion de documents
scientifiques de niveau recherche, publiés ou non,
émanant des établissements d’enseignement et de
recherche français ou étrangers, des laboratoires
publics ou privés.
Solution mechanisms of phosphorus in quenched hydrous
and anhydrous granitic glass as a function of
peraluminosity
B. O. Mysen, Holtz François, Michel Pichavant, Jean-Michel Bény, J.M.
Montel
To cite this version:
B. O. Mysen, Holtz François, Michel Pichavant, Jean-Michel Bény, J.M. Montel. Solution
mecha-nisms of phosphorus in quenched hydrous and anhydrous granitic glass as a function of
peralumi-nosity. Geochimica et Cosmochimica Acta, Elsevier, 1997, 61 (18), pp.3913-3926.
�10.1016/S0016-7037(97)00193-2�. �insu-00797057�
Pergamon
Geochimica el Cosmochimica Acta. Vol. 61, No. 18, pp. 3913-3926, 1997 Copyright ~.~ 1997 Elsevier Science Ltd Printed in the USA. All rights reserved 0016-7037/97 $17.0t) + .00 P I I S0016-7037(97) 00193-2
Solution mechanisms of phosphorus in quenched hydrous and anhydrous granitic glass
as a function of peraluminosity
B. O. MYSEN, ~ F. HOLTZ, 2'* M. PICHAVANT, 2 J.-M. BENY, ~- and J.-M. MONTEI, ~
~Geophysical Laboratory and Center for High Pressure Research, Carnegie Instn. Washington, 5251 Broad Branch Rd., NW.. Washington, DC 20015, USA
2CRSCM-CNRS, la, rue de la Ferollerie, 45071 Orleans, France
~Department de Geologie, URA 10 du CNRS, Universite Blaise Pascal, 5, rue Kessler, 63038 Clermont-Ferrand, France
(Received June 21, 1996; accepted in revised,/blvn May 16. 1997)
A b s t r a c t - - S o l u t i o n mechanisms of P in metaluminous to peraluminous quenched, hydrous ( - 9 wt% H 2 0 ) and anhydrous glasses in the system CaO-Na20-K20-AI203-SiO2-P205 have been examined with microRaman spectroscopy. The principal aim was to examine relative stability of phosphate complexes as a function of bulk chemical composition. Increasing peraluminosity was accomplished by increasing AI ~+ and Ca 2+ proportions with constant SiO2 content. The molar ratio Al203/(CaO + Na20 + K20)( A/ CNK) ranged from 1 (metaluminous) to - 1 . 3 (peraluminous).
In all compositions pS+ is bonded to A1 ~+ to form A1PO4 complexes. The principal solution mechanism is one where depolymerized species (Q3), involving AI 3+ both within and outside the aluminosilicate network, interact with P to form the A1PO4 complex together with Q4 species. The mechanism does not involve alkali metals or alkaline earths. In anhydrous compositions, the spectra are interpreted to suggest Si-O-P cross-linking in the structure. In hydrous compositions, evidence for Si-O-P bonding is less evident. In such glasses, there is, however, possible spectroscopic evidence for Si-OH bonding and possibly P-OH bonding resulting from breakage of cross-linking Si-O-P bonds existing in the anhydrous glasses. Therefore, the water content of peraluminous aluminosilicate melts is likely to affect the solubility behavior of P, and conversely, the solubility behavior of H20 is affected by P in such melts. Cop) right ~': 1997 Elsevier Science Ltd
1. INTRODUCTION
The geochemical behavior of phosphorus in both mafic and silicic magmas is receiving increasingly detailed attention (e.g., Ryerson and Hess, 1980; Watson and Capobianco, 1981; Harrison and Watson, 1984; Pichavant et al., 1992; Toplis et al., 1994a,b; Wolf and London, 1994). Although generally present in comparatively low concentrations in nat- ural magmas (less than 2 - 3 wt% P205), even in this abun- dance range P strongly modifies both physical and chemical properties of silicate liquids (Wyllie and Tuttle, 1964; Ku- shiro, 1975; Watson, 1976; Visser and Koster Van Groos, 1979; Ryerson and Hess, 1980; London, 1987; Dingwell et al., 1993, London et al., 1993; Toplis et al., 1994a; Toplis and Dingwell, 1996).
In silicic magmas, the P concentration generally is buf- fered by the solubility of apatite. Early studies (Ryerson and Hess, 1980: Watson and Capobianco, 1981; Harrison and Watson, 1984) have determined that apatite solubility in felsic melts is dependent primarily on temperature and melt SiO2 content and generally is small for crustal temperatures and melt compositions (e.g., 0.02 wt% P205 for a melt hav- ing 75 wt% SiO2 at 800°C, Harrison and Watson, 1984). Recent studies, however, have revealed that apatite solubility depends in a complex way on other melt compositional pa- rameters such as the balance between A1 and alkali plus
* Present address: Inst. Mineralogie, Univ. Hannover, Welfen- garten I, D-30167 Hannover, Germany.
Ca (i.e., A / C N K = A1203/(CaO + Na20 + K20), molar (Pichavant et al., 1992; Richard et al., 1992; Wolf and Lon- don, 1994), and FeO/FezO~ ratio (Richard et al., 1992). For constant melt SiO2 content and temperature, apatite solubility is increased dramatically for peraluminous liquids ( A / C N K > 1 ). Solubilities of up to several wt% P205 for peralumi- nous silicic liquids in equilibrium with apatite at 7 5 0 - 1000°C have been reported (Pichavant et al., 1992: Richard et al., 1992; Wolf and London, 1994). To be interpreted, such results require a better understanding of the structural role of P with the aid of detailed structural studies of multi- component P-bearing aluminosilicate melt compositions.
Most P-bearing silicate melt compositions studied in the glass literature are peralkaline, i.e., molar contents of alkali greatly exceeds that o f A l ( A / C N K < 1 ). For such composi- tions, results of spectroscopic studies have shown that the addition of P increases polymerization of silicate network. In those melts alkali metals associate with P to form phosphate complexes and the number of nonbridging oxygens de- creases (Nelson and Tallant, 1984: Dupree et al., 1988, 1989). In contrast, for both subaluminous ( A / C N K = 1) and peraluminous ( A / C N K > 1) melts, it has been sug- gested that P speciation is characterized by the presence of AlPO4-1ike units (Mysen et al., 1981; Kosinski et al., 1988; Dupree et al., 1989; Gan and Hess, 1992). Complexing of p s , with A13+ in peraluminous aluminosilicate melts would account for the strong increase of apatite solubility found experimentally (Pichavant et al., 1992; Wolf and London, 1994). However, none of the different spectroscopic studies
3914 B. O. Mysen et al.
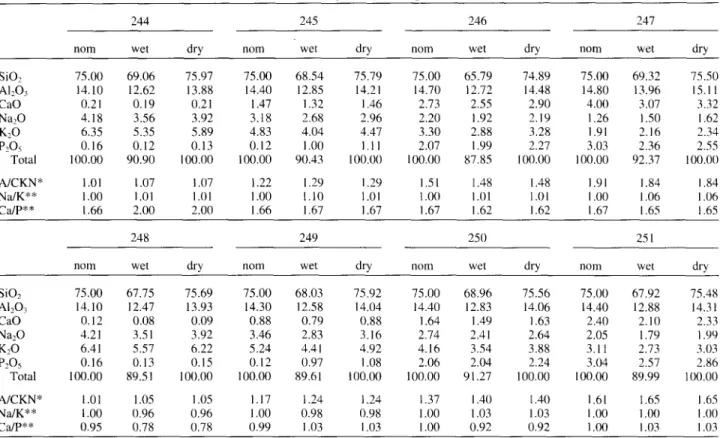
Table 1. Composition of the glasses.
244 245 246 247
nora wet dry nom wet dry nom wet dry nora wet dry
SiO2 75.00 69.06 75.97 75.00 68.54 75.79 AI:O3 14.10 12.62 13.88 14.40 12.85 14.21 CaO 0.21 0.19 0.21 1.47 1.32 1.46 Na20 4.18 3.56 3.92 3.18 2.68 2.96 K,O 6.35 5.35 5.89 4.83 4.04 4.47 P2Os 0.16 0.12 0.13 0.12 1.00 1.11 Total 100.00 90.90 100.00 100.00 90.43 100.00 A/CKN* 1.01 1.07 I.(17 1.22 1.29 1.29 Na/K** 1.00 1.01 1.01 1.00 1.10 1.01 Ca/P** 1.66 2.00 2.00 1.66 1.67 1.67 75.00 65.79 74.89 75.00 69.32 75.50 14.70 12.72 14.48 14.80 13.96 15.11 2.73 2.55 2.90 4.00 3.07 3.32 2.20 1.92 2.19 1.26 1.50 1.62 3.30 2.88 3.28 1.91 2.16 2.34 2.07 1.99 2.27 3.03 2.36 2.55 100.00 87.85 l O 0 . O 0 100.00 92.37 100.00 1.51 1.48 1.48 1.91 1.84 1.84 1.00 1.01 1.01 1.00 1.06 1.06 1.67 1.62 1.62 1.67 1.65 1.65 248 249 250 251
nora wet dry nora wet dry nora wet dry nora wet dry
SiO2 75.00 67.75 75.69 75.00 68.03 75.92 A1203 14.10 12.47 13.93 14.30 12.58 14.04 CaO 0.12 0.08 0.09 0.88 0.79 0.88 Na20 4.21 3.51 3.92 3.46 2.83 3.16 K20 6.41 5.57 6.22 5.24 4.41 4.92 P_,O5 0.16 0.13 0.15 0.12 0.97 1.08 Total 100.00 89.51 100.00 100.00 89.61 100.00 A/CKN* 1.01 1.05 1.05 1.17 1.24 1.24 Na/K** 1.00 0.96 0.96 1.00 0.98 0.98 Ca/P** 0.95 0.78 0.78 0.99 1.03 1.03 75.00 68.96 75.56 75.00 67.92 75.48 14.40 12.83 14.06 14.40 12.88 14.31 1.64 1.49 1.63 2.40 2.10 2.33 2.74 2.41 2.64 2.05 1.79 1.99 4.16 3.54 3.88 3.11 2.73 3.03 2.06 2.04 2.24 3.04 2.57 2.86 100.00 91.27 100.00 100.00 89.99 100.00 1.37 1.40 1.40 1.61 1.65 1.65 1.00 1.03 1.03 1.00 1.00 1.00 1.00 0.92 0.92 1.00 1.03 1.03 * Molar ratio, A1203/(CaO + Na20 + K20) **Atomic ratios
so far a v a i l a b l e h a v e b e e n c o n d u c t e d on c o m p o s i t i o n s ap- p r o a c h i n g e i t h e r natural p e r a l u m i n o u s or e x p e r i m e n t a l m e l t s s h o w i n g e l e v a t e d apatite solubility. Here, w e p r e s e n t r o o m t e m p e r a t u r e R a m a n s p e c t r o s c o p i c data o n the m e c h a n i s m s o f s o l u t i o n o f P205 in p e r a l u m i n o u s q u e n c h e d m e l t s ( g l a s s ) in the s y s t e m SiO2-AI203-NazO- K z O - C a O - P 2 0 5 with and w i t h o u t H 2 0 . T h e d a t a c o n c e r n t w o series o f glasses, o n e w i t h a C a / P ratio o f 5 / 3 (i.e., s a m e as in a p a t i t e ) and t h e o t h e r w i t h C a / P = 1, thus e n a b l i n g to test the p o s s i b l e p r e f e r e n c e o f P to c o o r d i n a t e w i t h Ca rather than w i t h A1.
2. E X P E R I M E N T A L A N D A N A L Y T I C A L M E T H O D S
2.1. Preparation of Glasses
Starting materials were P205-free gels (or glasses). Nominally, these have constant SiO2 content of 75 wt% and constant N a / K of 1. In each series of four compositions (1: Ca/P = 5/3 and 2: Ca/ P = 1 ), AI and Ca progressively increase (along with P concentra- tion), whereas the total alkali contents decrease, resulting in compo- sitions becoming progressively more peraluminous ( A / C N K = 1.0, 1.1, 1.2, 1.3, Table 1 ). There is, therefore, a positive correlation between A / C N K and phosphorus content of the two series of glasses (Fig. l ).
The glasses were initially synthesized hydrous at high pressure and temperature. The source of P205 was an H3PO4 solution. The gels were loaded in Pt capsules, together with the H3PO4 solution and a small additional amount of demineralized doubly-distilled wa- ter added so that glasses contain 9 - 1 0 wt% H20. Two batches of eight hydrous glasses (about 200 mg each) were synthesized in
internally-heated pressure vessels, respectively, at 1100°C, 8 kbar for 7 - 9 days (see description of apparatus by Vielzeuf and Montel, 1994), and 1300°C, 4 kbar for 3 days (see Roux et al., 1994, for description of apparatus).* The samples were contained in sealed Pt containers.
All glasses were analyzed with a Cameca SX 50 electron micro- probe to check for their composition and chemical homogeneity. Analytical conditions and standards were those established pre- viously for P20~-bearing glasses of similar compositions (Pichavant et al., 1992) using the precautions described by Pichavant (1987) for analysis of hydrous alkali aluminosilicate glasses. Results are given in Table 1 and recalculated to 100% to compare with nominal compositions. Macusani glass was used as P205 standard. The water contents of two of the glasses, 245 and 248, were determined with Karl Fischer titration (Behrens, 1995; Holtz et al., 1995). The ana- lyzed values (8.53 and 8.27 wt% H20, respectively) compare well with the maximum water contents from the proportions of the re- actants ( 8 . 9 - 9 . l wt%).
The Raman microspectroscopic analyses of the dry compositions were performed from small chips of hydrous glasses that were slowly dehydrated in situ in a Pt wire furnace of the type developed by Mysen and Frantz (1992) for high-temperature, in situ microRaman spectroscopy. Complete dehydration was taken as that where there was no longer Raman intensity near 3600 cm -~ (OH stretching) corresponding to less than 0.1 wt% H20 in the glass lB. O. Mysen and D. Virgo, unpubl, data). The Raman analyses of hydrous glasses were carried out on small glass chips.
Raman spectra were recorded with a Dilor XY confocal microRa- man spectrometer equipped with a cryogenic Wright Model CCD
* All samples except no. 246 were prepared at 1100°C and 8 kbar. Sample 246 was prepared at 1300°C and 4 kbar.
Solution mechanism of P in granitic glass 3915 1 4 O [] 1.3 o z 1.2 o 1,1 1.0 0 1 2 3 wt% P205
Fig. t. Relationship between peraluminisity (A/CNK) and P205 content of the glasses
05-l 1-0-202 charge-coupled detector (CCD). The excitation source was the 514 nm line of a Coherent Innova Model 90-5 Ar + laser operating at several hundred mW at the sample. Integration times ranged from 60 to 300 s. The spectra were recorded in the frequency ranges 200-1800 cm ~ and 3000-4000 cm ~.
The high-frequency portion of the spectra was deconvoluted with lines of Gaussian shape as is normally done with Raman spectra of silicate glasses (See Mysen, 1992, for detailed discussion). Prior to deconvolution of the spectra, the instrumental background was subtracted by using a line obtained by least-square fitting of the data points at frequencies where no Raman scattering was observed. The spectra were then corrected for temperature- and frequency-depen- dent scattering intensity (Long, 1977) and the intensities were nor- malized to the absolute maximum intensity. The curve-fitting is based on the minimization of the squares of the deviations between the observed and calculated Raman envelopes using the algorithm described by Davidon (1966) (see also Seifert et al., 1982; Mysen et al., 1982; Mysen, 1992, for details). The line parameters were treated as independent variables. The number of lines was deter- mined statistically to be that number where additional lines did not improve the quality of the fit significantly. A significant shift in X 2 corresponds to a 10% or more improvement when increasing the number of independent variables by (Hamilton, 1965). As three independent variables are needed to describe one line, a 10% im- provement in X-" is required to justify an increase in the number of fitted lines by one.
3. RESULTS
The R a m a n spectra can be divided into two frequency regions. The low-frequency region b e t w e e n 200 and 1300 cm ~ contains the first order R a m a n b a n d s associated with the aluminosilicate network (see Fig. 2 for e x a m p l e s ) . That b e t w e e n 3000 and 4 0 0 0 cm - I contains the O - H stretch vibra- tions f r o m hydroxyl groups and m o l e c u l a r H 2 0 in samples containing dissolved H 2 0 (Fig. 3 ) . The presence of molecu- lax H 2 0 in the glass samples is e v i d e n c e d by the w e a k b a n d near 1600 cm ~ assigned H - O - H bending.
3 . 1 . L o w - F r e q u e n c y R e g i o n ( 2 0 0 - 1 3 0 0 c m ')
The R a m a n spectra of a n h y d r o u s glasses (e.g., Fig. 2) overall show similar topology with a broad b a n d centered near 1100 cm ~. This m a x i m u m is a s y m m e t r i c toward lower frequency. There is another strong m a x i m u m near 500 cm with additional spectral detail near 600 c m -l . There is also a distinctive band near 800 cm ~. The overall topological
100 80 60 40 20 0 - 200 100 8O o~
8o
E 40 / 20 /A
,,~f'~
~ / 247 s A ,/i i /,~,:.f T M ,'/ :X"
' ~ j / t 'tk \ I I I I I 0 400 600 000 1000 12 0 Wavenumber, cm -1 i i i i i/
:\
/f'l
/ 47 ~J i i400
600
8;0
0'00
2'00
Wavenumber, cm "1Fig. 2. Examples of unpolarized Raman spectra in the low-fre- quency region of nominally P-free (244) and P-bearing (247) glasses anhydrous (A) and hydrous (B).
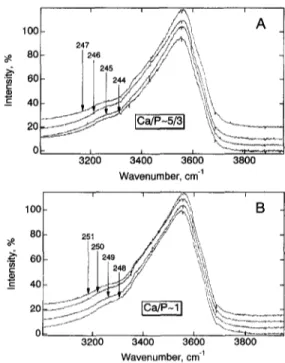
features resemble those of other highly polymerized alumi- nosilicate glasses (e.g., M c M i l l a n et al., 1982; Seifert et al., 1982; M a t s o n et al., 1986). o~ o) E 100 80 60 40 20 !, A 247 'i 246 ,'\ 3200 3400 3600 3800 Wavenumber, cm -1 o~ "E 100 80 60 40 20 3200 3400 3600 3800 Wavenumber, cm -~
Fig. 3. Unpolarized Raman spectra in the spectral region of OH stretching.
3916 B.O. Mysen et al. 60 o~ = 40 ~ 20 [ f r r \ s' t \ 990// / I
)
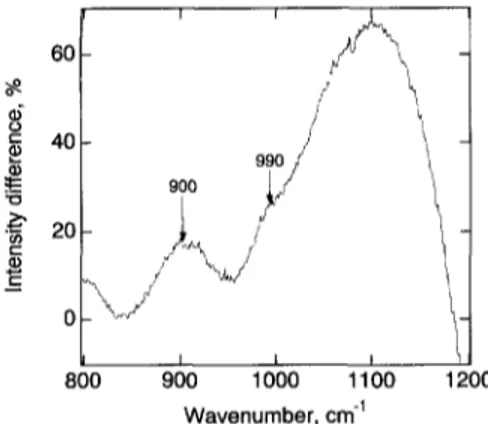
0 I I I 800 900 1000 11 O0 Wavenumber, cm -1 t 1200Fig. 4. Difference spectra (hydrous-anhydrous) in the 800-1200 cm ~ range illustrating the influence of H20 on the Raman intensi- ties. Sample 244 is nominally P-free.
In the 2 0 0 - 1 3 0 0 cm ~ region, the principal spectral effect resulting from added H20 to the samples is the appearance of a broad strong band near 900 cm ~ (Fig. 2), an observation consistent with those of Mysen and Virgo (1986a) and McMillan et al. (1993). In both the P-free and P-bearing samples, the difference spectra ( h y d r o u s - a n h y d r o u s sam- ples) also reveal a shoulder near 990 cm ~ (Fig. 4).
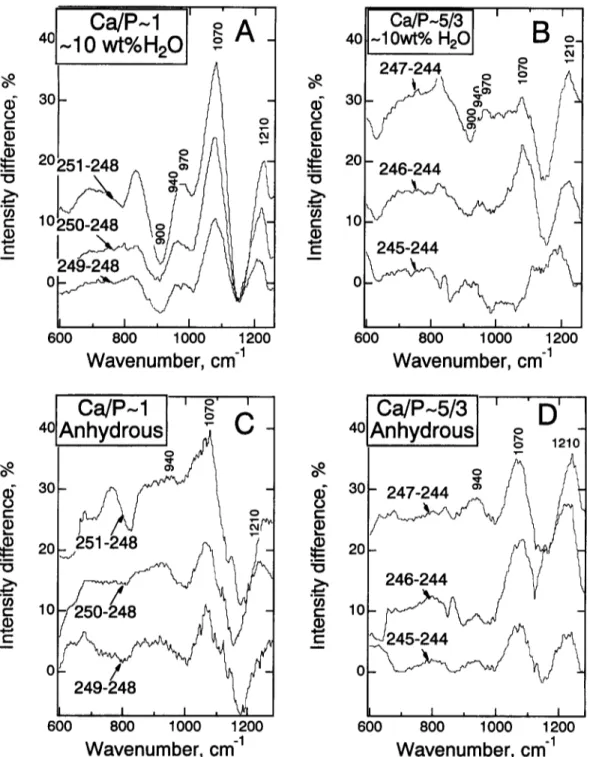
Addition of phosphorus to both hydrous and anhydrous samples, whether at C a / P - 5/3 or C a / P - 1, results only in subtle spectral changes (Fig. 2a, cf. spectrum 244, which is nominally P-free, and spectrum 247, which contains nearly 3 wt% P205). There appears to be a shoulder slightly below 1100 cm ~, a feature more clearly shown as a maximum near 1070 cm l in the difference spectra (P-bearing-P-free; see Fig. 5). In anhydrous samples with the highest C a / P ( - 5 / 3 ; samples 2 4 5 - 2 4 7 ) , a subtle intensity increase near 940 cm ~ with increasing phosphorus content may also be discerned (Fig. 5d). This latter effect is less clear in the samples with C a / P - 1 (samples 2 4 9 - 2 5 1 ; Fig. 5c). In the spectra of the hydrous glasses (Fig. 5a,b), this latter effect is obscured by the significant intensity increase near 9 7 0 - 990 c m ~ (see also Fig. 4). These spectral changes near 940 and 1100 cm ~ are qualitatively analogous to those of other P-bearing aluminosilicate glasses (e.g., Gan and Hess, 1992 ). The presence of phosphorus in the glasses also results in an intensity increase in the Raman spectra of such samples near 1210-1220 cm l (marked as 1210 in Fig. 5).
The spectra of P-bearing, hydrous samples (see Fig. 2b, for example) show the same overall topological features as the spectra of P-free hydrous samples. It is evident, however, that the intensity near 900 cm ~ diminishes with increasing P-content (and concomitant increase in peraluminosity; see Fig. 5 a , b ) J Increasing P-content also results in enhanced intensity near 1070 cm ~ for the C a / P -- 1 series. This intensity change is less pronounced for hydrous samples with C a / P - 5/3 (Fig. 5a,b).
3.1.1. Curve-fitted spectra
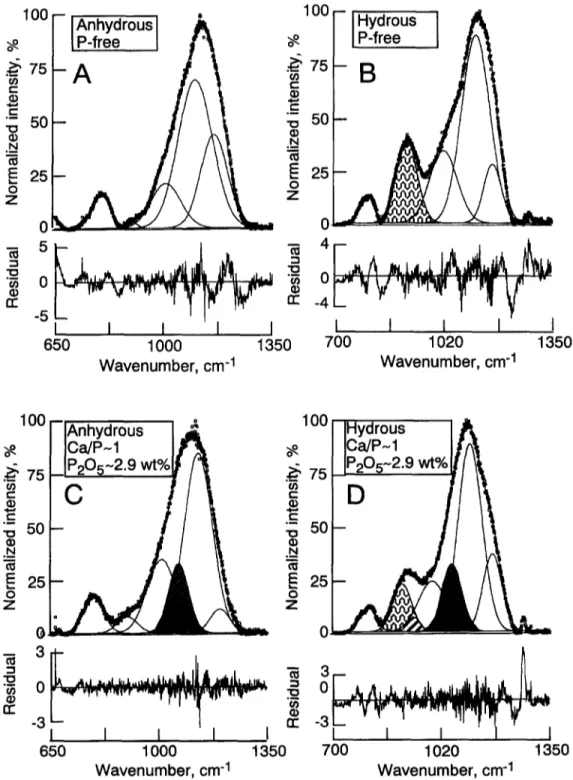
The spectral region between - 8 5 0 and 1250 cm ~ was fitted to Gaussian bands with the number of bands statisti- cally determined as described above (experimental meth- ods). Typical examples are shown in Fig. 6. A summary of the frequencies and areas of these bands is given in Ta- ble 2.
The spectra of P-free, anhydrous glasses were fitted to a very weak band near 900 cm ~, and three strong bands near 1000, 1100, and 1200 cm ~, respectively, similar to other Raman data from highly polymerized aluminosilicate glasses (e.g., Seifert et al., 1982)J: For the anhydrous, P-bearing samples, the frequencies of the latter three bands are only very subtly dependent on the phosphorus content (Table 2). In the spectra of hydrous, both P-free and P-bearing samples. the frequencies of these latter three bands are distinctly higher (by as much as 2 0 - 3 0 cm ]) than in the spectra of the equivalent anhydrous samples. This observation accords with other spectroscopic data on the effect of H20 content on Raman frequencies in this frequency range for aluminosil- icate glasses (Mysen and Virgo, 1986a).
In the presence of H20 (e.g., Fig. 6b,d; see also Tables 2 and 3 for complete set of data), a strong band occurs near 900 cm l in accord with other Raman and infrared spectro- scopic data of hydrous aluminosilicate glasses (e.g., Mysen et al., 1980; Remmele et al., 1986; Mysen and Virgo, 1986a,b; Silver and Stolper, 1989; McMillan et al., 1993; Holtz et al., 1996). A band near 970 cm ~ is also observed (Fig. 6, see also Table 2). In the spectra of P-containing glasses, whether hydrous or anhydrous, two additional bands near 1100 and 1210 cm ~, respectively, are needed to satisfy the spectral envelope (e.g., Fig. 6). In the hydrous, phospho- rus-bearing samples, a band near 940 cm 1 could also be fitted. This band is less evident in spectra of anhydrous, P- bearing samples (Table 3). In all cases, whenever present the frequencies of the 940, 1100, and 1210 cm ~ bands appear insensitive to H20 and P concentrations (Table 2).
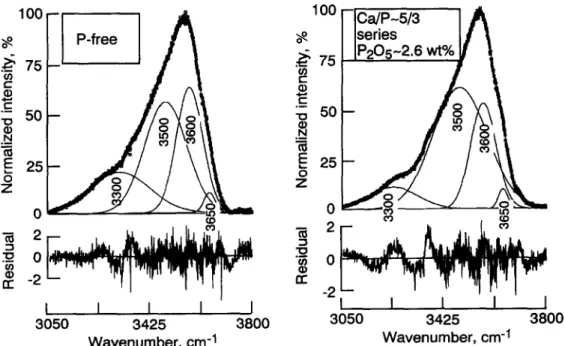
3.2. High-Frequency Region ( 3 0 0 0 - 4 0 0 0 cm ~) The high-frequency region between 3000 and 4000 cm of the spectra of all the hydrous samples is quite similar (Fig. 3) with a broad intensity maximum near 3600 cm ~, asymmetric toward lower frequencies and with a small shoulder near - 3 3 0 0 c m ~. This spectral topology is similar to that of other hydrous, highly polymerized aluminosilicate glasses (e.g., Mysen et al., 1980; M~zsen and Virgo, 1986a,b; McMillan et al., 1993).
3.2.1. Curve-fitted spectra
In the curve-fitted spectra, four Gaussian bands near 3300, 3500, 3600, and 3650 cm l were inserted (Fig. 7). Their
This effect appears as an increasingly deep valley in the differ- ence spectra in Fig. 5A,B.
-: The anhydrous, P-free glasses (no. 244 and 248; see Table I ) have NBO/T values of 0.022 and 0.027, respectively. Thus any contribution from nonbridging oxygen is not likely to be detected in the Raman spectra.
Solution mechanism of P in granitic glass 3917
401
Ca/P~1
I' o
I-1O
wt%H20]
~ ,t
~
o
20251-248 _
N .
' 1o
1 2 4 ~ 2 ~ ~
~
U , I , I 600 800 1000W a v e n u m b e r , cm -1
II Ca/P~5/31 '
~ ' I
4oli-Iowt% H201
O E-I
[ 2 4 7 - 2 4 4
o
~
71
~-
20
248-244
~ /
~
" I'/1
~
10 '
"~
245-244
~/¢~ I
o
, I , I , I I1200
60(
800
1000
1200
-1W a v e n u m b e r , cm
Ca/P~1 I' o.
o~
4c
An~
d 30-
e--20 .~251-248
t-- 10
8
-=
o
249-248
, I , I , 600 800 1000 IC -
f
4O
3o
~:
20
0
Ca/P~5/31
'
D'
Anhydr°usl
~
12,o
- 247.244 ~ / ~
/ j
I , I = I120(
600
800
1000
1200
W a v e n u m b e r ,
c m -1W a v e n u m b e r , cm 1
Fig. 5. Difference spectra illustrating the effect of increased phosphorus content for the two series of samples both anhydrous and hydrous. (A) The series Ca/P - 1 with approximately 10 wt% H20 in solution. The spectra 249, 250, and 251 were subtracted from spectrum 248 (nominally P-free). (B) As A, but for the series Ca/P ~ 5/3. In this series spectra 245, 246, and 247, were subtracted from the nominally P-free spectrum 244. (C) As A, but for anhydrous samples. (D) As B, but for anhydrous samples.
frequencies, with the exception of the b a n d near 3300 c m ], are insensitive to C a / P , A / C N K , and p h o s p h o r u s content ( T a b l e 4 ) . The lowest-frequency band, near 3300 c m ~, exhibits a slight frequency decrease as the p h o s p h o r u s con- tent is increased ( T a b l e 4 ) . The relative b a n d areas vary systematically with
P205
content (Fig. 8). Notably, in theC a / P - 5 / 3 series, the b a n d near 3500 c m ~ grows and those near 3300 and 3600 cm ~ diminish, whereas the oppo- site trends with P-content is o b s e r v e d in the spectra of the C a / P - 1 series of glasses (Fig. 8). The b a n d near 3650 cm ~ is quite w e a k in all spectra ranging in relative area from 1.3 to 2.2% of the total area of the envelope.
100
-IH_Y dr°us I
A
o~
"E
Z
nm
.lo
n"
0 I11~=
5
0
-5
I
650
~
- IAnhydr°usl
~ t
100
I P-free
I
f "~
Z-°°
,I.,,J/Ik t,ltl~.l,~.l
I JL,.h "~
L- "
v v -
I
I
I
I
1000
1350
Wavenumber, cm -1
3918 B.O. Mysen et al.
I
I
I
I
I
70O
1020
1350
Wavenumber, cm -1
100 -
-IAnhydr°us.
[
o~
ICa/P-1
o
lP205~2.9 wt %
~" 75 -
( D:g 5O
"o
A,J ..,tj~.,,a~dl
. j.ljLL.~.,,.~
=
n"" 0 Z ' '~'r ~,,vr,~-f,p[~r 111, "'IIW'- "" "-'~.¢n
-3
n-
I
I
I
I
I
650
1000
1350
100
,_z.
e- e- "0._.
ZWavenumber, cm -1
IHY dr°us
I A
I ca/P~1
o Ifh~
75 J
5 0 -
25
0
v
J
700
1020
1350
Wavenumber, cm -1
Fig. 6. Examples of curve-fitted spectra. Bands assigned to vibrations resulting from the presence of HzO are shown with dotted patterns, whereas bands assigned to vibrations associated with phosphorus are indicated with hachured patterns.
3.3.
Band Assignments and Structural
I n t e r p r e t a t i o n The starting point for interpretation of the aluminosilicate glass spectra is that of vitreous SiO2 where two average structures differing in the number of tetrahedra in the three- dimensionally interconnected rings are commonly suggested( M a m m o n e et al., 1981; Galeener, 1982; Seifert et al., 1982, 1983; Revesz and Walrafen, 1983). These two ring struc- tures give rise, for example, to the two bands near 1150 and 1200 cm ~ both of which are assigned to Si-O ° stretch vibrations. A detailed analysis of spectra of glasses along the join SiO2-NaAIO2 led Seifert et al. (1982) to conclude
Solution mechanism of P in granitic glass 3919
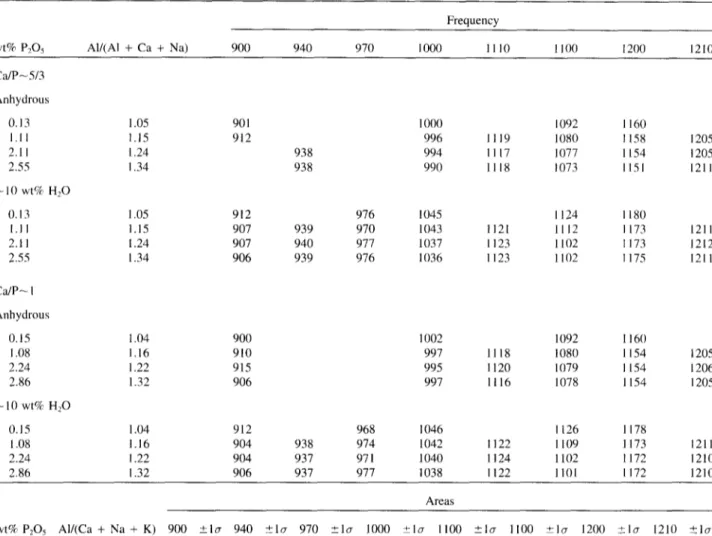
Table 2. Experimental r e s u l t s - - l i n e parameters in 7 0 0 - 1 3 0 0 cm ~ region.
wt% P205 All(A1 + Ca + Na) Frequency 900 940 970 1000 1110 1100 1200 1210 C ~ P - 5 / 3 Anhydrous 0.13 1.05 1.11 1.15 2.11 1.24 2.55 1.34 ~ 1 0 wt% H2O 0.13 1.05 1.11 1.15 2.11 1.24 2.55 1.34 901 912 938 938 912 907 939 907 940 906 939 1000 1092 l l 6 0 996 I l l 9 1080 1158 1205 994 l l l 7 1077 1154 1205 990 1118 1073 1151 1211 976 1045 1124 1180 970 1043 1121 1112 1173 1211 977 1037 1123 1102 I173 1212 976 11136 1123 1102 1175 1211 C ~ P - I Anhydrous 0.15 1.04 900 1.08 1.16 910 2.24 1.22 915 2.86 1.32 906 - 1 0 wt% H20 0.15 1.04 912 1.08 1.16 904 2.24 1.22 904 2.86 1.32 906 1002 1092 1160 997 1118 1080 1154 1205 995 l l 2 0 1079 1154 1206 997 1116 1078 1154 1205 968 1046 1126 1178 938 974 1042 1122 1109 1173 1211 937 971 1040 1124 1102 1172 1210 937 977 1038 1122 1101 1172 1210 Areas
wt% P2Os AI/(Ca + Na + K) 900 _+kr 940 ,+1~7 970 _+lcr 1000 +lcr 1100 _+lcr 1100 +lcr 1200 :_~1~ 1210 "+1o C J P ~ 5 / 3 Anhydrous 0.13 1.05 1.11 1.15 2.11 1.24 2.55 1.34 ~ 1 0 wt% H20 /).13 1.05 1.11 1.15 2.11 1.24 2.55 1.34 50 21 1027 104 92 28 1066 69 880 27 19 654 65 785 303 49 506 57 235 4683 285 3266 248 50 4232 129 2121 I02 1169 71 78 4566 120 2371 208 1859 146 30 4339 116 3197 76 874 42 941 48 870 60 1299 60 6546 118 471 41 745 35 223 38 499 84 1527 145 496 64 4349 175 1912 89 52 17 740 60 283 99 467 201 1121 329 418 240 5042 485 1683 225 224 83 583 50 253 85 609 98 1039 78 421 209 4986 299 2001 62 153 32 C ~ P ~ 1 Anhydrous 0.15 1.04 1.08 1.16 2.24 1.22 2.86 1.32 ~ 1 0 wt% H20 0.15 1.04 1.08 1.16 2.24 1.22 2.86 1.32 80 29 139 33 288 46 115 3l 1182 98 4691 158 3756 127 1110 116 515 41 4170 196 2439 115 1038 70 911 55 377 30 4366 102 2457 78 1026 61 1343 111 793 103 4291 198 2341 94 641 70 1281 70 819 66 1820 49 4753 99 1107 52 757 38 384 54 547 80 1348 80 829 66 4091 109 1713 61 27 10 812 47 443 36 457 50 1473 313 629 255 4503 632 1681 398 170 106 570 37 367 61 572 121 1000 224 410 171 4852 403 1383 124 172 103
3920 B.O. Mysen et al.
Table 3. Area of 940 cm ~ band relative to total area # of high- frequency envelope (850-1300 cm ~).
Wt% P202 A/CNK* Hydrous (_+ I or) Anhydrous (_+ 1 or)
Ca/P-5/3 1.11 1.15 0.024 (4) n.d. 2.11 1.24 0.030 (10) 0.003 (2) 2.55 1.34 0.027 (9) 0.004 (5) Ca/P~ 1 1.08 1.15 0.042 (6) n.d. 2.24 1.24 0.046 (4) n.d. 2.86 1.34 0.042 (7) n.d.
# The area of the 970 cm -~ band not included. n.d. Not Detected.
* Molar AI203/(CaO + Na20 + K20).
that a similar structural environment existed as A13+ substi- tuted for Si 4÷ in glasses along this join. The frequencies of the bands near 1150 and 1200 cm ~ in spectra of vitreous SiO2 decreased systematically with increasing All (A1 + Si). In the present spectra of anhydrous, P-free glasses, bands assigned to (Si,A1)-O ° stretching, occur near 1090 and 1160 cm -~, respectively (Table 2; see also Fig. 6a).
The assignment of the ~900 cm ~ band in spectra of all hydrous samples (whether P-bearing or nominally P-free) as well as in published spectra of other hydrous aluminosilicate glasses has been the subject of debate. One assignment is to (Si,A1)-OH stretch vibrations (e.g., Remmele et al., 1986; McMillan et al., 1993). From multinuclear NMR (23Na,27Al,29Si), Kohn et al. (1989, 1992) concluded, how-
ever, that in melt of albite composition there is no evidence for AI-OH or Si-OH bonding but, rather that the principal OH-formation is through interaction with alkalis. Thus, the inference from the NMR data is inconsistent with the assign- ment of the 900 cm -~ band to (Si,A1)-OH stretching. The observation (Mysen and Virgo, 1986a) that the intensity of this band increases continuously with increasing HzO content (up to 8 - 1 0 wt% H20) also is inconsistent with an assign- ment to (Si,A1)-OH. This inconsistency is because in hy- drous aluminosilicate glasses with total
H20
content above - 3 wt% results from IR spectroscopy (e.g., Stolper, 1982; Silver and Stolper, 1989; Silver et al., 1990) show that any additional H20 is dissolved in molecular form. Thus, one would not expect the 900 cm 1 band intensity to increase if it was assigned to any kind of vibration associated with structurally bound OH groups. Others have assigned the 900 cm 1 band to (Si,A1)-O- stretching arising from the pres- ence of nonbridging oxygen in the hydrous samples (e.g., Mysen and Virgo, 1986a). Such proposed nonbridging oxy- gen could be as the result of formation either of M-OH or AI- OH complexes. By forming M-OH complexes, the charge- balance requirement of A13+ in tetrahedral coordination is no longer met. By forming A1-OH complexes, there would be an excess M-cations. In either case, nonbridging oxygen would be formed. (This effect is illustrated with Eqns. 9 and 10 and Table V in Mysen and Virgo, 1986a.) Although clearly more information is needed before the issue can be fully resolved, in the absence of evidence to the contrary, we assign the 900 cm -~ band to (Si,A1)-O stretching in a depolymerized structural unit (probably of Qz type). The spectral interpretation is also consistent with results from anhydrous peralkaline melts and glasses in, for the example, the system NazO-A1203-SiO2. Spectra of melt and glasses in100
. 75
g
E
50
Z mn"
0;
..,
l ,.,, ,r Tl , ,.,
I
I
I
I
I
3 0 5 0 3425 3800 Wavenumber, cm -1 100o~
..~.~ 75
o = E -o 5 02 5
o Z "1o rr-Ic P-5/3
Isenes
[P205-2.6 wt%
C m 0 tO¥
-2I
I
I
I
I
3050 3425 3 8 0 0 Wavenumber, cm -1Solution mechanism of P in granitic glass
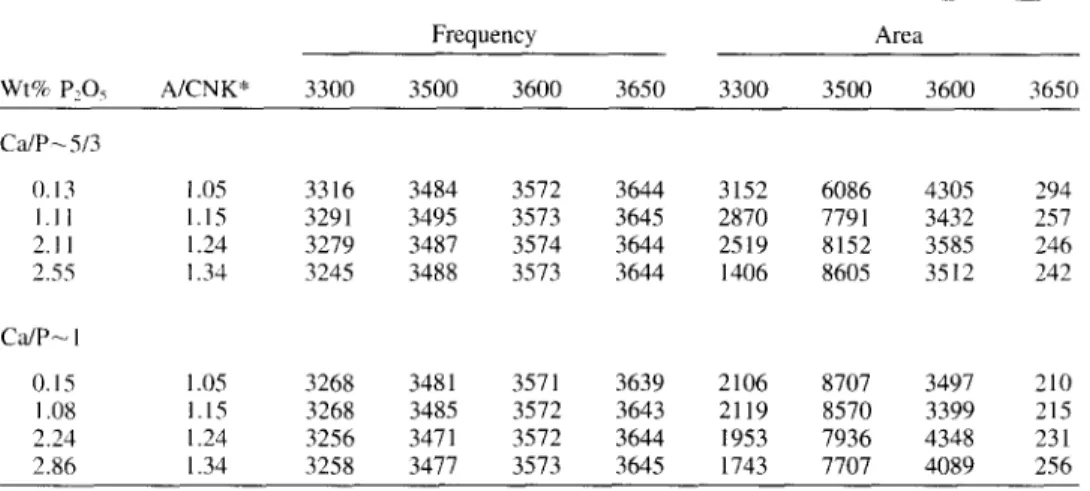
Table 4. Experimental results--line parameters in the 3000-4000 cm -~ region.
3921 Frequency Area Wt% P~O~ A/CNK* 3300 3500 3600 3650 3300 3500 3600 3650 Ca/P ~ 5/3 0.13 1.05 3316 3484 3572 3644 3152 6086 4305 294 I.II 1.15 3291 3495 3573 3645 2870 7791 3432 257 2.11 1.24 3279 3487 3574 3644 2519 8152 3585 246 2.55 1.34 3245 3488 3573 3644 1406 8605 3512 242 C ~ P ~ 1 0.15 1.05 3268 3481 3571 3639 2106 8707 3497 210 1.08 1.15 3268 3485 3572 3643 2119 8570 3399 215 2.24 1.24 3256 3471 3572 3644 1953 7936 4348 231 2.86 1.34 3258 3477 3573 3645 1743 7707 4089 256
* Molar AI20~/(CaO + Na20 + K20).
this system reveal significant reduction in frequencies of bands assigned to Si-O stretching as the A I / ( A I + Si) of the system is increased (Mysen and Frantz, 1994).
The relative intensity of the 900 cm-J band could then be a measure of degree of polymerization of the melts. Interest- ingly, the area of this band is greater in all the spectra of samples from the C a / P - 1 series. Furthermore, in both series, its relative area decreases somewhat with increasing phosphorus content (Fig. 9). Consequently, one may suggest that in hydrous aluminosilicate melts, P acts as a polymeriz- ing agent analogous to the structural role of phosphorus in
60 50 40 ~, ao 2 0 1 0 r i i i wt% P205 i i i i i 6 0 - - " - . - 5 O 2 O ~ = 3 3 0 0 cm-1 10 0.'5 1.10 115 210 215 wt% P205
Fig. 8. Variations in areas of individual bands in the OH stretch region relative to the total area of the envelope, ZA, as a function of wt% PaOy (and A/CNK, see Fig. 1 ).
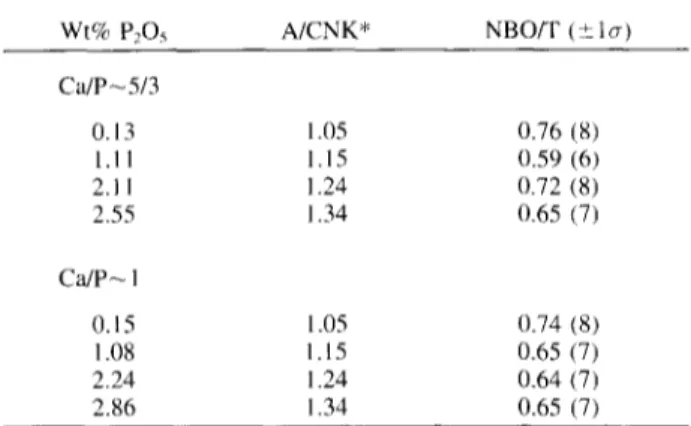
anhydrous depolymerized melts (Dupree et al., 1988, 1989; Mysen, 1992). The actual value of N B O / T contributing to the 900 cm -1 band intensity may be estimated with the method proposed by Mysen and Virgo (1986a). From such calculations, it would appear that solution of - 9 - 1 0 wt% H20 has increased the N B O / T from near 0 for anhydrous samples to about 0.7 in the hydrous glasses, a value similar to that of trisilicate glasses, for example. There is a 1 0 - 2 5 % decrease in this N B O / T - v a l u e as phosphorus is dissolved (Table 5).
The Raman band fitted near 9 7 0 - 9 7 5 cm ~ in the spectra of hydrous glasses, with composition-independent fre- quency, is assigned to Si-OH stretching (e.g., Stolen and Walrafen, 1976). The presence of Si-OH bonding in these glasses is also consistent with the band near 3650 cm -j in the high-frequency envelope (e.g., Fig. 7, see also Table 4) as OH stretch vibrations at this high frequency has not been associated with hydroxyl formation involving the other metal cations (A1, Ca, Na, K) in the present system (e.g., Aines and Rossman, 1984; Mysen and Virgo, 1986a,b). The dominant intensity in the 3 0 0 0 - 4 0 0 0 cm -~ range at lower frequency
0.16 0.14
~
0.12 0.10 0.08 O,Oe 0 I Ca/P-1 wt% P205 3Fig. 9. Relationship between phosphorus content (and A/CNK) the area of the 900 cm -1 band (Ag00) relative to the total area of bands assigned to vibrations not including OH (970 cm t) and P (1120 and 1210 cm 11. ZA = Ag00 + A~ooo + A~50 + A~:oo.
3922 B.O. Mysen et al.
Table 5. Calculated NBO/T from relative area of 900 cm ' band.
Wt% P205 A/CNK* NBO/T (+_ lo-)
Ca/P~5/3 0.13 1.05 0.76 (8) 1.11 1.15 0.59 (6) 2. I1 1.24 0.72 (8) 2.55 1.34 0.65 (7) Ca]P~ 1 O. 15 1.05 0.74 (8) 1.08 1.15 0.65 (7) 2.24 1.24 0.64 (7) 2.86 1.34 0.65 (7)
* Molar A12Ofl(CaO + Na20 + K20).
(e.g., Figs. 7, 8) is consistent with a significant fraction of the OH-groups bonded to metal cations other than Si 4+ (e.g., Mysen and Virgo, 1986b). This conclusion is also consistent with multinuclear NMR data of hydrous, highly polymerized aluminosilicate melts suggesting primarily alkali-OH inter- action (e.g., Kohn et al., 1992).
The three remaining bands in the high-frequency envelope is that near 940-950 cm ~ and those near 1120 and 1210 cm -~ (Fig. 6). The latter two bands are observed only when there is P in the system. It is suggested that the band fitted near 1120 cm l might be assigned to P-O-A1 stretching thus, in accord with Gan and Hess (1992), leading to the sugges- tion that phosphate complexing with A1 occurs in peralumi- nous glasses to form perhaps P-O-A1 linkages in a three- dimensional structure (see also Mysen et al., 1981 ).
The band near 1210 cm l will be interpreted with the aid of published Raman and 3~p NMR data (Chakraborty and Condrate, 1985; Kosinski et al., 1988; Dupree et al., 1989). In a vibrational spectroscopic study that included Raman data for Na20-SiO2-P205 glasses, Chakraborty and Condrate (1985) suggested that a band near 1180 cm l in their spectra could be assigned to coupled vibrations of Si-O and P-O stretching coordinates, Chakraborty and Condrate (1985) on this basis concluded that this was evidence for Si-O-P link- ages in their Na20-SiO2-P205 glasses. Kosinski et al. (1988) and Dupree et al. (1989) reported 31p NMR evidence for Si- O-P linkages in P-bearing alkali silicate and alkali alumino- silicate glasses. Additionally, Kosinski et al. (1988) sug- gested that Raman bands in the 1100-1250 cm ~ frequency range included vibrations due to Si-O-P linkages. Mysen et al. (1981) in a study of P-bearing NaA1Si30, and CaAI2 Si208 glasses suggested that a band near 1150 cm i reflected the presence of Si-O-P linkages in those materials. Although somewhat uncertain, we suggest that the band fitted near 1210 cm ' in the spectra of the present glasses also reflects the presence of Si-O-P linkages in the glasses studied here. This suggestion implies structural cross-linking between the phosphate and silicate portion of both the hydrous and anhy- drous, peraluminous aluminosilicate glasses.
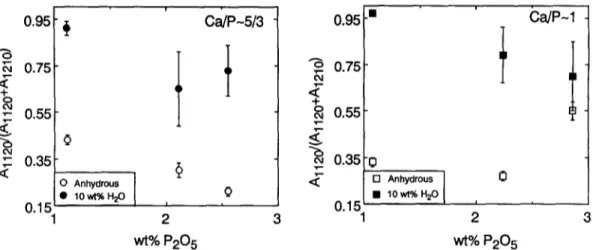
The area ratio, Aii20/(Al120 + Ai2m ), might be taken as a measure of the relative abundance of P-O-AI and P-O-Si linkages (although this abundance ratio cannot be quantified from the Raman spectra). From the much larger values of A~ 120/(Ai 120 + Al2m) in spectra of hydrous as compared with anhydrous samples (Fig. I 0) it follows that P-O-A1 linkages are more abundant in the hydrous than in the anhydrous P- bearing aluminosilicate glasses.
The 940 cm ~ band is significant only in the spectra of hydrous P-bearing samples (Table 3; see also Fig. 6). In these samples, its relative intensity is greater in the series of samples with lowest Ca/P (Table 3). This band could be assigned to P-O stretching in an orthophosphate ( P O ] ) unit (e.g., Nelson and Tallant, 1986; Mysen, 1992). The frequency, however, is about 20 cm L lower than that ob- served in many crystalline orthophosphates and also in spec- tra of other P-bearing glasses where independent spectro- scopic evidence indicates that orthophosphate complexes ex- ist (e.g., Nelson and Tallant, 1986; Dupree et al., 1988). Further, Raman spectra of CaO-SiO2-P205 and Na20-SiO2- P205 glasses show the band assigned to P-O stretching in orthosilicate units as a narrow band between 960 and 965 cm ' (Mysen, 1992, 1996). In the present system, with simi- lar metal cations, one would, therefore, expect the frequency to be near 960 cm L and not 940 cm l as observed. It should also be noted that despite this inconsistency, if the 940 cm band was due to P-O stretching in orthophosphate units in the hydrous samples, from a comparison of the intensity data from the system Na~O'9SiO2 (NBO/Si = 0.22) with 2 mol% P205 in solution with the present intensity relation- ships, it would be suggested that even in the most P-rich sample, only about 10% of the dissolved P:O5 would exist as orthophosphate,
An alternative interpretation may be related to the obser- vation above (e.g., Fig. 10) that the abundance of P-O-Si relative to P-O-A1 linkages decreases as H20 is dissolved in the glasses. This structural change might imply that P-O-Si oxygen bridges have been broken by H20. Such breakage could lead to formation of Si-OH and P-OH bonds (analo- gous to the breakage of Si-O-Si bridges to form two Si- OH bonds in SiO2-H20 glasses and melts; see, for example, Wasserburg, 1957; Stolen and Walrafen, 1976). It is possible that the 940 cm ~ might be assigned to an equivalent P-OH vibration.
In the study of Mysen and Virgo (1986b), the area of the band near 3500 cm ~ was found particularly sensitive to Ca/ Si ratio (in spectra of glasses along the join Ca(OH)2-SiO2), whereas the area of lower-frequency band, near 3300 cm t, appeared positively correlated with Na/Si (in spectra of glasses along the join NaOH-SiO2). This latter frequency region also, however, exhibits increased intensity with in- creasing abundance of molecular H20 so interpretation of the intensity variations in this region of spectra from the more complex aluminosilicate glasses should be conducted with caution. A band near 3600 cm ~ occurred in spectra of glasses along both the joins AI(OH)3-SiO2 and SiO~-H20 (Mysen and Virgo, 1986b). Relative intensity variations re-
Solution mechanism of P in granitic glass 3923 0.95 "8
0.75
,£
+ O 04,- 0.55
g
"--e, 00.35
<
O Anhydrous low~ H~0.15
1t
I
2wt% P205
0 ~ P - 5 / 3
0.95
0.75,£
+ 0.55 T-- 0.35,£
0.15
t
C~P-1
t
[] Anhydrous 10 w ~ H20 2 3wt% P205
Fig. 10. Relative intensities of the two bands assigned to P-O-AI (A~L,0) and P-O-S (A~_~u)) as a function of phosphorus content (and A/CNK) for hydrous (closed symbols) and anhydrous (open symbols) samples.
flecting possible variations in abundance of A1-OH and Si- OH bonding is, therefore, not feasible. It is tentatively sug- gested, however, that the intensity variations among the 3500 and 3300 cm ~ bands (Fig. 8) might reflect relative impor- tance of Ca-OH and alkali-OH bonding. If so, it appears Ca/ P ~ 5/3 series with increasing CaO and P205 content, Ca- OH bonding becomes more important relative to OH groups bonded to alkali metals. In the Ca/P ~ 1 series of glasses, this trend is less evident.
4. DISCUSSION
4.1. Solution Mechanism of Phosphorus in Anhydrous Peraluminous Glasses
The mechanism of incorporation of P in peraluminous glasses is first detailed for the dry compositions. The spectro- scopic data are interpreted to suggest that phosphorus is present in the two series of glasses studied primarily as AIPO4 species. There is also evidence for P-O-Si bonding thus suggesting cross-linking between the phosphate com- plexes and the aluminosilicate network. From Raman spec- troscopic data, the presence of phosphate units with double- bonded oxygen can be ruled out (they should appear as peaks at ~>1320 cm ~, e.g., Kosinski et al., 1988, and no Raman intensity was observed in this spectral range).
The A1 that participates in the formation of A1PO4 units may come from two distinct structural positions. One is where A13+ is charge-balanced with alkalis and possibly Ca. In one case, this mechanism results in the formation of non- bridging oxygen as illustrated with the following schematic equations (fl)r monovalent and divalent charge-balancing cations) :
2MTAISi,,Oz,,.2 + PzOs = 2A1PO4 + 2M+Si,,O:,,_3 (1)
Me+AI:Si,,O(2,,+41 + P:O5 = 2A1PO4 + M2+SinO(2,,+l) (2)
Toplis and Dingwell (1996) suggested an alternative mecha- nism to form AIPOa complexes where one may envision
exchange of alkalies (or alkaline earths) between charge- balanced A1 > and phosphate complexes:
M~AIO2 + P205 = A1PO4 + M'PO~ ( l a )
M2+AI2Oa + 2P2Os = 2A1POa + M2-(PO3)2 (2a)
In the case illustrated by Eqns. 1 and 2, P solution would involve the production of network modifiers (alkalis and Ca), resulting in depolymerization of the melt. This model would have a large influence on the framework structure, which is not observed in the Raman spectra. We, therefore, view this possibility as unlikely. An important implication of this observation is that P incorporation in these aluminosil- icate glass systems has little influence on the aluminosilicate network.
Phosphate complexing according to the mechanisms l a or 2a, or both, does not affect the NBO/T of the aluminosilicate network. However, in this mechanism the AI/(A1 + Si) of the aluminosilicate must decrease as phosphorus is dis- solved. This postulated decrease in AI/(AI + Si) will result in an increase in frequency of the (Si,AI)-O ° stretch vibra- tions near 1000, 1090, and 1160 cm ~ in the P-free glasses (Seifert et al., 1982; Neuville and Mysen, 1996) as P is dissolved. Such a frequency increase is not observed. Fur- ther, from a stoichiometric point of view, only metaphos- phate ( P O ) ) units can be formed without generating excess A1 which might result in additional nonbridging oxygen in the melts. The frequency of P-O stretching in PO3 units in crystalline NaPO3 is near 1165 cm J (Nelson and Tallant, 1986). There is no evidence for such a band in the Raman spectra. The mechanisms proposed by Toplis and Dingwell (1996) and illustrated with expressions la and 2a are not, therefore, consistent with the data.
An alternative is a conceptually similar model with the phosphate complexes less polymerized than that of PO3. Such a model can be illustrated with the expressions:
8M+A102 + 3P205
3924 B.O. Mysen et al.
3M +AIO2 + P205
= A1PO4 + MfPO4 + 2Al3+(excess) ( l c )
where A13+(excess) represents AI 3+ in excess of that for which alkali charge-compensation would be available. Anal- ogous expressions could be written with divalent cations (e.g., alkaline earths).
Mechanism lb is unlikely because P-O stretching in pyrophosphate units results in Raman bands near 1020 cm (Nelson and Tallant, 1985), which have not been observed in the spectra. Mechanism 1 c (orthophosphate complexing) will be considered in more detail because there is a very, very weak band near 940 cm f in the nominally anhydrous samples. By using the Raman data from Mysen (1996) for the purpose of estimating relations between Raman inten- sity and P concentration, with the <-0.5% of the intensity of the 940 cm -t band relative to the strongest band in the high-frequency envelope of the anhydrous samples, this intensity would correspond to -<0.5% of the total mount of dissolved P205 in the form of orthophosphate units. It would seem, therefore, that none of the mechanisms involving alkali or alkaline earth exchange between aluminate and phosphate are consistent with the Raman data for these glasses.
In the second possible case, P is structurally bonded with excess A13* present. This AI 3+ may be linked either to Si- or Al-bearing Q3 species, themselves connected to the network. This mechanism is consistent with the phosphorus solubility data of Wolf and London (1994), for example. In that study, it was observed that there was a 1:1 correlation between P solubility and A1 content whenever the P/A1 = 1. Phospho- rus incorporation in such glasses can then be described by the following homogeneous equilibrium:
\A]]I / / \ O O O O
I
I
II
II
- - O - - A 1 - - O - - S i - - O - - +- - P - - O - - P - -
[
[
I
[
O O O OI
I
I
I
AI:SiO5 + P205 O O - - O - - P - - O - - A 1 - - O - - O O = - - O - - A 1 - - O - - P - - O - - O O - - O - - S i - - O - - O A12P2SiOlo(3)
If some of the original excess AI 3÷ existed in a non- network-forming structural position, ~ the process involves an overall reduction of the NBO/T and the formation of
Q4
species, i.e., polymerization. The Q4 silicate tetrahedra and charge-balanced AIO4 tetrahedra forming the network re- main unaffected, implying that the structural roles of alkali and Ca do not need to be affected. The total amount of P present in our glasses can be incorporated completely with the above mechanism, because the amount of excess A13~ present exceeds the amount of phosphorus dissolved. This solution mechanism is consistent with the P diffusion data for quite similar bulk compositions in the same system as reported by Wolf and London (1994). Wolf and London (1994) found that there was no absolute or relative change in Na and K concentration in the apatite diffusion aureole compared with the original melt, which is exactly what would be expected from the structural model of P solution proposed here. In other words, the compositions are so AI- rich and peraluminous that there is no need to involve those A13+ atoms charge-balanced by alkalis or Ca 2~ and forming part of the network (see Table 1 ).If, in facL there is also interaction between P and charge- balanced AI~+, the structural scenario illustrated with Eqns. I and 2 requires consideration. Mechanisms l a,b,c and 2a will not be considered further for the reasons discussed above. In scenarios I and 2, nonbridging oxygen will be generated. Relevant Raman bands reflecting increasing depo- lymerization of the structure as P is dissolved cannot be discerned in the spectra although the sensitivity of the spectra of these samples to such structural features is somewhat difficult to establish quantitatively. A very conservative esti- mate of the sensitivity might be derived in the following manner. The Raman cross-sections of (Si,AI)-O stretch vibrations is on the order of 1 order of magnitude greater than those of (Si,AI)-O ° stretching vibrations in these sys- tems (e.g., Mysen, 1995). Therefore, if, for example, a sam- ple contained 5% of structural units containing nonbridging oxygen and 95% fully polymerized units, the Raman intensi- ties from the depolymerized units should be about 50% of the maximum intensity of the high-frequency envelope. This would be easily observed but was not detected in the spectra. A conservative estimate of sensitivity to nonbridging oxygen from this discussion is, therefore, 5% of the total.
4.2. The Role of H20 in P-Bearing Glasses
The spectroscopic information on hydrous, P-free glasses is consistent with solution of water via association with alka- lis or alkaline earths, possibly with A1, and probably with Si. There is also molecular water in the glasses. This conclu-
A1 ~ without charge-balance in tetrahedral coordination has been suggested to form tri-clusters where A13* actually also has 4 oxygen ligands (Lacy, 1963). Recently, it has also been suggested that in peraluminous melts, A13+ may reside in structural entities involving four-, five-, and six-fold coordination with oxygen ( Sato et al., 1991 ; Poe et al., 1992). For the present purposes, it is not necessary to know the exact structural position of A1 in peraluminous melts other than the fact that the A1 is not a part of the aluminosilicate glass and melt network.
Solution mechanism of P in granitic glass 3925
sion is consistent with previously suggested models for H20 solution mechanisms in alumino-silicate melts and glasses (e,g., Mysen and Virgo, 1986b; Silver et al., 1990; Kohn et al., 1992; Holtz et al., 1996).
The Raman spectra of
H20-
and P-bearing glasses differ from both the anhydrous, P-bearing and P-free anhydrous glasses in (1) the presence of a distinct Raman band near 940 cm J and (2) a considerably larger value of the area ratio, Aj ~20/(A~20 + A~2~0) (Fig. 10). The latter observation is consistent with greater relative abundance of P bonded as P-O-A1 relative to P-O-Si in hydrous relative to anhydrous P-bearing samples. The relative decline in abundance of Si- O-P bridges in hydrous samples may be due to replacement of the oxygen bridge with O H groups:O O - - O - - P - - O - - A I - - O - - O O - - O - - A 1 - - O - - P - - O - - O O - - O - - S i - - O - - O AI2P2SiOI0 H / + O \ H + H20 O O
I
- - O - - P - - O ~ A 1 - - O - -I
O OI
= - - O - - A I - - O ~ P - - O - -I
O O H O HI
- - O - - S i - - O - -I
OI
= A12P2SiO9(OH)2(4)
It is possible that the - 9 4 0 cm ~ band observed in the Raman spectra of hydrous, P-bearing samples might then be assigned to P-OH vibrations analogous to the 970 cm -l that is assigned to Si-OH stretching. Consequently, in this solu- tion model of water into P-bearing peraluminous glasses has the effect of isolating the A1PO4 complexes from the silicate network through the formation of P - O H bonds. A conse- quence of this solution model for P in hydrous peraluminous glasses is that most likely the solubility of H20 in P-beating melts would differ from that in the same melt without phos- phorus. Such an effect was demonstrated experimentally by W o l f and London (1994).5. CONCLUDING REMARKS
Raman spectra of peraluminous granitic glasses are con- sistent with A1-O-P bonding, perhaps in an AlPO4-type com- plex, being a principal solution mechanism of P. These com- plexes are linked with the silicate network over Si-O-P bridges. In hydrous systems, the Si-O-P bridges are broken and replaced with OH-groups attached to Si-OH and proba- bly P-OH. Therefore, the water content of peraluminous alu- minosilicate melts are likely to affect the solubility behavior of P, and conversely, the solubility behavior of H20 is af- fected by P in such melts.
Acknowledgments--A majority of this work was conducted while one of us (BOM) visited CNRS-CRSCM during the summer of 1994. The hospitality extended by CNRS is greatly appreciated. This work was partially supported by NSF grants EAR9218890 and EAR9614423 to BOM, by a grant from Centre National de la Re- cherce Scientifique through its Programme International de Coopera- tion Scientifique (PICS 192) and partially by the NSF-sponsored Center for High-Pressure Research (CHiPR). Critical reviews by M. Toplis, D. London, G. Morgan, and F. R. Ryerson improved the manuscript.
Editorial handling: D. B. Dingwell REFERENCES
Aines R. D. and Rossman G. R. (1984) Water in minerals? A peak in the infrared. J. Geophys. Res. 89, 4059-4071.
Behrens H. (1995) Determination of water solubilities in high-vis- cosity melts: An experimental study on NaAISi308 and KA1Si308 melts. Eur. J. Mineral. 7, 905-920.
Chakraborty I. N. and Condrate R. A. ( 1985 ) The vibrational spectra of glasses in the Na20-SiO2-P205 system with a 1:1 SIO2:P205 molar ratio. Phys. Chem. Glasses 26, 68-74.
Davidon W. C. (1966) Variable Metric Method for Minimization.
Argonne Natl. Lab. ANL 5990.
Dingwell D. B., Knoche R., and Webb S. L. (1993) The effect of P205 on the viscosity of haplogranite liquids. Eur. J. Mineral. 5,
133-140.
Dupree R., Holland D., and Mortuza M. G. (1988) The role of small amounts of P205 in the structure of alkali disilicate glasses. Phys. Chem. Glasses 29, 18-21.
Dupree R., Holland D., Mortuza J. A., Collins J. A., and Lockyer M. W. G. (1989) Magic angle spinning NMR of alkali phospho- alumino-silicate glasses. J. Non-Cryst. Solids 112, 111-119. Galeener F. L. (1982) Planar rings in glasses. Solid State Comm.
44, 1037-1040.
Gan H. and Hess P. C. (1992) Phosphate speciation in potassium aluminosilicate glasses. Amer. Mineral. 77, 495-506.
Hamilton, W. C. (1965) Significance of the crystallographic R-fac- tor. Acta Cryst. 18, 502-510.
Harrison T. M. and Watson E. B. (1984) The behaviour of apatite during crustal anatexis: Equilibrium and kinetic considerations.
Geochim. Cosmochim. Acta 48, 1468-1477.
Holtz F., Behrens H., Dingwell D. B., and Johannes W. (1995) H20 solubility in haplogranitic melts: Compositional, pressure, and temperature dependence. Amer. Mineral. 80, 94-108.
Holtz F., Beny J.-M., Mysen B. O., and Pichavant M. (1996) High- temperature Raman spectroscopy of silicate and aluminosilicate hydrous glasses: Implications for water speciation. Chem. Geol.
128, 25-39.
Kohn S. C., Dupree R., and Smith M. E. (1989) A nuclear magnetic resonance study of the structure of hydrous albite glasses. Geo- chim. Cosmochim. Acta 53, 2925-2935.
Kohn S. C., Dupree R., and Mortuza M. G. (1992) The interaction between water and aluminosilicate magma. Chem. Geol. 96, 399- 410.
3926 B.O. Mysen et al.
Chesney J. B., and Simpson J. R. (1988) Raman and NMR spec- troscopy of SiO2 glasses co-doped with A1203 and P205. J. Non- Cryst. Solids 105, 45-52.
Kushiro I. ( 1975 ) On the nature of silicate melt and its significance in magma genesis: Regularities in the shift of the liquidus boundaries involving olivine, pyroxene, and silica minerals. Amer. J. Sci. 275, 411-431.
Lacy E.D. (1963) Aluminum in glasses and melts. Phys. Chem. Glasses 4, 234-238.
London D. (1987) Internal differentiation of rare element pegma- rites: Effects of boron, phosphorus and fluorine. Geochim. Cos- mochim. Acta 51, 403-420.
London D., Morgan G. B., VI, Babb H. A., and Loomis J. L. (1993) Behavior and effects of phosphorus in the system NazO-K:O- AI203-SiOa-P2Os-HzO at 200 MPa (H20). Contrib. Mineral Pet- rol. 113, 450-465.
Long D. A. (1977) Raman Spectroscopy. McGraw-Hill.
Mammone J. F., Sharma S. K., and Nicol M. F. (1981) Ring struc- tures in silica glass--A Raman spectroscopic investigation. EOS
62, 425.
Matson D. W., Sharma S., and Philpotts J. A. (1986) Raman spectra of some tectosilicates and glasses along the orthoclase-anorthite and nepheline-anorthite joins. Amer. Mineral. 71, 694-704. McMillan P. F., Poe B. T., Stanton T. R., and Remmele R. L. ( 1993 )
A Raman spectroscopic study of H/D isotopically substituted hy- drous aluminosilicate glasses. Phys. Chem. Minerals 19, 454~-59. Mysen B.O. (1992) Iron and phosphorus in calcium silicate
quenched melts. Chem. Geol. 98, 175-202.
Mysen B. O. (1995) Structural behavior of AI ~+ in silicate melts: In situ, high-temperature measurements as a function of bulk chemical composition. Geochim. Cosmochim. Acta 59, 455-474. Mysen B. O. (1996) Phosphorus speciation changes across the glass transition in highly polymerized alkali silicate glasses and melts.
Amer. Mineral. 81, 1531-1534.
Mysen B. O. and Frantz J. D. (1992) Raman spectroscopy of silicate melts at magmatic temperatures: Na20-SiO2, K20-SiO2, and Li20-SiO2 binary compositions in the temperature range 2 5 - 1475°C. Chem. Geol. 96, 321-332.
Mysen B. O. and Frantz J. D. (1994) Structure of haplobasaltic liq- uids at magmatic temperatures: In situ, high-temperature study of melts on the join Na2Si 205-Na2 (NaA1)202. Geochim. Cosmochim. Acta 58, 1711-1733.
Mysen B.O. and Virgo D. (1986a) Volatiles in silicate melts at high pressure and temperature 2. Water in melts along the join NaAIO2-SiO2 and a comparison of solubility mechanisms of water and fluorine. Chem. Geol. 57, 333-358.
Mysen B.O. and Virgo D. (1986b) Volatiles in silicate melts at high pressure and temperature. 1. Interaction between OH groups and Si 4*, A1 ~+, Ca 2+ , Na + and H + . Chem. Geol. 57, 303-331. Mysen B. O., Virgo D., Harrison W. J., and Scarfe C. M. (1980)
Solubility mechanisms of H20 in silicate melts at high pressures and temperatures: A Raman spectroscopic study. Amer. Mineral
65, 900-914.
Mysen B. O., Ryerson F. J., and Virgo D. ( 1981 ) The structural role of phosphorous in silicate melts. Amer. Mineral 66, 106-117. Mysen B.O., Finger L.W., Seifert F.A., and Virgo D. (1982)
Curve-fitting of Raman spectra of amorphous materials. Amer. Mineral. 67, 686-696.
Nelson C. and Tallant D. R. (1984) Raman studies of sodium silicate glasses with low phosphate contents. Phys. Chem. Glasses 25, 31-39.
Nelson C. and Tallant D. R. (1986) Raman studies of sodium phos- phates with low silica contents. Phys. Chem. Glasses 26, 119-122. Neuville D. R. and Mysen B. O. (1996) Role of aluminum in the silicate network: In situ, high-temperature study of glasses and melts on the join SiO2-NaAIO> Geochim. Cosmochim. Acta 60,
1727-1738.
Pichavant M. (1987) Effects of B and H20 on liquidus phase rela- tions in the haplogranite system. Amer. Mineral. 72, 1056-170. Pichavant M., Montel J.-M., and Richard L. (1992) Apatite solubil-
ity in peraluminous liquids: Experimental data and an extension
of the Harrison-Watson model. Geochim. Cosmochim. Acta 56, 3855-3861.
Poe B.T., McMillan P.F., Cote B., Massiot D., and Coutoures J.-P. (1992) SIO2-A1203 liquids: In situ study by high-temperature 27A1 NMR spectroscopy and molecular dynamics simulations. J.
Phys. Chem. 96, 8220-8224.
Remmele R., Stanton T., McMillan P. F., and Holloway J. R. (1986) Raman spectra of hydrous glasses along the quartz-albite join.
EOS 67, 1274.
Revesz A.G. and Walrafen G. E. (1983) Structural interpretation of some of the Raman lines from vitreous silica. J. Non-Cryst. Solids 54, 323-355.
Richard L. R., Pichavant M., Clarke D. B., and Montel J.-M. (1992) Effects of temperature, composition, a n d f 02 on apatite solubility and phosphorus behaviour in peraluminous granitic melts. V. M. Goldschmidt Conf., Reston, A-90. (abstr.)
Roux J., Holtz F., Lefevre A., and Schulze F. (1994) A reliable high-temperature setup for internally-heated pressure vessels: Ap- plication to silicate melt studies. Amer. Mineral. 79, 1145-1150. Ryerson F.J. and Hess P.C. (1980) The role of P205 in silicate
melts. Geochim. Cosmochim. Acta 44, 611-624.
Sato R. K., McMillan P. F., Dennison P., and Dupree R. (1991) A structural investigation of high alumina glasses in the CaO-A1203- SiO2 system via Raman and magic angle spinning nuclear mag- netic resonance spectroscopy. Phys. Chem. Glasses 32, 149-160. Seifert F. A., Mysen B. O., and Virgo D. (1982) Three-dimensional network structure in the systems SiO2-NaA102, SiO2-CaAI204, and SiO2-MgAI204. Amer. Mineral. 67, 696-711.
Seifert F. A., Mysen B. O., and Virgo D. (1983) Raman study of densified vitreous silica. Phys. Chem. Glasses 24, 141-145. Silver L. and Stolper E. (1989) Water in albitic glasses. J. Petrol.
30, 667-710.
Silver L., Ihinger P. D., and Stolper E. (1990) The influence of bulk composition on the speciation of water in silicate glasses. Contrib. Mineral. Petrol. 104, 142-162.
Stolen R. H. and Walrafen G. E. (1976) Water and its relation to broken bond defects in fused silica. J. Chem. Phys. 64, 2623- 2631.
Stolper E. (1982) The speciation of water in silicate melts. Geochim. Cosmochim. Acta 46, 2609-2620.
Toplis M. J. and Dingwell D. W. (1996) The variable influence of P205 on the viscosity of melts of differing alkali/aluminum ratio: Implications for the structural role of phosphorus insilicate melts.
Geochim. Cosmochim. Acta 60, 4107-4121.
Toplis M. J., Dingwell D. B., and Libourel G. (1994a) The effect of phosphorus on the iron redox ratio, viscosity, and density of an evolved ferro-basalt. Contrib. Mineral. Petrol. 117, 293-304. Toplis M. J., Libourel G., and Carroll M. R. (1994b) The role of
phosphorus in crystallization processes of basalt: an experimental study. Geoehim. Cosmochim. Acta 58, 797-810.
Vielzeuf D. and Montel J. M. (1994) Partial melting of metagrey- wackes. Part I. Fluid-absent experiments and phase relationships.
Contrib. Mineral. Petrol. 117, 375-393.
Visser W. and Koster Van Groos A. F. (1979) Effects of P205 and TiO~ on liquid-liquid equilibria in the system K20-FeO-AI20~- SIO2. Amer. J. Sci. 279, 970-988.
Wasserburg G. J. (1957) The effects of HzO in silicate systems. J.
Geol. 65, 15-23.
Watson E. B. (1976) Two-liquid partition coefficients: experimental data and geochemical applications. Contrib. Mineral. Petrol. 56,
119 134.
Watson E. B. and Capobianco C. J. ( 1981 ) Phosphorus and the rare- earth elements in felsic magmas: an assessment of the role of apatite. Geochim. Cosmochim. Acta 45, 2349-2358.
Wolf M. B. and London D. (1994) Apatite dissolution into peralumi- nous granitic liquids: An experimental study of solubilities and mechanisms. Geochim. Cosmochim. Acta 58, 4127-4145. Wyllie P. J. and Tuttle O. F. (1964) Experimental investigation of
silicate systems containing two volatile components. 111. The ef- fects of SO3, P205, HCI, and Li20 in addition to H20 on the melting temperatures of albite and granite. Amer. J. Sci. 262, 930- 939.