CHARACTERISATION OF INTERCITY BUS TRAVEL DEMAND IN QUEBEC
TINGTING ZHANG
DÉPARTEMENT DES GÉNIES CIVIL, GÉOLOGIQUE ET DES MINES ÉCOLE POLYTECHNIQUE DE MONTRÉAL
MÉMOIRE PRÉSENTÉ EN VUE DE L’OBTENTION DU DIPLÔME DE MAÎTRISE ÈS SCIENCES APPLIQUÉES
(GÉNIE CIVIL) JUIN 2017
ÉCOLE POLYTECHNIQUE DE MONTRÉAL
Ce mémoire intitulé :
CHARACTERISATION OF INTERCITY BUS TRAVEL DEMAND IN QUEBEC
présenté par : ZHANG Tingting
en vue de l’obtention du diplôme de : Maîtrise ès sciences appliquées a été dûment accepté par le jury d’examen constitué de :
M. CHAPLEAU Robert, Ph. D., président
Mme MORENCY Catherine, Ph. D., membre et directrice de recherche M. FAROOQ Bilal, Ph. D., membre et codirecteur de recherche
DEDICATION
“Measurement alone does not yield good data, it requires rigour. Data alone is not information, it requires interpretation. Information alone is not knowledge, it requires context. Knowledge alone does not yield results, it requires action.” Hall Kassoff
ACKNOWLEDGEMENTS
I would like to express my sincere gratitude to my supervisor Catherine Morency and co-supervisor Bilal Farooq who have guided me through the project and helped with both criticism and inspiration. It has been an honor to be their student. I appreciate all of their time, guidance, advice, and invertible suggestions they contributed throughout this research project.
I am especially grateful to my colleagues and friends Anae Sobhani, Kinan Bahbouh, Hamzeh Alizadeh, Nicolas Pele, Jerome Laviolette, Gabriel Lefebvre-Ropars, Philippe Gaudette, Jean-Simon Bourdeau, and all the others in my office. Each has given me valuable suggestions and technical assistance during our discussions.
Furthermore, I am very thankful for the Quebec Bus Carriers Federation and six private bus carriers: Breton, Galland, Intercar, Maheux, Keolis, and Transdev who are partners in this research project. They made this research possible by providing the necessary information and data. Finally, I would like to thank my family for their great support and continuous encourage. I owe the greatest thanks to my loving husband and our dear child, they are the greatest joy in my life.
RÉSUMÉ
Les autocars interurbains jouent un rôle essentiel pour les déplacements interurbains dans le domaine du transport public. En effet, les autocars offrent plusieurs avantages. Tout d’abord, ils sont potentiellement flexibles au niveau de l’établissement des horaires de service. Ensuite, ils peuvent être opérés à l’aide d’une infrastructure nécessitant des investissements relativement modestes comparativement aux modes par rail et aériens, tout en tenant compte de la grande couverture spatiale offerte. Le transport par autocars au Québec est opéré par des entreprises privées qui doivent évidemment rentabiliser leurs opérations. Le service de transport par autocars est apparu dans les années 1920 comme un complément au service ferroviaire. Un système de permis fédéral en termes d’accès au marché, de prix et de sécurité a été mis en place dans les années 1930 et ces régulations existent encore à ce jour. Cette industrie s’est grandement développée entre les années 1940 et 1980, en raison des restrictions d’essence au cours de la deuxième guerre mondiale, de la reprise économique et de l’emploi après la guerre, ainsi que de la forte croissance démographique due à un pic de natalité communément appelé « baby-boom ». Or, depuis les années 1980, l’industrie démontre une baisse de l’achalandage liée à une réduction de la demande. Celle-ci s’explique notamment par l’exode rural, les régimes économiques rigoureux, la concurrence exercée par les autres modes de transport traditionnels comme le train, l’avion et la voiture privée, mais aussi par celle exercée par de nouveaux modes de transport tel que le covoiturage. Le modèle d’inter-financement, selon lequel les routes non rentables sont financées partiellement par les routes plus rentables, reste limité. Les opérateurs entendent agir du côté de solutions diverses, notamment avec la mise en place du service d’autobus nolisé ou du service de livraison des colis. Ils répondent également à l’offre des modes concurrentiels avec la promotion de tarifs et de nouveaux systèmes de réservation en ligne. Pourtant, il existe très peu de recherche dans ce secteur au Québec ou même au Canada malgré les défis importants qu’il représente. La recherche présentée dans ce mémoire comporte deux objectifs principaux. Le premier vise à élaborer des indicateurs appropriés pouvant être utilisés pour évaluer la performance des réseaux interurbains selon deux points de vue : celui de l’opérateur et celui du voyageur. L’autre objectif est de mieux comprendre les comportements d’utilisation du système par les voyageurs.
Le premier point abordé consiste en une revue de littérature visant à clarifier les notions de déplacements urbains et interurbains. Il n’y a que deux catégories de territoires en Amérique du
Nord : les zones urbaines et les zones rurales. Les banlieues sont des zones qui se situent à l’extérieur des centres-villes mais à une distance raisonnable du lieu de travail. Ainsi, les zones de banlieue appartiennent à des zones urbaines. Actuellement, certaines zones rurales ou régions éloignées sont desservies par des autocars interurbains. Ces services ne sont généralement pas rentables et sont subventionnés par d’autres lignes profitables. Ensuite, les caractéristiques de ces deux types de déplacement sont comparées en termes de motif de déplacement, de fréquence de déplacement et de système billettique selon les études précédentes. Les résultats obtenus dans la recension des écrits révèlent que les voyages urbains servent principalement pour les activités de subsistance telles que le travail et les études, alors que les voyages interurbains sont réalisés principalement pour les motifs loisirs et les affaires. Une grande proportion (38%) de personnes n’utilise pas le service interurbain alors que seulement 12% de la population est immobile. La fréquence des déplacements interurbains est également plus faible que celle des déplacements urbains (4-9 voyages/année contre 2-4 voyages/jour). D’autre part, le prix du billet et l’élasticité du prix sont plus élevés pour les déplacements interurbains. On recommande aux passagers d’autocars interurbains de réserver leurs billets en avance et de faire des modifications ou d’annuler selon les conditions associées aux billets. Par ailleurs, les différentes composantes du temps de voyage (temps d’accès, temps d’attente, temps dans le véhicule et temps de transfert) ne sont pas prises en considération de la même façon pour ces deux types de déplacement, l’importance du temps d’accès diminuant avec une distance plus longue. De plus, il est primordial de générer un temps de transfert approprié plutôt que de simplement chercher à le minimiser. La procédure de sélection des indicateurs de performance est aussi illustrée : identification des intervenants associés (la réglementation assurée par le système de permis, les opérateurs ainsi que les passagers dans l’industrie de transport interurbain par autocars), définition des objectifs par catégories, collecte des données, élaboration d’un traitement des données, calcul des divers indicateurs et analyse des résultats. Les données de vente pour les voyages interurbains ont plusieurs avantages par rapport aux données de carte à puce collectées dans le contexte urbain : les informations sur l’origine et la destination des voyages sont disponibles, il existe peu de données suspectes et les billets personnalisés sont non-transférables. Pourtant, les études sur les voyages interurbains basées sur les données de ventes sont assez peu comparées aux nombreuses études menées en zones urbaines avec les données de cartes à puce. Certaines de ces expériences peuvent être appliquées aux déplacements interurbains, incluant notamment l’extraction du voyage complet à partir des
segments de voyage, l’identification de la station de transfert, la mesure de la performance du réseau et l’analyse des comportements de voyage des passagers.
Deux sources principales de données sont utilisées dans cette recherche : la base de données sur les ventes de billets en avril 2016 fournie par l’opérateur Keolis et le fichier GTFS (General Transit Feed Specification) décrivant l’offre de service à l’échelle provinciale développée dans un travail précédent. Divers concepts et catégories de déplacement sont décrits. La méthodologie employée est divisée en deux étapes : le développement des outils de traitement de données et le calcul des divers indicateurs de performance tant pour l’opérateur que pour le client. Un outil est utilisé pour générer le tableau de matrice Origine-Destination (O-D) et le profil de charge. Un autre outil aide à identifier les segments de voyage et les voyages complets à partir de la base de données des ventes. Ces deux outils permettent ainsi d’obtenir différents types de déplacement. Les indicateurs de mesure de performance sont sélectionnés en tenant compte de la relation avec la demande, des perspectives de l’opérateur et du passager, et de la disponibilité des données. Six indicateurs basés sur les segments de voyages ont été appliqués au niveau des arrêts, des liens, des lignes et du système entier pour mesurer la performance d’un réseau actuel du point de vue des opérateurs. Ces six indicateurs sont : l’achalandage, les passagers-kilomètres, le rapport entre le nombre de véhicules maximal et le nombre de véhicules minimal, le nombre de voyageurs transportés par véhicule-heure, le nombre de passagers par véhicule et le taux d’occupation. Trois indicateurs basés sur les voyages complets sont utilisés pour mesurer le réseau actuel du point de vue des passagers. Ces trois indicateurs incluent le temps de voyage, le pourcentage de trajets nécessitant des correspondances et le temps de correspondance. Les profils spatio-temporels des comportements des passagers sont illustrés pour différents types de voyages basés sur le nombre de transferts (voyages directs, voyages avec un seul transfert et voyages avec transferts multiples) ou sur le type de trajet (voyages aller simple, voyages aller-retour avec nuitée et voyages aller-retour sans nuitée). La caractérisation du territoire et du service est illustrée quant à la variabilité des nombres de montées quotidiennes. La demande de déplacements interurbains présente une forte variation temporelle durant la semaine qui peut être divisée en trois catégories : les jours de pointe comprennent les vendredis et les dimanches, les jours hors pointe incluent le reste de la semaine et les jours fériés. Une demande plus élevée a été observée pendant les jours fériés (plus du double) et les jours de pointe (50% de plus) comparés aux jours hors-pointe. Des variations spatiales sont aussi visibles entre les réseaux régionaux qui relient des villes de différentes tailles et les réseaux
de base qui relient des villes de taille similaire. La plupart des passagers se rendent dans les grandes villes, alors qu’il y a beaucoup moins de déplacements entre les petites villes. Ainsi, une différence significative des embarquements existe entre les stations terminales et les stations intermédiaires pour les lignes qui appartiennent au réseau régional. Au contraire, les passagers sont plus dispersés entre chaque station intermédiaire sur les lignes qui font partie du réseau de base.
En évaluant l’analyse au niveau de l’arrêt, on constate que la demande de déplacement interurbain actuelle est principalement localisée dans les grandes villes du Québec (Montréal, Québec (Centre-Ville), Québec (Sainte-Foy), Québec (Université de Laval) et Rimouski). Les dix plus grandes villes génèrent au total 78% des offres, mais partagent 92% de la totalité des demandes. Grande-Vallée, Mont-Louis, Matapédia et Montréal (métro Radisson) sont les arrêts les moins efficaces avec moins d’un passager par départ à la fois pour les jours de pointe et les jours hors pointe. Le nombre de débarquements à Longueuil est égal à 10% du nombre total de débarquements à Montréal en jours de pointe alors qu’il est 2 fois plus élevé en jours hors-pointe. Ce changement de proportion implique que les destinations finales des passagers sont probablement différentes. En comparant les volumes de passagers avec la population des villes, on constate que les services d'autobus interurbains sont plus attrayants pour les villes situées dans le nord du Québec avec une faible population, comme Carleton, Rivière-du-Loup et Rimouski. A l’inverse, les services d'autobus interurbains sont moins attrayants pour les villes localisées près de Montréal et de Québec, telles que Laval, Repentigny et Lévis.
Les liens et les lignes qui desservent les grandes villes ont en général un niveau de performance plus élevé que celles qui desservent les petites villes en termes de nombre de passagers et d’occupation. La ligne Express Montréal – Québec représente ainsi 60% de l’achalandage du réseau Keolis. Le plus grand nombre d’embarquements est observé à 15h00 pour aller de Montréal à Québec et à 12H30 pour le trajet retour (de Québec à Montréal). Une grande proportion de ces passagers part de ou se destine à Rimouski, ce qui leur oblige une correspondance à Québec. Il existe une différence significative d’achalandage sur les deux portions de la ligne Montréal – Trois Rivières – Québec et la ligne Québec – Rivière-du-Loup – Rimouski, mais l’occupation de la ligne Montréal – Trois Rivières – Québec est plus faible même si ces deux lignes ont des achalandages similaires. Deux raisons peuvent expliquer cette différence. La première est que les passagers ne font typiquement pas le trajet complet Montréal-Québec sur la ligne Montréal – Trois Rivières – Québec parce que la ligne Express Montréal – Québec est plus rapide pour relier ces deux points.
Ceux qui l’empruntent se destinent ou embarquent à un point intermédiaire. La deuxième est qu’il n’y a pas le même nombre de départs sur les deux portions Québec – du-Loup et Rivières-du-Loup – Rimouski.
Au niveau des passagers, 85% des voyages interurbains sont réalisés par des lignes directes avec une durée moyenne de déplacement de 2,7 heures et 14% des voyageurs ont une durée moyenne de déplacement de 5,9 heures avec un seul transfert. Le temps de transfert moyen est de 33 minutes pour les voyages avec un seul transfert et de 91 minutes pour les voyages avec plus d’un transfert. Seulement 1% des passagers ont plus d’un transfert à effectuer et leur temps de voyage augmente avec le nombre de transferts. Les lignes de désirs (O-D) démontrent que les corridors ayant une forte demande sont l’aéroport de Montréal – Montréal – Québec – Rivières-du-Loup – Rimouski corridor, Québec – Chicoutimi, Montréal – Trois-Rivières et Montréal – Drummondville. Montréal, Québec (Sainte-Foy), Rimouski et Québec (Centre-Ville) sont les quatre stations les plus importantes qui représentent 90,6% des passagers de transfert au total. Les proportions de déplacements aller simple, aller-retour avec nuitée et sans nuitée sont respectivement de 62%, 32% et 6%. Les voyages aller simple et aller-retour avec nuitée présentent des comportements similaires. La seule différence est que le plus grand nombre d’embarquements quotidien est observé le vendredi pour les déplacements aller simple alors qu’il est le dimanche pour les déplacements aller-retour avec nuitée. Les voyages aller-aller-retour sans nuitée ont des comportements différents. Les gens partent le matin et rentrent le soir tandis que les plus grands nombres d’embarquements quotidiens sont observés du mercredi au vendredi. La plupart des passagers ont une heure de départ et une heure de retour plus tardives le samedi et le dimanche par rapport aux jours ouvrables. Le plus grand nombre de déplacements aller simple ou aller-retour avec nuitée a lieu pendant les fins de semaine avec une durée d’activité de 1 à 2 jours, tandis que les déplacements aller-retour sans nuitée ont principalement lieu en semaine avec une durée d’activité de 3 à 10 heures.
À l’aide des données de vente, il est aussi possible d’obtenir d’autres analyses sur les comportements des passagers. Par exemple, 87% des clients qui se sont inscrits sur le web ou à partir d’un cellulaire ne réservent un billet qu’une seule fois par mois et seulement 8% des clients réservent deux fois par mois. 91% des passagers interurbains ne réservent que pour une seule personne et 8% des passagers réservent pour un groupe de deux personnes. 21% des passagers ont modifié ou annulé leurs billets durant la tempête de neige contre 10% lors d’une journée typique. 68% des voyageurs aller simple réservent leurs billets le même jour que leur départ. 67% des
passagers réservent leurs billets avec un agent et 32% les réservent en ligne. Il n’y a que 1% des passagers qui téléchargent l’application mobile pour réserver leurs billets. Néanmoins, en utilisant le Web ou le cellulaire pour réserver, les utilisateurs ont une plus grande probabilité d’abandonner ou de changer leurs réservations.
Les résultats démontrent que l’utilisation des données liées aux ventes de billets pour estimer la performance d’un réseau et pour mieux comprendre les comportements des voyageurs est une approche pertinente pour fournir des informations utiles aux opérateurs. Les limites de cette recherche sont, d’une part, l’estimation des distances itinéraires avec les chemins les plus courts, ainsi que le calcul des temps de voyage et des temps de transfert avec les horaires d’autocars qui peuvent être différents de la réalité. D’autre part, le temps par défaut utilisé pour identifier les stations de transferts dans les voyages complets semble arbitraire. La conclusion souligne aussi des recommandations pour de futurs développements dans la planification et l’opération des transports interurbains.
ABSTRACT
Intercity bus services play a key role in Canadian intercity public transportation due to their potential flexibility in scheduling, large spatial coverage, and relatively low infrastructure investment compared to rail and air transportations. The intercity bus industry in Quebec is made up of private companies whose business models endeavor to maximize their profits. This industry, however, is in decline with an obvious and continuous demand reduction since the 1980s due to the rural exodus, competition from other modes, and strict economic regimes. To better cope with the competition arising from other modes, such as train, low-cost flights, and emerging services like carpooling, the operators are committed to service improvement.
The objective of this research is twofold. The first objective aims at developing suitable indicators in terms of demand that can be used to evaluate the performance of intercity bus system in both operator’s and passenger’s perspectives. Another objective is to better understand the trip patterns made by intercity bus passengers.
The literature review clarified the definitions of intercity travels, and compared intercity travels with urban travels. Studies on intercity travels with their sales database are quite limited compared to the numerous studies conducted in urban areas with smartcard database. In this study, some of these urban research experiences are applied to intercity travels, specifically includes passenger trip extraction from trip segments, transfer station identification, transit performance measurement, and passenger travel pattern analysis. The procedure of performance measurement and studies on different components of travel times are also discussed.
Two main data sources are used: sales database at the time of April 2016 provided by the intercity carrier Keolis and General Transit Feed Specification (GTFS) that integrates the supply of six main carriers. A multi-step methodology in order to extract trips from trip segments of the intercity sales database is demonstrated. Performance measure indicators are selected considering demand relationship, operator’s and passenger’s perspectives, and data availability. Six indicators (ridership, passenger kilometers, peak-to-base ratio, productivity, passenger load, and demand to capacity ratio) are implemented at respectively stop, link, line, and system level to measure the performance of intercity bus network from operator’s perspective based on trip segments. Three indicators (total scheduled travel time, the percentage of trips requiring transfers, and scheduled
transfer time) are implemented to measure the performance of the network from the passenger’s perspective based on passenger trips. Other spatial-temporal patterns of passenger travel are illustrated for both transfer-based trips (direct trips, trips with one transfer, and trips with multi-transfers) and journey type based trips (one-way trips, multi-day trips, and same-day round-trips).
Results show that intercity travels of Keolis’ passengers have high temporal variations over one week. Three types of days can be derived: peak days (Fridays and Sundays), off-peak days (the rest of the week), and holidays or event days. The average daily ridership is 50% higher on peak days and more than doubled on holidays compared to off-peak days. The intercity travel demand by bus is mainly between large cities in Quebec. The ten most frequently served cities occupy 78% of total supply but share 92% of the total demand. There is a significant ridership difference between the two sections of Line Montreal – Trois-Rivières – Quebec and Line Quebec – Rivière-du-Loup – Rimouski. The volume to capacity ratio of Line Montréal – Trois Rivières – Québec is lower than Line Québec – Rivière-du-Loup – Rimouski even though these two lines have similar ridership. Two reasons can explain this difference. The first is that passengers generally do not take the whole journey from Montreal to Quebec with Line Montréal – Trois Rivières – Québec because the Express Line Montreal – Quebec is faster. The second is that the number of departures are different for the two sections of Line Québec – Rivière-du-Loup – Rimouski. 85% of intercity travel trips are realized by direct services with an average of 2.7 hours of travel time. About 14% of intercity bus passengers have one transfer with an average of 5.9 hours of travel time and 33 minutes of scheduled transfer time. The proportions of one-way trips, multi-day round-trips, and same-day round-trips are 62%, 32%, and 6% respectfully. One-way trips and multi-day round-trips have similar patterns, which is totally different from same-day round-trip patterns. 41% of one-way trips and 44% of multi-day round-trips are taken on peak days. 60% of multi-day round-trip passengers stay 1-3 days at their destinations, of which the highest proportion leave on Fridays. 84% of the same-day round-trip passengers stay for 3-10 hours at their destinations, of which the highest proportion leave on weekdays. 87% of the registered clients only order once within one month, and 91% of intercity bus passengers buy tickets for a single person. The obtained results confirm that the use of sales database to estimate intercity bus performance measures and to better understand their passenger trip patterns can provide useful information to operators.
TABLE OF CONTENTS
DEDICATION ... III ACKNOWLEDGEMENTS ... IV RÉSUMÉ ... V ABSTRACT ... III TABLE OF CONTENTS ... V LIST OF TABLES ... IX LIST OF FIGURES ... X LIST OF SYMBOLS AND ABBREVIATIONS ... XIVCHAPTER 1 INTRODUCTION ... 1
1.1 History of intercity bus in Quebec ... 1
1.2 Problem statement ... 3
1.3 General research context ... 5
1.4 Research objective ... 5
1.5 Dissertation organization ... 6
CHAPTER 2 LITERATURE REVIEW ... 8
2.1 Intra-city vs Inter-city bus systems ... 8
2.1.1 Definition of intra-city and inter-city travels ... 8
2.1.2 Intra-city trips and Inter-city trips ... 10
2.1.3 Intra-city bus and Inter-city bus ... 12
2.2 Intercity bus performance measures ... 13
2.2.1 Performance measures for different components of the transport system ... 14
2.2.2 Methodology of performance measures ... 15
2.3 Components of travel time ... 33
2.3.1 Access and egress ... 34
2.3.2 Waiting ... 34 2.3.3 In-vehicle ... 35 2.3.4 Transfer ... 36 2.4 Concluding remarks ... 39 CHAPTER 3 METHODOLOGY ... 40 3.1 Flow diagram ... 40 3.2 Source of data ... 41
3.2.1 General description of datasets ... 41
3.2.2 Description of Keolis’ sales database ... 42
3.2.3 Dataset used ... 45
3.3 Definition ... 46
3.3.1 Trip related definitions ... 46
3.3.2 Transfer related definitions ... 50
3.4 Data processing ... 53
3.5 Performance measure indicators ... 56
CHAPTER 4 PERFORMANCE MEASURES: OPERATOR’S PERSPECTIVE ... 61
4.1 The intercity bus network of Keolis ... 61
4.2 Spatial-temporal fluctuations of the service use ... 62
4.2.1 Temporal fluctuations ... 62
4.2.2 Spatial fluctuations ... 64
4.2.3 Remarks ... 69
4.3.1 System performance measure report ... 69
4.3.2 Stop level performance measures ... 71
4.3.3 Link level performance measures ... 79
4.3.4 Line level performance measures ... 85
4.4 The analysis of the main Express Montreal - Quebec corridor ... 91
4.5 Highlights of performance measures from operator’s perspective ... 99
CHAPTER 5 PERFORMANCE MEASURES: PASSENGER’S PERSPECTIVE ... 101
5.1 Intercity bus system passenger measure ... 101
5.1.1 General passenger performance measure report ... 101
5.1.2 Passenger travel time ... 102
5.1.3 Passenger O-D desire lines ... 105
5.1.4 Passenger transfer ... 110
5.2 Passenger trip patterns ... 118
5.2.1 Journey type based trip division ... 118
5.2.2 Departure time ... 119
5.2.3 Duration of stay ... 122
5.2.4 Total travel time ... 125
5.3 Other service use patterns related to sales database ... 129
5.3.1 Frequency of orders ... 129
5.3.2 Accompaniment ... 130
5.3.3 Weather effects ... 131
5.3.4 Cost ... 132
5.3.5 Order ... 137
CHAPTER 6 CONCLUSION ... 140 6.1 Summary ... 140 6.2 Contribution ... 140 6.3 Limit ... 141 6.4 Perspective ... 142 BIBLIOGRAPHY ... 144
LIST OF TABLES
Table 2.1: Definitions of the components of transport system in both general context and intercity
travel context ... 14
Table 2.2: Output measure categories for peer comparison (TCRP Report 141, 2010) ... 23
Table 2.3: Categories of performance measurement and potential source of data (TCRP Report 88, 2003; TCQSM, 2012) ... 25
Table 2.4: Categories of intercity travel demand based on the menu of TCRP Report 88 (2003) and TCRP Report 141 (2010) ... 28
Table 2.5: Intercity travel demand related indicators chosen based on the menu of TCRP Report 88 – performance measures from operator’s perspective ... 30
Table 2.6: Intercity travel demand related indicators chosen based on the menu of TCRP Report 88 – Passenger measures ... 31
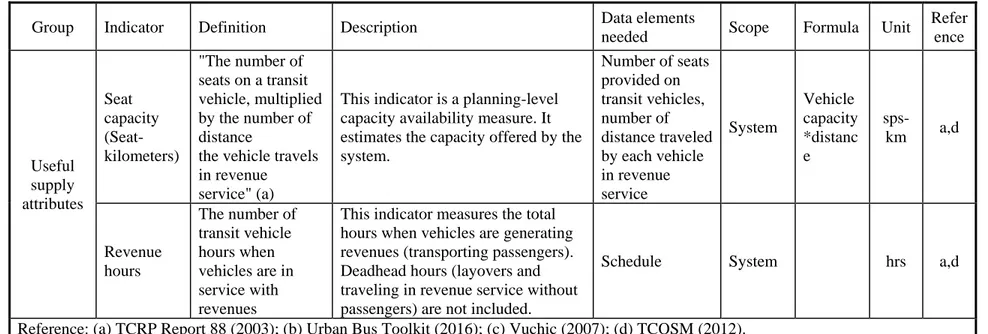
Table 2.7: Intercity travel demand related indicators chosen based on the menu of TCRP Report 88 – Supply measures ... 32
Table 3.1: Classification of fields in the sales database ... 43
Table 3.2: The number of records and data completeness in sales database ... 45
Table 3.3: Key facts of dataset adopted for performance measures ... 46
Table 3.4: Intercity travel by bus performance measure indicators ... 57
Table 4.1: Trip segment-based performance measure report for April 2016 and Easter Monday . 70 Table 4.2: Cities with the highest and the least number of boardings and alightings per departure in descending/ascending order ... 77
Table 4.3: Cities with the highest and the least number of boardings and alightings/city population ... 79
Table 4.4: Performance measure report for Line 48 Montreal – Quebec ... 91
LIST OF FIGURES
Figure 1.1: Master thesis structure ... 7
Figure 2.1: Conceptual map of the intra-city travel and inter-city travel ... 9
Figure 2.2: Linkage of the categories with different perspectives (TCRP Report 88, 2003) ... 22
Figure 3.1: Diagram of methodology ... 41
Figure 3.2: Conceptual map of the GTFS (Google developers, 2016; Barbier, 2016) ... 42
Figure 3.3: Conceptual map of the definitions related to passenger travel ... 47
Figure 3.4: Conceptual map of a trip segment ... 48
Figure 3.5: Conceptual map of a trip ... 48
Figure 3.6: Conceptual map of transfer based trip divisions ... 49
Figure 3.7: Conceptual map of journey type based trip division ... 50
Figure 3.8: Transfer related concepts ... 52
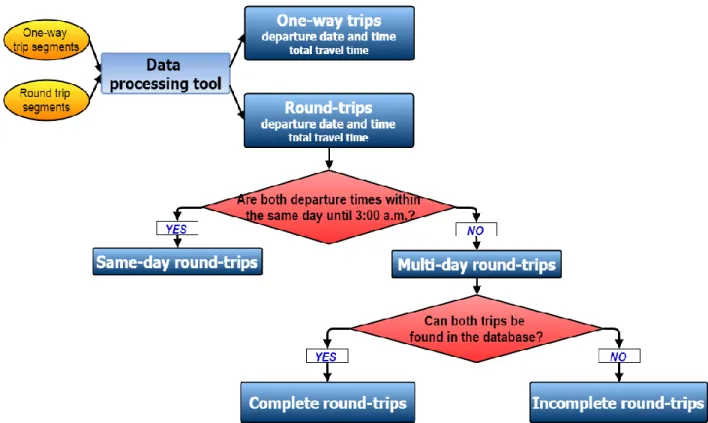
Figure 3.9: Data processing procedure to identify a trip and a trip with transfer ... 54
Figure 3.10: Data processing procedure to identify different types of trips ... 56
Figure 3.11: Procedure of performance measures in operator’s perspective ... 59
Figure 3.12: Standardized cluster colors used in legend ... 60
Figure 4.1: The nodes and links of the network operated by Keolis in April 2016 ... 61
Figure 4.2: The lines of the network operated by Keolis ... 62
Figure 4.3: Box plot and statistics of daily number of passengers over a week ... 63
Figure 4.4: Weekly trend of average daily number of boardings ... 64
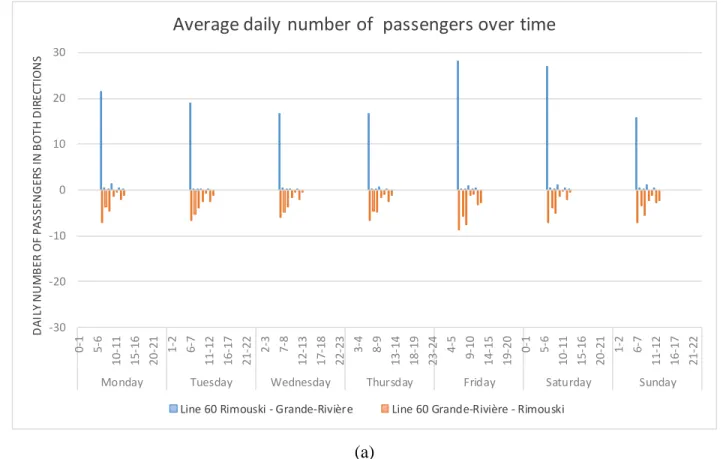
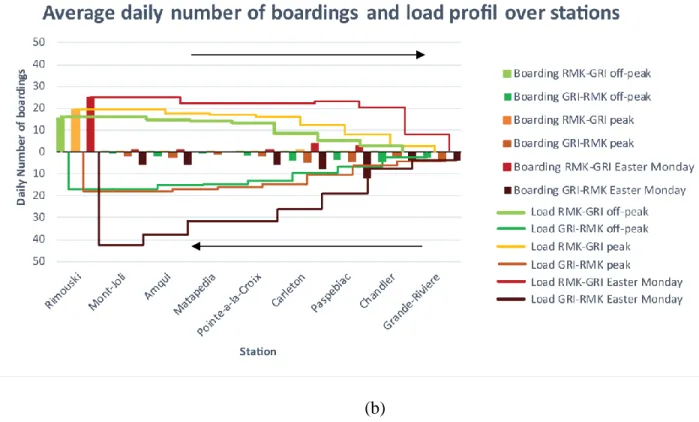
Figure 4.5: Average daily number of passengers over time and stations for Line 60 ... 66
Figure 4.6: Average daily number of passengers over time and stations for Line 41 ... 67
Figure 4.7: Average daily number of passengers over time for Line 49 ... 68
Figure 4.9: Daily number of boardings - peak days (Station Name (Number of boardings)) ... 72
Figure 4.10: Daily number of alightings - peak days (Station Name (Number of alightings)) ... 72
Figure 4.11: Daily number of boardings - off-peak days (Station Name (Number of boardings)) 73 Figure 4.12: Daily number of alightings - off-peak days (Station Name (Number of alightings)) 73 Figure 4.13: Daily number of boardings – Easter Monday (Station Name (Number of boardings)) ... 74
Figure 4.14: Daily number of alightings – Easter Monday (Station Name (Number of alightings)) ... 74
Figure 4.15: Daily number of stop boardings and alightings per departure – peak days ... 76
Figure 4.16: Daily number of stop boardings and alightings per departure – off-peak days ... 76
Figure 4.17: Daily number of stop boardings and alightings per departure – Easter Monday ... 77
Figure 4.18: Number of boardings and alightings/city population – peak days ... 78
Figure 4.19: Daily link departures ... 80
Figure 4.20: Daily link ridership – peak days ... 81
Figure 4.21: Daily link ridership – off-peak days ... 81
Figure 4.22: Daily link ridership – Easter Monday ... 82
Figure 4.23: Volume to capacity ratio by link – peak days ... 83
Figure 4.24: Volume to capacity ratio by link – off-peak days ... 83
Figure 4.25: Volume to capacity ratio by link – Easter Monday ... 84
Figure 4.26: Proportion of passenger boardings on peak days, off-peak days, and Easter Monday ... 86
Figure 4.27: Overall comparison of demand and supply and volume to capacity ratio by line ... 87
Figure 4.28: Daily productivity by line ... 89
Figure 4.29: Daily maximum passenger load per departure and the corresponding departure time ... 90
Figure 4.30: Average daily number of passengers over time for Line 48 ... 92
Figure 4.31: Synthesis of passenger boardings by the time of day (hour) MontrealQuebec ... 94
Figure 4.32: Synthesis of passenger boardings by the time of day (hour) QuebecMontreal ... 94
Figure 4.33: Synthesis of vehicles by the time of day (hour) MontrealQuebec ... 96
Figure 4.34: Synthesis of vehicles by the time of day (hour) QuebecMontreal ... 96
Figure 4.35: Synthesis of V/C ratio by the time of day (hour) MontrealQuebec ... 98
Figure 4.36: Synthesis of V/C ratio by the time of day (hour) QuebecMontreal ... 98
Figure 5.1: Proportion of different number of transfers ... 103
Figure 5.2: Distribution of total travel time ... 104
Figure 5.3: Average total travel time and scheduled transfer time for different number of transfers ... 105
Figure 5.4: Daily passenger OD desire lines – direct trips ... 107
Figure 5.5: Daily passenger OD desire lines – trips with one transfer ... 108
Figure 5.6: Passenger OD desire lines – Multi-transfers ... 110
Figure 5.7: Number of transfer passengers and the average scheduled transfer time (Station Name (Number of transfer passengers) – Scheduled transfer time) ... 111
Figure 5.8: Distribution of scheduled transfer time at main transfer stations ... 112
Figure 5.9: Distribution of scheduled transfer time by departure time of connecting bus ... 114
Figure 5.10: Distribution of transfer passengers and expired ticket rates over time ... 116
Figure 5.11: Expired ticket rates at transfer stations ... 117
Figure 5.12: Proportion of passengers with different types of trips ... 119
Figure 5.13: Distribution of departure time over week for one-way trips ... 120
Figure 5.14: Distribution of departure time over week for multi-day round-trips ... 120
Figure 5.15: Distribution of departure time over week for same-day round-trips ... 121
Figure 5.17: Distribution of stay duration for same-day round-trip passengers ... 123
Figure 5.18: Distribution of the departure day for different stay durations – multi-day round-trips ... 124
Figure 5.19: Distribution of the departure day for different stay durations – same-day round-trips ... 125
Figure 5.20: Distribution of total travel time – one-way trips ... 126
Figure 5.21: Distribution of total travel time – multi-day round-trips ... 126
Figure 5.22: Distribution of total travel time – same-day round-trips ... 127
Figure 5.23: Distribution of total travel time over stay duration – multi-day round-trips ... 128
Figure 5.24: Distribution of total travel time over stay duration – same-day round-trips ... 128
Figure 5.25: Number of orders per month in April 2016 ... 130
Figure 5.26: Accompaniment ... 131
Figure 5.27: Daily ticket modify and refund rate ... 132
Figure 5.28: Proportion of fare revenue ... 133
Figure 5.29: Average cost per passenger per kilometer ... 134
Figure 5.30: Average fare paid over time ... 135
Figure 5.31: Average fare and number of reservations in advance – one-way trips ... 136
Figure 5.32: Average fare and number of reservations in advance – round-trips ... 136
Figure 5.33: Distribution of the method of reserving the ticket ... 137
LIST OF SYMBOLS AND ABBREVIATIONS
DRU Drummondville GAS Gaspé
GTFS General Transit Feed Specification GRI Grande-Rivière
LEV Lévis MTL Montreal
MTR Montreal Trudeau Airport No. Number
PT Public Transportation QUE Quebec City
RMK Rimouski RDL Rivière-du-Loup TRI Trois-Rivières UL University Laval VIC Victoriaville
Road with two directions
CHAPTER 1
INTRODUCTION
Intercity buses are generally considered as environmentally friendly and safe means of public transport compared to other intercity travel modes (Woldeamanuel, 2012; Fraser, 2002). The intercity bus plays a key role in Canadian intercity transportation, especially for some disadvantaged population segments (Fraser, 2002). In Canada, thousands of cities of all sizes are served by bus, but only hundreds of medium to large cities are served by trains, and dozens of major cities are served by airlines (Fraser, 2002). In Quebec, specifically, the intercity bus network consists of 222 bus stations (Bus Carriers Federation, 2017), while only a little more than 20 cities are served by rail (Via Rail Canada, 2017). This is different from the current situation in most countries of Western Europe, where railways dominate the market share (statistics from Eurostat, 2016). Compared to trains and airplanes, intercity buses can run on existing public roads, they are potentially more flexible in scheduling, they ensure a greater spatial coverage, and their infrastructure investments are generally far less. This transportation mode has been in decline in Quebec and Canada since the 1980s (Blais, 1996) from 46 million trips in 1970 to 14 million trips by 2001 (Fraser, 2002). The most important reason is due to the popularity of personal cars which account for 90% of all intercity travels (Fraser, 2002). Other factors include the phenomenon of the rural exodus (Blais, 1996), government regulations (Fraser, 2002), and the increasing competition of emerging carpooling services (Blais, 1996). The decrease in demand leads to service reductions. This creates a negative feedback loop.
1.1 History of intercity bus in Quebec
The intercity bus industry appeared in the 1920s in Quebec. A federal permit system in terms of market access, price rate, and security was introduced in the 1930s in Canada to control vicious competitions between operators at that time (Fraser, 2002). In Quebec, the government agency Commission des transports du Québec (CTQ) regulates intercity bus operators by delivering the intercity bus permits (Commission des transports du Québec, 2017). However, it was not possible to clearly identify when this permit system was established in Quebec using the available documents. This industry was highly developed in the 1940s due to petrol restrictions in civil use during the second world war, and the increasing travel demand brought by economic and employment recovery after the war (Blais, 1996). Between 1950 and 1980, the emergence and wide
dissemination of cars generated a significant competition for buses. Due to the strong demographic at that time, however, buses had no trouble growing their businesses (Blais, 1996). After 1980, a change in terms of supply and demand took place. The number of intercity bus passengers in Quebec declined, especially those in the core regional network (Blais, 1996). A reduction in supply occurred, many local short routes were either phased out or completely closed due to the phenomenon of rural exodus. Parts of the population were left with no alternative means of public transport to reach major local centers (Blais, 1996). At the same time, express routes linking the major Quebec cities became more and more important (Blais, 1996).
Intercity buses, the most used transportation mode for long-distance travel after cars, have been experiencing very difficult times since the early 2000s (Vecteur 5, 2011). The reasons are diverse. First, the demand decreases as explained above; second, the increasing popularity of carpooling services (La Presse, 2012); then, the current federal and provincial legislative and regulatory regimes; and finally, the government subsidies to modal competitors (Council of Ministers, 2010). Current regimes require the intercity bus operators to finance the loss-incurring routes by more profitable ones (cross-subsidy model) and do not timely approve modifying service levels (Council of Ministers, 2010). These regimes are often controversial and are considered as a key factor that leads to the mismatch between the current services and the market conditions (Council of Ministers, 2010). The possibility of cross-subsidization has become much smaller for intercity bus companies over time (La Presse, 2014). The for-profit private intercity bus companies then turned to other solutions. One solution is to provide chartered transportation services (bus booked by some group) or package transportation services (package shipping with current intercity passenger bus service) to balance their budgets. Another solution is to improve their service and to maintain and attract customers, especially for high-traffic routes. For example, the Bus Carriers Federation, who merged more than 180 private companies that own buses, had made efforts to modernise their information system (schedule, fare, and itineraries) for user experience improvement, such as the website EspaceBus and the intercity bus route management system (système ordiné de gestion des trajets d’autobus interurbains) (Chapleau et al., 1999). An integrated schedule and fare system was used for users better planning their travel times and minimizing their transportation costs. This service however no longer exists since September 2014, as a monthly website content update is too burdensome with the special data format (Barbier, 2016). Each carrier also tried to improve the service in their own way. The largest intercity bus operator in Quebec, Keolis for example,
implemented new technologies such as online reservation system, free Wi-Fi, and electric and USB outlets. Keolis also published the schedules and fares of all their itineraries with Google Maps, which allowed for the integration with the urban public transport system (Keolis, 2013).
The intercity bus industry is experiencing a dramatic change in recent years. Some companies demanded the authorization of cutting unprofitable local service lines. For example, in 2014, Keolis obtained the authorization from the Quebec Transport Commission (CTQ) to end its service for dozens of municipalities across the Quebec (Le Devoir, 2014). Keolis decided to trim their services, cutting out many stops on regional routes and focusing on the Quebec City - Montreal corridor, to avoid shutting down altogether (CBC News, 2015). Thus, some students, workers, and tourists previously depending on bus services in rural or remote areas were highly affected (Montreal Gazette, 2014). These population segments had been forced to find alternatives or to reduce or even cancel their travels.
In 2016, a financial subsidy plan from the Minister of Transport Quebec for intercity carriers allowed for the reduced services of Keolis to still be maintained (Le Pharillon, 2016; Le Journal de Québec, 2016; Le Droit, 2016). Following this, a series of measures were carried out to improve their services, such as stop additions and cancellations, schedule changing, fare reductions through variable price rates, launching their own online booking system accessible by both web browsers and mobile phones (Le Journal de Québec, 2016; L’avantage, 2016; Radio-Canada, 2016). There is still a lack of collaboration between the carriers in Quebec however. Each carrier supports its own website to describe its service features, and only Keolis has integrated its network with Google Maps (Keolis, 2013). Reservations for a trip with transfer between different carriers are possible by agents but still not yet available online.
1.2 Problem statement
There is little research on intercity bus sector in Quebec or even in Canada compared to urban transport studies. In urban transport study area, many studies with automatic fare collection (AFC) systems have been conducted (Pelletier et al., 2011; Agard et al., 2006; Bagchi and White, 2005; Chapleau and Chu, 2007; Chu et al., 2009; Trépanier et al., 2009; Trépanier and Morency, 2010). However, the sales database of intercity travel is not widely used since operational data are usually owned by private companies (Miller, 2004). There are both similarities and differences between the urban transit AFC systems and the intercity bus sales database. Both datasets can be used to
estimate future demand origin-destination (OD) trip matrices, evaluate transit performance, analyze demand distributions, etc. Urban transit AFC systems have a large amount of travels every day, and the passengers can randomly choose their origins, destinations, and departure times. However, intercity travel passengers have a lower quantity and travel frequency. Intercity bus passengers are suggested to reserve their places in advance (Keolis, 2016), and to apply for ticket modification or cancellation based on the associated conditions. This situation motivates the present study in which the intercity bus sales dataset is used to assess the performance of the network in terms of demand from both operator’s and passenger’s perspectives and to analyze passenger’s trip patterns.
The envisaged research problems include:
➢ What indicators best measure the service performance for operators?
Performance measure indicators can describe network performance in a quantitative way. One of the key challenges is selecting which characteristics to measure, such as how much is the service used? Are stops located appropriately? How well does each line perform?
➢ What are the travel characteristics of passengers by intercity bus?
Attracting and retaining passengers is a crucial task for privately owned intercity bus carriers. It is important to understand the clientele as the more we know what they want, the easier it will be to cater for more customers. Passenger characteristics include: Where do they travel the most? When do they prefer traveling? How long do they want to stay at their destinations? How long do they travel? How many trips are served directly by the current intercity bus networks without transfers? Where do they transfer, and how long do they wait at the transfer stations?
➢ How to improve the intercity bus service based on the performance measurement and trip pattern analysis?
Intercity bus carriers are striving to grow their business by providing a convenient, secure, attractive, and comfortable transport system. A variety of elements goes into making a better customer experience. This research suggests how to improve the service based on performance measurement and passenger trip pattern analysis.
1.3 General research context
This study is a part of a larger research project aiming at providing a) a better understanding of informational and methodological difficulties faced by the intercity bus industry, and b) to develop an integrated knowledge of supply and demand for the intercity bus network. This project is carried out in collaboration with the Bus Carriers Federation and some major carriers in Quebec (Keolis, Maheux, Galand Laurentides Ltée, Autobus Breton, Intercar Inc and Transdev Quebec). Barbier (2016) made efforts to characterize the intercity bus supply in a previous work under the same project. The work of Barbier (2016) contributed to developing an integrated dataset which includes intercity bus General Transit Feed Specification (GTFS, which defines a common format for public transportation schedules and associated geographic information), number of bus departures, mileage, the variability of the service by time and space, and the degree of accessibility.
This thesis focuses on characterizing intercity bus travel demand in terms of operator performance measures and the passenger trip pattern analysis. One source of data is the intercity bus supply developed by Barbier (2016) mentioned above. Another source of data is the sales database provided by intercity bus carriers. A set of indicators considering both operator’s and passenger’s perspectives are proposed to assess the performance of intercity bus network. The trip patterns of passengers are also reviewed to better understand their potential needs.
1.4 Research objective
The first objective of this research is to define the most suitable indicators in terms of demand that can be used to evaluate the performance of intercity bus systems from the operator's perspective. The second objective is to better understand the travel patterns of the intercity bus passengers based on the sales database, which provides the clearest indication of their preferences.
These objectives can be achieved by the following steps:
1. Propose a set of relevant indicators based on the primary components of an intercity travel system (network and passengers) to evaluate its performance from both operator’s and passenger’s perspectives;
2. Develop a method to derive trip segments and complete passenger trips from the sales database;
3. Present a procedure to measure the performance with a set of indicators; 4. Analyze the temporal and spatial variability of intercity travel demand by bus; 5. Illustrate passenger’s trip patterns.
1.5 Dissertation organization
According to the objectives, this master’s thesis is composed of an introduction, four chapters, and a brief conclusion.
The rest of this dissertation is organized as follows, as illustrated in Figure 1.1:
Chapter 2 reviews the existing literature to develop a knowledge base on intercity travel demand analysis. Three key aspects are addressed, namely the comparison between urban travel and intercity travel, a review of transit performance measurement with indicators, and a review of the different components of travel time.
Chapter 3 presents the methodology for performance analysis of the intercity bus system from both the operator’s and passenger’s perspectives.
The results of operator-based measures obtained with trip segments are presented in Chapter 4. The results of passenger-based measures obtained with trips and the passenger trip patterns are illustrated in Chapter 5.
Summary, contributions, and limits of this research are discussed in Chapter 6. Possible directions for further research are also proposed.
CHAPTER 2
LITERATURE REVIEW
This literature review focuses on the aspects of performance measurement and passenger trip pattern characterization dealt with in many practical experiments and research related to the sector of the urban area to intercity travel. First, an overview of comparison between intra-city (traveling within an urban area) and inter-city transport (traveling between cities) systems are presented. Then, different procedures and indicators used in urban transit performance measurement are explained, and their applications to intercity bus system are discussed. Finally, travel time, which is one of the most important factors that affect passenger’s trip patterns, as well as some existing techniques for transfer evaluation and optimization, are discussed.
2.1 Intra-city vs Inter-city bus systems
This section extends the definitions of intercity travel (also called long-distance travel) presented in the previous research of Guillemette (2015) and Barbier (2016). Some concepts and notions related to intra-city and inter-city public transit systems are presented and then discussed.
2.1.1 Definition of intra-city and inter-city travels
According to the Merriam-Webster Dictionary, a city is “an inhabited place of greater size, population, or importance than a town or village”, and the term urban is “characteristic of a city”. As defined by the census bureau of the U.S., rural is “any population, housing, or territory not in an urban area” (United States Census Bureau, 2017). Thus, there is no difference between city and urban, and urban areas and rural areas are the only two territory categories in North America. The classification of urban and rural areas is generally based on the census population size and density (Statistics Canada, 2011; United States Census Bureau, 2017). The definitions of these terms change from one country to another as their population sizes are different. Even for one country, these definitions change over time due to population size variation. In Canada, areas having a population of at least 1, 000 and a density of 400 or more people per square kilometers are defined as urban areas (Statistics Canada, 2011). To better classify all the communities that meet these minimum definition requirements, Statistics Canada further subdivided urban areas as small population centers (1,000-29,999), medium population centers (30,000-99,999), and large urban population centers (more than 100,000) (Statistics Canada, 2011).
The word “suburban” is frequently used, but there is no official definition for it. There are many dimensions that can be considered to define the suburbs. For example, based on location, density, and newness, suburbs are defined as “more recently developed parts of an urban or metropolitan area, outside the core or historical city area” (Harris, 2010). Based on geography, suburbs are areas between the city center and the rural areas (Harris, 2010). Apart from definitions based on physical features, there are also some functional definitions for suburbs. Suburbs are “locations within commuting distance of a core city” considering transportation (Clapson, 2003) and are “mainly residential developments with segregated uses” considering activities (Forsyth, 2012). Thus, suburbs are outside the core city but within a commuting distance of an urban area.
By these definitions, communities (or municipals) that meet the requirements of urban areas would take charge of the transportation within the core city and suburban areas, known as intra-city travel or urban travel, while traveling between different communities belongs to inter-city travel. However, the responsibility of transportation for rural areas and border areas is not defined (as illustrated in Figure 2.1). Currently, the intercity bus is one of the major collective modes for these rural areas in North America (Yang, 2013; Fraser, 2002). These itineraries are generally cross-subsidized by profitable lines and need government subsidy (Fraser, 2002). The advantage of these services is to keep rural routes alive, but it makes the fares of profitable routes higher than necessary and less competitive (Fraser, 2002).
There are three primary criteria to distinguish inter-city travel from intra-city travel: travel distance, travel time, and space boundary (Guillemette, 2015; Barbier, 2016).
Travel distance is the most frequently used way used in the household travel surveys to distinguish these two types of travel. Most travel surveys take the shortest route distance regardless of circulation conditions. The minimum distance varies from one country to another as national territory areas are different. For example, the long-distance travel is defined as trips longer than 80.5 km (50 miles) for the National Household Travel Survey (NHTS) conducted in the U.S. on 2006 and 2011, 50 km in Austria, 80 km in France, and 24 km (15 miles) in Great Britain (Van de Velde, 2009; Christensen, 2015; Barbier, 2016).
Travel time is another criterion, but it is less used. One reason is that travel time is barely measured during the surveys, another reason is because time changes facing different route conditions and using different travel modes. Some surveys use night stay to distinguish between inter-city travel and intra-city travel (Statistics Canada, 2011). The Micro Census of Mobility and Transport conducted in Switzerland in 2010 considered trips longer than 3 hours without night stays and travels with night stays as long-distance travels (Federal Statistical Office, 2016).
Space boundary can also be used as a criterion. As its name implies, an intercity travel generally crosses administrative borders. The inter-city travel can be defined as the travel “between two or more urban areas rather than travel within a given urban region” (Miller, 2004).
The definition of intercity travel adopted in this research complies with the previous research of Guillemette (2015) and Barbier (2016) under the same project, which is: travel out of the urban area with a crow fly distance of longer than 80 km. The definition of intercity travel by bus is: bus service that opens to all public who take intercity travel with fixed itineraries and schedules.
2.1.2 Intra-city trips and Inter-city trips
There are some distinct differences between intra-city and inter-city passenger trips. They are compared based on travel purpose, frequency, and mode choice.
Studies point out that intra-city trips are mainly taken for livelihood activities such as employment, education, shopping, and regular leisure activities, while inter-city trips are mainly conducted for leisure, business, or personal affairs. The results of NHTS (2011) show that 45% of daily intra-city trips are taken for shopping and errands, 27% for social and recreational activities (e.g. visiting a
friend), and 15% for commuting (Bureau of Transportation Statistics, 2017). Origin-Destination Survey conducted in Montreal (2013) concludes that about half of trips taken during peak hours in the morning are for the commuting purpose and 28% for study purpose (Agence Métropolitaine de Transport, 2017). For inter-city trips, 56% are taken for pleasure (e.g. vacations, sightseeing trips, visiting friends or relatives, outdoor recreation), 16% for business, and 13% for commuting to work (Bureau of Transportation Statistics, 2017). Other surveys also point out that for intercity travel by bus or rail, visiting friends and family members is the most common trip purpose, followed by business (Clarkston et al., 2005; Grengs et al., 2009; Kack et al., 2011; McGuckin, 2015).
Inter-city travels have lower travel incidence and frequency compared to intra-city travels. According to McGuckin’s analysis of NHTS (2011), only 12% of individuals do not leave the house on an average day while 38% of people do not make long-distance travels in an average year (McGuckin, 2015). For intra-city travels, surveys show that Americans take 4 trips/person/day with an average travel distance of 64 km (40 miles) (Bureau of Transportation Statistics, 2017), Montrealers take 2.3 trips/person/day (Agence Métropolitaine de Transport, 2017). For inter-city travels, Americans take about 9 trips/person/year with median distances of 3,328 km (2,068) miles by air, 462 km (287 miles) by bus, 312 km (194 miles) by car, and 309 km (192 miles) by train (Bureau of Transportation Statistics, 2017). The results of European surveys also confirm that inter-city travels occur infrequently. The KITE survey conducted in Portugal, Switzerland, and Czech Republic between 2008-2009 reported 8-9 long-distance trips/person/year (Kuhnimhof, 2009). The MID Mobility Diary conducted in Germany in 2002 reported 5 long-distance trips/person/year (Kuhnimhof, 2009). The Switzerland MC mobility diary conducted in 2005 reported between 4-5 long-distance trips/person/year (Kuhnimhof, 2009; Frei et al., 2010). At longer distances, the trip frequency decreases. It drops to less than 1 trip/person/year for distances longer than 300 km in the KITE survey for domestic long-distance travels (Kuhnimhof, 2009; Frei et al., 2010).
For mode choice, travel cost and travel time are the key attributes for all mode choice modeling regardless of intra-city or inter-city travels (Garvill et al., 2003; Wardman 2004; Bhat and Sardesai, 2006; Fosgerau, 2006; Bhat et al., 2007). However, the considerations of these two attributes are different. For intra-city travels, passengers consider the entire journey from the origin to the destination, while for inter-city travels, the long in-vehicle segment is of most important consideration (Agarwal, 2006). For example, the ease of access and egress to or from the metro or bus station is an important factor that affects passenger’s choice for intra-city travels. However,
passengers generally do not make a choice between traveling by plane or train based on how easy it is to get to the airport or train station, but on the total cost and the total travel time from one city to another (Agarwal, 2006). With longer travel distance, the impact of the access and egress stage will be less important (Krygsman et al., 2003). As for travel cost, both ticket price and price elasticity are higher for inter-city travels than intra-city travels (Agarwal, 2006). Passengers are more likely to avoid inter-city travels than intra-city travels due to their different travel purposes (Agarwal, 2006).
2.1.3 Intra-city bus and Inter-city bus
The public transport modes for core cities, suburban, and intercity travels are all concerned with buses. Keeping in mind the differences between intra-city and inter-city travels, the bus systems for are also different, both in vehicle characteristics and other operations.
The vehicles used for intra-city and inter-city travels are different. For intra-city travels, the vehicles used are known as urban buses, but in inter-city travel areas, they are generally called coaches (Prentice and Tremblay, 2002). Their design characteristics and speed limit are totally different but will not be discussed in depth in this study. An obvious difference between intra-city buses and inter-city buses is the number of available seats and their allocation within the vehicle. Inter-city bus systems use the coach with a standard number of seats of approximately 54 or 56 (Prentice and Tremblay, 2002) and the maximum capacity of the coach is the same as the number of seats without standing area. However, the capacity of an urban bus is superior because there exists a standing area. For example, the bus capacity used and published in Minneapolis is 132 for hybrid-electric buses, 169 for articulated buses, and 547 for diesel buses (Metro transit serving the Minneapolis, 2017).
The reservation and payment methods are also different. For intra-city travel by bus, there is no reservation system and passengers can randomly decide whenever to leave and wherever to go. For inter-city travel by bus, passengers are suggested reserving their tickets either online or from ticket agents in advance. They need to disembark at the destination printed on their tickets. Intra-city travel passengers have more fare options depending on different travel frequencies (e.g. one-way ticket, multi-day pass, monthly pass, etc.) (Societé de Transport de Montréal, 2017), while inter-city travel passengers have only two options (one-way ticket or round tickets) (Keolis, 2017).
The socio-demographic characteristics are slightly different for intra-city travel and inter-city travel passengers. The findings of several surveys point out that inter-city bus passengers are more likely to be female, age less than 24 or more than 65, single, have low income (including persons released from incarceration, college students, and military personnel), and travel alone (Bureau of Transportation Statistics, 2017; Grengs et al., 2009; Clarkston et al., 2005; McGuckin, 2015). However, intra-city passengers are more likely to be 25-54 years old (Ponrohono, 2015; Neff and Pham, 2007).
Finally, there are also differences in service areas and subsidies. As mentioned before, sometimes the borders among suburban, rural, and inter-city travels are not clear, especially for those remote areas with low population densities. Intercity buses and paratransit (special services with reservations for disabled persons) are commonly used modes of transportation from rural areas to urban areas (Yang, 2013). In Canada, current intercity bus routes have four categories: the most profitable (highest density), profitable (medium density), marginal (low density), and unprofitable (lowest density) (Fraser, 2002). Most routes (57%) are operated for low density areas but only account for 22% of the total intercity bus trips (Fraser, 2002). There are currently no federal subsidies to inter-city buses apart from a few small provincial subsidies in Quebec (Fraser, 2002). Large provincial and municipal subsidies, however, are given to urban transit operations throughout Canada (Fraser, 2002).
2.2 Intercity bus performance measures
An intercity bus system, like other modes of public transit, can be evaluated by quantitative and qualitative elements referred to as indicators (Cascetta and Cartenì, 2014; Government of Canada, 2010). Quantifiable measures using performance indicators are of interest to the operator staff responsible for performing self-reviews, peer comparisons, and the management of the activities of the companies (Transit Cooperative Research Program (TCRP) Report 88 (A Guidebook for Developing a Transit Performance-Measurement System), 2003; Canadian Transport Agency, 2010). This section introduces the process of developing indicator-based quantifiable performance measures commonly used in urban transit areas, based on which to identify the relevant indicators that can be used for analyzing the current intercity travel demand by bus in Quebec.
2.2.1 Performance measures for different components of the transport system
There are four essential components in a transportation system: network, infrastructure, mode and flow (Rodrigue et al. 2016). A network is a combination of nodes, links, and lines. In general, the infrastructure of public transport systems includes routes, terminals, stops and maintenance facilities. The mode represents the mobile elements of a transport system, and the flow can be expressed by the vehicle flux or passenger flux in passenger transport (Rodrigue et al. 2016). The definitions of these components and units are, first, presented in a general context according to different references, and then specific definitions are given to adapt to intercity travel by bus. The detailed definitions of the components, as well as their units, are listed in Table 2.1.Table 2.1: Definitions of the components of transport system in both general context and intercity travel context
Component and
its elements Definition in general context Definition adapted to intercity travel by bus Example
Refer ence
Corridor or line
"A sequence of nodes and links supporting modal flows of passengers or freight." (a)
One fixed-route with a sequence of nodes and links supporting intercity bus flows of passengers.
Quebec-Rimouski a Infrastructure Fixed elements of transportation that
physically support transport modes.
Fixed elements that physically support the
regular services of intercity bus. a
Route
"A route is a single link between two nodes that are part of a larger network that can refer to tangible routes such as roads and rails, or less tangible routes such as air and sea corridors." (a)
A fixed single tangible road between two nodes where intercity bus circulates.
Express Line Montreal-Quebec
a
Terminal
Any location where passengers and freight either originate, terminate, or is handled in the transportation process.
A designed place with specific facilities and equipments where a bus originates or terminates its scheduled route.
Montreal Central Station
a
Stop
A place where passengers can board or disembark from a scheduled transport mode, usually identified by a sign.
A place along a bus route that provides the accessibility to intercity bus services and where passengers can board or disembark. It
Longueuil a
Maintenance facility
A place with fixed equipments to maintain typical operations of the intercity bus system. Ticket agent in store b Network Node Link a a a A bus network served by Keolis Montreal, Longueuil, etc. Montreal-Longueuil Network refers to a system of linked
locations representing the functional and spatial organization of transportation.
A system of linked cities representing the functional and spatial organization of the intercity bus system.
"Any location that has access to a transportation network." (a)
Any location that has access to intercity buses. Here the location can be one city, or a specific stop if several stops are available in one city.
"Physical transport infrastructures that enable to connect two nodes." (a)
A direct line representing a set of roads that connect two adjacent nodes.
Table 2.1: Definitions of the components of transport system in both general context and intercity travel context (continued)
2.2.2 Methodology of performance measures
A performance measurement process is not just a mix of indicators. Performance indicators should reflect the objectives of different stakeholders, and it is also important to have the resources in place (National Cooperative Highway Research Program (NCHRP) Report 446, 2000; NCHRP Report 708, 2011; TCRP Report 88, 2003; Florida Department of Transportation, 2014). Several steps are necessary to ensure that all principal aspects are well addressed. TCRP Report 88 proposed an eight-step process for transit agencies of any size implementing or updating a performance measurement program. These steps are, in order:
“1. Define goals and objectives; 2. Generate management support;
3. Identify internal users, stakeholders, and constraints;
Component and
its elements Definition in general context Definition adapted to intercity travel by bus Example
Refer ence
Mode Vehicles that support the mobility of
passengers or freight.
Intercity buses used to move passengers in a
regular basis. a
Vehicle characteristics
Characteristics related to the intercity bus in service, like energy type, design (capacity, onboard equipments etc.) and performance (speed, acceleration etc.)
Baggage holds, curtains, on-board wifi b Right-of-way
The type of easement granted or reserved on road for intercity buses. It can be expressed by technology (bus lane) or road alignment
Public lane shared with car
b &c Operational
aspects Operating type, operating regime, etc. Express/local b
Flow
The amount of traffic (people, freight or information) that circulates over the network with origins, destinations and possibly intermediary locations.
The amount of traffic (vehicles or passengers) transported orientationally between two nodes.
a
Vehicle "A motor vehicle used to transport
persons" (d)
Intercity bus that travels between two nodes
with certain frequencies based on defined d
Passenger
A rider who has paid a fare on a carrier in the business of transporting people for compensation.
A rider who has paid for a ticket to travel
with intercity buses. e
Reference: (a) Rodrigue et al., 2016; (b) Vuchic, 2007; (c) Black’s Law Dictionary, 2017 (d) Texas Transportation Code, 2016; (e) USLegal Dictionary, 2017.