Bus Network Sketch Planning
with Origin-Destination Travel Data
by
Cecilia A. Viggiano
M.S. in Transportation, Massachusetts Institute of Technology (2013) B.A. in Environmental Analysis, Pomona College (2008)
Submitted to the Department of Civil and Environmental Engineering in partial fulfillment of the requirements for the degree of
Doctor of Philosophy in Transportation
at the
MASSACHUSETTS INSTITUTE OF TECHNOLOGY June 2017
@
Massachusetts Institute of Technology 2017. All rights reserved.Author
...
Signature redacted
Department of Civil and EnvironmenY Engineering
May 19, 2017
C ertified by ...
Signature redacted
Nigel H.M. Wilson Professor of Civil and Environmental Engineering Thesis SupervisorSignature redacted
A ccep ted by ... %e
/
Jesse Kroll
Professor of Civil and Environmental Engineering Chair, Graduate Program Committee
MASSACHUSETTS INSTITUTE OF TECHNOLOGY
JUN 14 2017
LIBRARIES
ARCHIVES
Bus Network Sketch Planning
with Origin-Destination Travel Data
by
Cecilia A. Viggiano
Submitted to the Department of Civil and Environmental Engineering on May 19, 2017, in partial fulfillment of the
requirements for the degree of Doctor of Philosophy in Transportation
Abstract
Public transport plays an important role in urban mobility. Public transport planners seek to improve existing public transport networks to better serve existing passengers and recruit new passengers, particularly as demand patterns change with evolving demographics and land use. One strategy for network improvement is to add new routes, which can improve service by reducing circuity in the network. In large, complex, and multi-modal public transport networks, it is challenging to determine where new routes should be added. A systematic approach for incremental network improvements, such as adding new bus services, is needed. This research proposes a new approach to network-level public transport planning by combining origin-destination (OD) level analysis with new spatial aggregation methodologies, and develops a comprehensive framework for the identification of corridors for new bus services.
In the context of this framework, this dissertation contributes several new methodologies. First, it proposes a methodology for defining zones that reflect the spatial characteristics of a public transport network. This produces zonal pairs that are appropriate for OD level analysis of travel in the network. Second, the dissertation develops metrics and rules for the identification of
OD
pairs that can benefit from new bus services, and proposes methods for estimating the expected benefits of such services at the OD level. Finally, a new methodology for spatially clustering OD pairs into corridors is developed, based on trajectory clustering methods. This final methodology represents a new way of aggregating OD level information to accomplish the first step in bus network design: the definition of corridors for new services. The framework is demonstrated for the identification of corridors for new bus services in the London public transport network. Bus stops and rail stations are clustered into 1,000 zones. A subset of zonalOD
pairs with circuitous service are identified as candidates for improvement through new bus routes. An algorithm that clustersOD
pairs into corridors for bus service is developed and applied. Several promising corridors are identified, and their potential is confirmed in post-analysis.Thesis Supervisor: Nigel H.M. Wilson
Title: Professor of Civil and Environmental Engineering
Acknowledgments
I would like to thank my advisors: Professor Nigel Wilson, Professor Haris Koutsopoulos, and John Attanucci for following my progress and sharing their wisdom at every stage of this research. Thank you also to Professor Jinhua Zhao and Chancellor Cindy Barnhart for providing feedback at my committee meetings and in the periods between. And to Fred Salvucci, Mikel Murga, and Gabriel Sanchez Martinez: thank you for always being willing to listen and advise.
This research was funded by Transport for London and benefited immensely from the ex-pertise of TfL's Network Development team, including John Barry and Alex Phillips. And thank you as well to Lauren Sager-Weinstein, Dale Campbell, and Andrew Hyman of TfL for their support.
Thank you to the Transit Lab students, past and present.
To all of the wonderful CEE staff including Ruth Yiu, Shannon McCord, Ginny Siggia, Kiley Clapper, and Kris Kipp: thank you for supporting me throughout my time at MIT.
Thank you to my friends, near and far, for endless encouragement, and to my water polo team, for keeping my spirits high.
Thank you to my parents, Sharon and Frank, and my sisters, Vanessa and Emily, for always believing in me.
Last of all, thank you to James for listening to me talk about my research for hours -upon hours, for cooking me countless dinners, and for many, many walks around MIT.
Contents
List of Figures List of Tables 1 Introduction 1.1 Sketch planning 11 13 15 . . . 16 1.2 Motivation . . . . 16 1.2.1 Reducing circuity . . . . 171.2.2 Bus planning in a multi-modal context . . . . 18
1.2.3 An opportunity for a data-driven approach . . . . 18
1.3 London as a case study . . . . 19
1.4 Objectives . . . 20
1.5 Approach . . . 21
1.6 Contributions . . . 22
1.7 Dissertation outline . . . 22
2 Literature review 2.1 The Transit Network Design Problem . . . . 2.2 Sketch planning and decision support tools . . . . . 2.3 New sources of travel data . . . . 2.4 Aggregation, clustering, and statistical methods . . 2.4.1 Modeling networks as graphs . . . . 2.4.2 Clustering . . . . 2.5 Sum m ary . . . . 3 Framework 3.1 Scope of framework . . . . 3.1.1 Existing, multi-modal networks . . . . 3.1.2 Planning level and strategies . . . . 3.1.3 M ode . . . . 3.1.4 Time horizon . . . . 3.2 O verview . . . . 3.2.1 Step 1: Defining OD pairs . . . . 23 24 25 . . . 26 27 . . . 28 . . . 28 30 31 . . . 31 31 . . . 32 33 33 33 . . . 34
3.2.2 Step 2: Analyzing performance and opportunities of OD pairs . . . 35
3.2.3 Step 3: Clustering OD pairs into prioritized corridors . . . . 3.2.4 Post-analysis . . . . 3.3 Methodological choices . . . . 3.3.1 Spatial representation . . . . 7 . . . . 38 . . . . 38 . . . . 39 39
3.3.2 Planning in an existing network . . . . 3.4 Inputs . . . . 3.5 Summary . . . . 4 Defining origin-destination pairs
4.1 Clustering methodology . . . . 4.2 Number of zones . . . . 4.3 Step 1 outputs . . . .
5 Origin-destination level analysis
5.1 Analysis constraints . . . . 5.2 Filtering OD pairs . . . .. ...
5.2.1 Identifying OD pairs that are not well-served 5.2.2 Identifying OD pairs that are improvable . . 5.3 Estimating potential travel time savings . . . . 5.3.1 Estimating current public transport passengers
service . . . . 5.4 Estimating expected new demand . . . . 5.4.1 Four-step demand models . . . . 5.4.2 Direct demand models . . . . 5.4.3 Elasticities . . . . 5.4.4 Uncertainty . . . . 5.5 Step 2 outputs . . . . 6 Corridor identification methodology
6.1 Review of trajectory clustering . . . 6.1.1 TraClus-DL. . . . 6.2 Methodology overview . . . . 6.3 Defining potential corridors...
6.3.1 The potential route . . . .
6.3.2 Assigning OD pairs to potential routes . 6.3.3 Evaluating potential corridor flow . . . . 6.3.4 An OD-chaining approach . . . . 6.4 An algorithm implementation . . . . 6.5 Step 3 outputs and post-analysis . . . . 7 Applying the framework to London's bus network
7.1 D ata . . . . 7.1.1 Public transport journey data . . . . 7.1.2 Shortest path data . . . . 7.2 Defining zones (Step 1) . . . . 7.2.1 Considering access distance distributions . . . 7.2.2 Silhouette score . . . . . . . . 40 . . . 40 . . . 42 45 . . . 46 . . . 48 . . . 48 49 . . . 49 . . . . 50 . . . 50 . . . . 53 . . . 55
who benefit from new . . . 55 . . . 56 . . . 56 . . . 56 . . . 57 . . . 57 . . . 57 59 . . . 59 . . . 60 . . . 61 . . . 64 . . . 64 . . . 68 . . . 71 . . . 72 . . . 73 . . . 74 75 75 75 76 76 77 78 79 80 81 81 87 7.2.3 Weighting stops and stations in the clustering algorithm
7.2.4 Stop and station clustering results . . . . 7.3 OD analysis (Step 2) . . . . 7.3.1
OD
pair constraints . . . . 7.3.2 Filtering OD pairs that are well-served . . . .8
. . . . . . . .
. . . .
7.3.3 Estimating expected travel time . . . . 7.3.4 Identifying improvable OD pairs . . . . 7.3.5 Estimating potential travel time savings . . . . 7.3.6 Estimating expected demand . . . . 7.3.7 Summary of OD pairs identified for improvement . . . 7.4 Identifying corridors (Step 3) . . . . 7.4.1 Maximum distance . . . . 7.4.2 Corridor length . . . . 7.4.3 Corridor demand . . . . 7.5 Sensitivity to parameter selection . . . . 7.5.1 Distance and time multiplier and additive factors . . . 7.5.2 E lasticity . . . . 7.5.3 Corridor shape: distance, angle and length . . . . 7.5.4 Corridor flow . . . . 7.5.5 Prioritizing corridors . . . . 7.5.6 Summary of sensitivity analysis . . . . 7.6 Scenario analysis . . . . 7.6.1 C orridor 1 . . . . 7.6.2 C orridor 4 . . . . 7.6.3 C orridor 6 . . . . 7.6.4 Summary . . . . 7.7 D iscussion . . . . 7.7.1 Classifying OD pairs . . . . 7.7.2 Understanding corridor flow . . . . 7.7.3 Accounting for existing routes . . . . 7.7.4 More realistic representations of corridor shape . . . . 8 Conclusion
8.1 Contributions . . . . 8.1.1 A new zone definition methodology . . . . 8.1.2
OD
level analysis of directness . . . . 8.1.3 Corridor identification methodology . . . . 8.1.4 Impacts on public transport planning . . . . 8.2 Future work . . . . 8.2.1 Methodological improvements . . . . 8.2.2 Applying the framework to other planning challenges .. . . 93 . . . 93 . . . 94 . . . 94 . . . 97 . . . 98 . . . 98 . . . 99 . . . 99 . . . 101 . . . 102 . . . 104 . . . 105 . . . 108 . . . 109 . . . 109 . . . 109 . . . 112 . . . 116 . . . 122 . . . 125 . . . 127 . . . 128 . . . 129 . . . 130 . . . 130 133 . . . 133 . . . 133 . . . 134 . . . 134 . . . 134 . . . 135 . . . 135 . . . 138 141 Bibliography 9
List of Figures
1-1 A pproach . . . 21
3-1 Example of multiple paths serving a similar origin-destination pair . . . . 34
5-1 D ecision tree . . . . 51
6-1 Overview of Part 1 of the corridor identification methodology . . . . 62
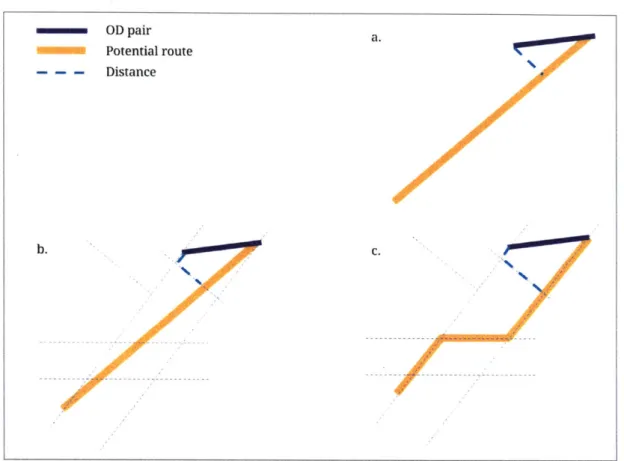
6-2 Some spatial representations of potential routes . . . . 62
6-3 Overview of Part 2 of the corridor identification methodology . . . . 63
6-4 Example of defining corridor shape to account for a barrier . . . . 66
6-5 Potential routes that can be generated from a single OD pair by shifting position of OD pair in the route . . . . 67
6-6 Potential routes that can be generated from a single OD pair within a specifed range of lengths . . . . ... . . . . 67
6-7 Possible spatial representations of OD pairs . . . . 68
6-8 Evaluating distance from OD pair to route . . . . 69
6-9 Corridor angle restriction . . . . 70
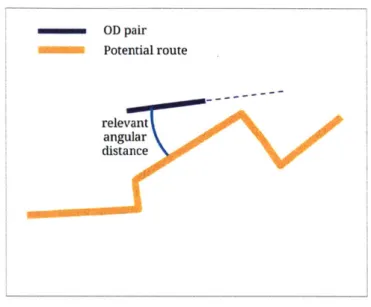
6-10 Relevant angular distance . . . . 71
7-1 Distribution of access distance to first bus stop . . . . 78
7-2 Silhouette scores for different numbers of clusters . . . . 79
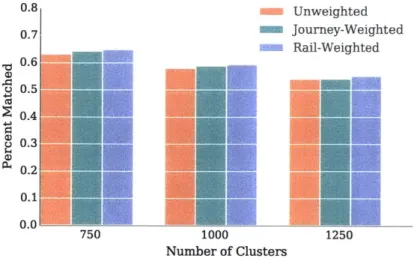
7-3 Postcode and stop (station) match rate by weighting method . . . . 80
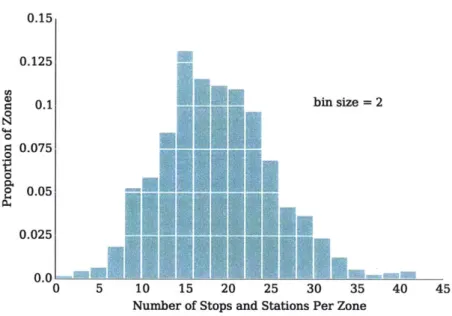
7-4 Distribution of rail stations and bus stops per zone . . . . 81
7-5 Central London zones . . . . 82
7-6 Existing zonal schemes . . . . 83
7-7 Map of all zones displaying total AM peak boardings per zone . . . . 83
7-8 Histogram of journey start times . . . . 84
7-9 Map highlighting Central London zones . . . 85
7-10 Distribution of journeys per OD pair . . . . 86
7-11 All AM peak journeys by mode and stages . . . 87
7-12 AM peak journeys by mode and stages, excluding Central London and in-cluding sample size and distance constraints . . . . 88
7-13 Joint distribution of distance and bus directness ratio . . . . 90
7-14 An OD pair that is misrepresented by the bus directness ratio . . . . 91
7-15 Joint distribution of distance and the difference between bus distance and shortest path distance . . . . 92
7-16 Comparison of ODX-inferred and LTS-modeled public transport demand . . . 95
7-17 Actual demand compared to fitted demand . . . . 96
7-18 In-vehicle time as a portion of total trip time . . . 97
7-19 Modes and stages of journeys on
OD
pairs identified for improvement . . . 987-20 Distribution of bus route lengths . . . 100
7-21 Distribution of average hourly flow for existing routes . . . 101
7-22 Corridors identified in the base case . . . 103
7-23 Corridors identified with m and m' reduced to 1.05 . . . 103
7-24 Corridors identified with a reduced to 0.6 miles . . . 104
7-25 Corridors identified with elasticity increased to -0.8 to -1.0 . . . 105
7-26 Corridors identified with maximum distance reduced to 0.35 miles . . . 106
7-27 Corridors identified with angle restricted to 15 degrees . . . 107
7-28 Corridors identified with length parameters relaxed . . . 107
7-29 Corridors identified with minimum flow parameter increased to 60 passengers per hour ... ... ... 108
7-30 Corridors identified in "restricted distance and angle" and "increased flow" scenarios... .. ... 110
7-31 Modes and stages for journeys on
OD
pairs included in Corridor 1 . . . 1137-32 Demand and travel time savings on Corridor 1 . . . 114
7-33 Existing routes serving Corridor 1 . . . 115
7-34 Existing alternatives for
OD
pair on Corridor 1 . . . 1157-35 Proposed route to serve Corridor 1 . . . 117
7-36 Zones assigned to corridors 4ad and 4f . . . 118
7-37 Demand and travel time savings on Corridor 4f . . . 119
7-38 Modes and stages for journeys on
OD
pairs included in Corridor 4f . . . 1207-39 Existing routes serving Corridor 4f . . . 120
7-40 Proposed route to serve Corridor 4f . . . 121
7-41 Demand and travel time savings on Corridor 6 . . . 123
7-42 Updated Corridor 6 with existing routes . . . 124
7-43 Modes and stages for journeys on
OD pairs included in Corridor 6
. . . 125List of Tables
3.1 Inputs, parameters, and outputs by step . . . 41
7.1 Average zone size by number of zones . . . 77
7.2 OD pairs classified as circuitous for different m and a . . . . 92
7.3 Direct demand model regression results . . . 95
7.4 Base scenario parameters . . . 102
7.5 Expected corridor demand and benefits per AM peak hour . . . .111
7.6 Estimates of demand from other sources . . . .111
Chapter 1
Introduction
As the world's population increasingly concentrates in urban areas, the importance of urban transportation solutions grows. Public transport systems have been shown to improve ac-cessibility in cities, increasing the locations people can move between in a given amount of time (Newman and Kenworthy, 1999). More broadly, well-planned public transport systems foster economic, environmental, and social benefits.
In a review of studies on the impacts of investment in transportation on economies, Bhatta and Drennan (2003) conclude that such investment generally results in economic benefits, including increased productivity and output, reduced costs of production, and increased incomes. In cities, agglomeration benefits produced by spatial concentration of economic activity, are of particular note (Graham, 2007). Evidence suggests that public transport plays a critical role in enabling the density of activity that produces these benefits (Venables, 2007). From an environmental perspective, shifting travel from single-occupancy vehicles to public transport, helps achieve energy conservation and emissions reduction goals (Shapiro et al., 2002). Therefore, many cities seek to encourage public transport use to promote sustainability. Effective public transport systems also support equity, as they enable individuals who cannot drive or cannot afford to own a car to be mobile.
Good public transport systems are fast, convenient, and comfortable. Planning an effec-tive public transport system includes decisions ranging from strategic to operational. At the strategic level, planners determine the public transport network design, consisting of routes and lines and the connections between them. Good network design can be measured across many dimensions. Generally, metrics take either the passenger perspective, the operator perspective, or the system perspective.
Designing public transport networks that serve passengers well, adhere to operator con-straints, and improve the overall transportation system is challenging. In cities that have existing public transport networks, the network design needs are unique. Most existing methodologies for public transport network design aim to identify an optimal set of routes or lines without serious consideration of the existing network. While these methods can be effective in cities without existing public transportation, or in cases where planners wish to completely re-design the network, they do not serve the need for incremental improvement of established networks. In these networks, planners could benefit from guidance on strategies that can improve the network.
One important aspect of network design is circuity. Reducing deviation from the shortest path and/or eliminating interchanges can improve the quality of service. This dissertation presents a framework for bus network sketch planning. Specifically, the framework identifies
opportunities for new bus services in existing networks to reduce circuity and eliminate interchanges.
Section 1.1 defines sketch planning. Section 1.2 discusses the factors that motivate this research, including reducing circuity, and the need for network planning methodologies that can be applied to existing, multi-modal complex networks. Section 1.2 also identifies a special opportunity for new approaches to network planning using newly available information on complete journey origin-destination (OD) level travel. A case study, the London bus network, is introduced in Section 1.3. This if followed by descriptions of the objectives, approach, and major contributions of this research.
1.1
Sketch planning
Network design often begins with a sketch planning phase, which is the focus of this research. Sketch planning methods identify and select opportunities for network design changes, such as the introduction of new routes. Sketch planning often includes efficient methods to estimate costs and benefits of alternatives and select between them. In sketch planning, new routes or lines may be defined in an abstract way, leaving the exact design to later phases in the planning process. While many sketch planning approaches assume that alternatives are already defined, and therefore focus only on the evaluation of these alternatives, this dissertation proposes a framework for both the generation and evaluation of alternatives.
1.2
Motivation
A methodology that can be applied to an entire public transport network to identify oppor-tunities for improvement fills a gap in the public transport planning literature. Traditional approaches to public transport network design use partial optimization methods to identify the set of routes or lines which best serve a specified demand matrix, be it theoretical or observed. These approaches may produce a network that bears little resemblance to the existing network. As a result, in established networks, planners generally have little use for such results.
A complete redesign of an existing network is typically impractical for several reasons. First, it is costly. For rail networks, which require significant fixed costs to build, such a redesign is rarely considered. Even for bus networks, there are costs associated with new bus 'stop infrastructure, maps, and information provision. Of even greater importance, network changes are disruptive to passengers, who are accustomed to the existing network and will have to adapt to alterations. Passengers may also have chosen their home locations based on the existing public transport system. Similarly, businesses often take transportation in-frastructure into account when selecting locations. For these reasons, a total overhaul of the public transport infrastructure is generally impractical and is likely to be met with signifi-cant opposition. This is particularly true, because the expected results of public transport network design recommendations are subject to assumptions inherent in the methodolo-gies, and to the inputs used, and therefore are always subject to uncertainty. Planners are
(rightfully) reluctant to seek uncertain benefits in the face of such high costs.
Instead, in established networks, planners typically make incremental changes over time. While the issues related to cost, information, opposition, and uncertainty may persist with more minor changes, the magnitude of each issue is generally reduced. Planners are willing
to endure these costs to make needed changes to the network in light of changing demand. For good planning decisions, the benefits from such changes outweigh the associated costs. Improvements to the network help serve current passengers better and can draw new passengers to the network from other modes. In the longer term, these improvements may also induce new journeys. Network improvements can take many forms. Ceder (2007) groups the design strategies planners can use to improve service into five categories:
1. New forms of service such as express, zonal, and on-demand 2. Increased network coverage or span-of-service coverage
3. New and adjusted routing to connect routes, lines, or locations
4. New and adjusted scheduling, including interlining, coordination, and frequency
5. Improved amenities such as passenger facilities or vehicles
Determining how to apply these strategies in large public transportation networks is a complex task. Planners may use their own knowledge of the system, public input, or the results of performance analysis to decide which actions to take. They may also react to political pressure. Public transport agencies are unlikely to have the resources to analyze more than a small set of alternatives when deciding which changes to make.
For bus planning in particular, trial-and-error approaches are common (White, 1995). Because changes to bus services are significantly less costly than in the rail network, planners may pilot routes in order to assess the impacts. While this can be effective, it is clear that in large, complex networks, it is an inefficient method to identify those corridors that will provide the most benefits. This leaves an unaddressed need to systematically identify promising opportunities for improvement.
This dissertation provides a general framework for sketch planning based on systematic, network-level analysis to be applied in existing networks, and a detailed methodology for implementing one particular strategy identified by Ceder: new and adjusted routing to connect routes, lines, or locations. Ceder distinguishes between this strategy, and actions that increase coverage. While increasing coverage may also require new routes, the objectives are distinct. Increasing coverage expands the network to areas that were previously not served. The framework proposed in this dissertation is intended to be applied to an area that already has public transportation coverage. In areas that already have coverage, new services can either parallel existing ones, or follow new paths. While there may be some cases in which adding service that parallels existing routes or lines is desirable (for example, adding a bus route that parallels a rail line provides benefits to passengers who prefer bus to rail), generally redundant service is avoided. This framework focuses on the introduction of new routes to reduce circuity in the public transport network. The implementation of this strategy requires a network perspective, as is taken in this research.
1.2.1 Reducing circuity
Circuity in public transport can be measured in different ways. Often, it is measured as the level of deviation from the shortest path. Many measures incorporate the number of interchanges (or transfers) required to make a journey, and some include the number of stops. Public transport systems cannot provide direct point-to-point service for all origins
and destinations. Thus circuity will never be eliminated. However, reducing circuity is beneficial.
Huang and Levinson (2015) found evidence that commuters locate themselves in places where their commute trip will have low circuity, with circuity measured as the ratio of public transport distance to straight line distance. In addition, they found that public transport accessibility measures for 36 metropolitan areas were negatively correlated with circuity. This suggests that not only is circuity undesirable for specific trips, but it degrades the overall quality of the public transport system. In support of this notion, many graph theoretic metrics designed to assess public transportation networks characterize them in terms of circuity or directness (Garrison and Marble, 1964; Gordon, 1974; Derrible and Kennedy, 2010).
Interchanging, in particular, is widely regarded as a deterrent from public transport attractiveness and quality of service. Understanding the interchange penalty incurred when journeys require an interchange is the subject of a large body of research. While the penalty can be reduced by planning and operating actions such as coordination of service or high frequency of service, eliminating interchanges altogether is beneficial.
Introducing new services to eliminate circuity requires investment of money and re-sources. A methodology that systematically assesses and quantifies the benefits of new bus routes in terms of reduced circuity will help planners make decisions about adding routes to existing networks.
1.2.2 Bus planning in a multi-modal context
Developing such a methodology that can be applied to a large, complex, multi-modal public transport network is particularly challenging. Public transport networks often include heavy and light rail services that operate in conjunction with bus services. Bus routes may feed the rail system, or provide stand alone services. In some places, bus is an alternative to rail, particularly serving origins and destinations that require multi-stage rail journeys or serving journeys that originate (end) between rail stations. Buses typically stop more frequently than rail services, and therefore provide denser coverage that is especially important for passengers who are unable (or unwilling) to walk significant distances to access a rail station. A methodology for bus planning that accounts for multi-modal public transport journeys and origins and destinations served by multiple public transport modes is needed.
1.2.3 An opportunity for a data-driven approach
Currently, there is an opportunity for significant improvement in bus planning methods presented by the increasing availability of travel information at the origin-destination (OD) level. Automatic fare card (AFC) and automatic vehicle location (AVL) data are routinely collected in many public transport networks. Recently, methodologies have been developed to infer complete journey information from these data sources (Chu and Chapleau, 2008; Gordon et al., 2013). These methodologies can infer destination and interchange information for a large share of boardings that use fare cards, often upward of 70% (Gordon et al., 2013). Compared to
OD
data collected from surveys, which is generally collected for a small number of passengers on a few selected days, this vastly increases the sampling rate of public transportOD
information, improving estimates ofOD-level
demand and travel time, and enabling these estimates to be made at increasing levels of detail.OD data is important for evaluating circuity. It provides information on the paths indi-viduals choose, including the prevalence of multi-stage journeys. When there are multiple paths serving an origin and destination, journey data provides insight on the choices in-dividuals make. For example, it can identify cases when passengers choose circuitous bus paths even when more direct alternatives exist.
Detailed
OD matrices for modes outside of public transport rely on emerging data sources
and methods. GPS-equipped mobile devices can provide traces of individuals' movements and researchers are developing methodologies to infer the mode of travel from these traces (Stenneth et al., 2011; Zheng et al., 2008; Patterson et al., 2003). While these data sources and methodologies are promising, some hurdles remain before they can be widely applied. There are data quality, missing data (mobile devices are sometimes off or not reporting location), and data privacy and ownership issues that are the focus of ongoing study.Making use of these existing and emerging information sources for planning purposes requires new methodologies, including metrics and methods for evaluation and aggregation. This dissertation develops a framework for the use of
OD-level
information in bus plan-ning. In this framework, detailedOD
information for public transport journeys is critical, while detailed information about travel on other modes can enhance the application of the framework.1.3
London as a case study
The approach developed in this dissertation is applied to London's bus network, as an example. The London example contextualizes the need for a bus planning framework that can be applied to an entire network to identify opportunities for new services. London is densifying and growing, and has a vast and complex public transport network. Leaders in London recognize the need to support population and economic growth with transportation services. A framework that guides the growth of the bus network helps address this need.
Like many urban areas, London has experienced extensive population growth in recent years. From 2001 to 2011, the population grew at an average rate of 87,000 people per year. The population in 2011 was 8.2 million and is projected to continue growing to 9.3 million by 2021 and 10.1 million by 2036 (Greater London Authority, 2016). Some population segments are growing faster than others. The population over age 64 is expected to increase by 64% in the 2011 to 2036 time frame (Greater London Authority, 2016). The economy is also growing. The number of jobs in London is projected to increase from 4.9 million in 2011 to 5.8 million in 2036 (Greater London Authority, 2016). Overall incomes are growing and expected to continue to grow, but the distance between low-income and unemployed individuals and high-income earners is also increasing (Greater London Authority, 2016).
"The London Plan," (2016) authored by the Greater London Authority, states the goals of the Mayor of London, including ensuring that London is internationally competitive and establishing London as a world environmental leader. The document emphasizes maintaining a good quality of life for all Londoners and specifically notes the importance of a "providing a transport network enabling easy access to jobs, opportunities and facilities while mitigating
adverse environmental and other impacts."
London has an extensive public transport system that plays a critical role in urban mobility. The system includes the Underground, which opened in 1863 and serves 4.8 million passenger journeys per day (Transport for London), as well as the Overground, trams, Docklands Light Railway, and many National Rail lines. However, the greatest
number of passenger journeys are made on the bus network, which carries approximately 6 million passenger journeys on the average weekday on over 700 bus routes (Transport Committee of the London Assemply, 2013).
Public transport, in general, and the bus network in particular, play vital roles in mobility in London. Nearly 50% of Londoners use the bus at least two days per week (Transport Committee of the London Assemply, 2013). Demand for bus services grew from 1999 to 2013. In that period there was a 64% increase in bus journeys. However, from 2014 to 2017 bus journeys decreased by 5.4%, correlating with decreases in bus speeds in the same period (Transport for London, 2017). The greatest declines in bus speeds and ridership were observed in central London, and the 2017/2018 Transport for London budget states as an objective: "Matching bus capacity with demand by reducing the underused services in central London and reallocating them to where they are needed" (Greater London Authority, 2017).
Strategic planning is needed to ensure that the bus network continues to support mo-bility and attract new demand. "The London Plan" (2016) recommends "regular review of
[the]
bus network to cater for population, housing and employment growth, maintain ease of use, attractive frequencies and adequate capacity, reliable services, good coverage, effective priority and good interchange with other modes." It also emphasizes the need to improve links between town centers in Outer London including through orbital and radial bus ser-vices. The Transport Committee of the London Assemply (2013) reported that London boroughs are concerned that bus planning is primarily done on a route-by-route basis. They suggest there is a need for full-network area-based planning and evaluation of routes that cross borough boundaries.Given the vast size of the London public transport network, and the bus network in particular, ad hoc and trial-and-error approaches to planning are likely to be costly and have only limited efficacy. Planners recognize the importance of network-wide sketch planning to identify needs for bus services that cross borough boundaries and serve orbital journeys. Moreover, London has the public transport data needed to implement a data-driven planning approach. London collects extensive AFC and AVL data. The Oyster card, a smart payment card that was first issued in 2003, was used by approximately 80% of rail passengers and 90% of bus passengers by 2013 (Gordon et al., 2013). Data used for the London application of the framework is discussed in more detail in Chapter 7.
1.4
Objectives
The objective of this research is develop a framework for the use of OD-level data in sketch planning. More specifically, a methodology is required that identifies opportunities for new bus routes that can be added to an existing network to provide incremental service im-provements by reducing circuity and interchanges. The methodology should systematically analyze the full network to identify opportunities. It should not require planners to spec-ify alternatives, but rather should identspec-ify them based on the analysis. It should quantspec-ify expected benefits of the corridors identified to help planners choose between potential corri-dors. Finally, the method must be flexible in order to account for differences between cities and networks and variation in planner priorities.
Figure 1-1: Approach
1.5
Approach
This dissertation proposes a framework for the use of OD travel information in planning consisting of three steps, summarized in Figure 1-1. The general approach can be applied to a variety of planning objectives, such as improving coverage, improving reliability, or addressing crowding. The OD-level analysis and the type of aggregation will be particular to each objective. Here the approach is applied to bus network planning and specifically to the addition of new bus services to an existing network.
The first step is to define the network as a set of OD pairs, which requires the definition of zones. The second step is to perform analysis at the OD level. The analysis characterizes OD pairs using metrics that quantify their performance and opportunities for improvement in terms of a specified planning objective. At this stage, OD pairs can be filtered based on these characteristics. In the specific methodology proposed in this dissertation, OD pairs are assessed in terms of the directness of existing services, and the expected benefits of a new direct bus service are estimated for each pair.
While OD-level analysis captures current passenger experiences adeptly, it is usually too disaggregate to be used directly to inform planning decisions. The third step in the approach aggregates the OD-level information to a unit of analysis that is appropriate for bus network planning. For the identification of opportunities for new bus service to reduce circuity, OD pairs are aggregated into corridors, each of which can be served by a single bus route. Expected benefits are estimated at the corridor level and used to prioritize the corridors identified.
Distinctive features of the approach, which makes it useful for many network planning decisions, are the analysis at the OD-level, and the aggregation of OD-level information to generate corridors. This is a departure from more traditional analysis of either existing routes or zones. Traditional corridor analysis of existing routes or groups of routes, is unable to analyze multi-stage journeys or the impacts of path alternatives outside the corridor. Zone level analysis usually considers services within a zone (such as density of stops or stations) or analyzes journeys entering (or leaving) a zone. This can miss important OD-level effects. For example, a zone may have a high density of bus stops but is served only by east-west bus lines. If individuals wish to travel north-south, they may have to endure longer access distances and/or in-vehicle travel times. Whenever performance depends on both origin and destination, and particularly in any system with multi-stage journeys and multiple paths, an OD approach can capture passengers' experiences much more fully.
While there are existing examples of the use of OD-level data to understand performance and passenger experience (See Chapter 2), the methodologies generally do not extend to service planning. By aggregating OD pairs into potential corridors, this method directly
21
Defle OD pairs
OD-Level
Analysis:
Estimate potemua
bendats and filter
OD pairs
(Spatially)
-ate
to generate planning
translates
OD-level
understanding into planning recommendations.1.6
Contributions
The framework presented in this dissertation enables planners to use
OD
travel data to make decisions about network design. Compared to existing partial optimization methods for public transport network design, this methodology is more appropriate for guiding incre-mental improvements in existing networks. The framework uses granularOD
travel data, which enables accurate and detailed analysis of performance and develops a procedure for aggregating this information to a meaningful level in order to use it for planning decisions, enabling these decisions to be made based on a systematic understanding of the full network. The framework includes a method for clustering individual journey data into zonalOD
pairs. These zonalOD
pairs form the building blocks for the definition and selection of corridors. The corridor identification algorithm developed in this dissertation generates alternatives for bus services. This is an improvement over ad hoc methods for generating potential corridors for new services.As discussed in Section 1.2.1, reducing circuity is beneficial in public transport networks. This research contributes methodologies for evaluating OD pairs in terms of directness of service. In addition, it proposes methods for quantifying the expected benefits of improved directness for
OD
pairs and corridors. The dissertation also discusses how information about a particular network, such as access distance distributions and desired bus route length can be used to adjust parameters used in the OD analysis and corridor identification processes. This results in a framework that is sufficiently flexible to be applied to many different networks.1.7 Dissertation outline
Chapter 2 summarizes prior research on public transport network design, sketch planning, analysis of
OD
travel data, and clustering and aggregation methods. An overview of the framework is provided in Chapter 3. Chapters 4 through 7 discuss the zonal definition, OD analysis, and corridor identification methodologies in more detail. The application to London's public transport network is presented in Chapter 7, and concluding remarks are offered in Chapter 8.Chapter 2
Literature review
The design of public transport systems is the subject of a large body of research. In the literature, public transport network planning is typically divided into five steps: network design, frequency setting, timetable development, vehicle scheduling, and crew scheduling (Ceder and Wilson, 1986). Most methodologies address a single step in this planning process, although Sch6bel (2017) proposed an integrated method for line planning, timetabling, and vehicle scheduling.
The first step, the design of routes, is the subject of the framework presented here. The design of routes can be at the route, group of routes, or full network level (Ceder, 2007). The objective of this research is to design a framework that can be applied to a full existing network to identify corridors for new bus services. There are many approaches to full network design, summarized in Section 2.1. However, these methods generally do not fully and realistically capture the intricacies of real, complex networks. Moreover, they are intended for complete network re-design, which is rarely the objective for planners in existing, well-established public transport networks.
In existing networks, planners are more likely to employ sketch planning methods to efficiently compare alternatives for incremental network improvements. Examples of such methods are summarized in Section 2.2. These methods generally assume that a set of alternatives exist, and focus on selecting the best alternative(s) from the set. The frame-work presented here improves on these methods by systematically generating and evaluating alternatives for new bus services.
The framework relies on new origin-destination (OD) level travel data, including data from automated fare collection (AFC) systems. Smart card data has been used to gain an improved understanding of passenger behavior and travel patterns, as discussed in Section 2.3. Methods that infer complete multi-stage journeys from automated vehicle location (AVL) and AFC data enable analysis of OD level flows. The framework extends research that uses AFC and AVL to improve understanding of travel behavior, by using this data to inform planning decisions.
Achieving this objective requires aggregation of discrete
OD-level
data. The methods proposed in the framework build on methodologies including graph theoretical models and spatial and non-spatial clustering techniques described in Section 2.4.2.1
The Transit Network Design Problem
The Transit Network Design Problem (TNDP) is usually formulated as an optimization problem consisting of an objective function and constraints. Some methodologies are tai-lored for a specific mode, either bus (Ciaffi et al., 2012; Bielli et al., 2002) or rail (Guan et al., 2006), while others have been developed for general application to public transport networks (Bagloee and Ceder, 2011). The methodologies aim to identify a set of optimal or approaching-optimal routes. In general, these methods assume the network will be de-signed from scratch. Advancements in both computing and algorithm development have allowed partial optimization and heuristic methods to be demonstrated for actual networks. However, Ceder (2007) notes that in practice, partial optimization methods that researchers have developed are rarely applied. He states that this implies a need for methods that are ''more practical and less complex".
The inputs to the TNDP are OD demand matrices and network topology (either idealized or existing roads and physical barriers). Early versions used ideal networks rather than real inputs. Hasselstrom (1981) developed a method designed to use detailed OD matrices. Most methods also incorporate demand models to assign demand to proposed routes or lines. Hasselstrom (1981) originally used a direct demand model. Later, a route choice demand model was added to his method (Jansson and Ridderstolpe, 1992). Yan et al. (2013) incorporated stochastic travel time estimates to make the demand assignment and evaluation process more realistic, and Ng and Lo (2016) proposed a robust model, using lower, mean, and upper bound demand estimates in network design.
Network topology may be represented as a set of potential nodes and links, or may be a full representation of actual road topology (Guihaire and Hao, 2008). Hasselstrom's method requires users to specify terminals of routes, as does the method proposed by Baaj and Mahmassani (1995). Ceder (2001) uses heuristics to develop a skeleton network. Similarly, Carrese and Gori (2002) assume a skeleton network and develops a method to identify feeder routes.
Good public transport network design can be defined in a variety of ways, which is reflected in the diversity of objective functions in different methodologies. Ceder (2001) notes that there are multiple perspectives on network design: that of the operator, that of the passengers, and that of the community. His method defines metrics for each of these perspectives and optimizes with, respect to all three. Travel time or travel time savings are commonly used as the criterion for optimization, while Ceder's method also includes waiting time, empty seats, and deviation from the shortest path. Most methodologies also include a set of constraints including fleet size, line length, number of lines, coverage, and percent of demand that is unsatisfied (Yan et al., 2013). Performance aspects, including directness, are sometimes included as either constraints or objectives (Guihaire and Hao, 2008).
A variety of approaches have been proposed to solve these problems, including neigh-borhood search algorithms, and evolutionary algorithms (Guihaire and Hao, 2008). All methodologies make use of heuristics to simplify either the input topology or the optimiza-tion problem. As a result they are considered partial optimizaoptimiza-tion approaches (Guihaire and Hao, 2008). Bielli et al. (2002) used geometric shapes to define a set of possible routes with emphasis on routes connecting large demand modes. Cipriani et al. (2012) defined three types of routes (high-demand direct routes, connector routes, and existing routes) to guide the optimization process. Bagloee and Ceder (2011) used data to inform the heuristic step. They clustered demand to identify locations for bus stops.
to actual networks. Bagloee and Ceder (2011) applied their method to the Winnipeg bus network and to the Chicago rail network. Guan et al. (2006) applied theirs to a simplified version of Hong Kong's MTR network. Ciaffi et al. (2012) defined a skeleton and feeder network in their methodology which identifies a set of routes to serve a given station. They applied the methodology to a suburb of Rome currently served by 15 routes. They report a running time of approximately 15 hours for this application.
Most methodologies can be applied to existing or new networks, but are intended for full network redesign. As an example, Cipriani et al.'s method considers existing routes in the choice set of all possible routes, but the method is not intended to augment or improve the existing services, but rather find the best set of routes to serve as a full network. In the application of their framework to Rome, only 20% of existing routes were kept. The design from scratch or full network redesign approach is one reason that the methods in the TNDP literature are rarely applied.
2.2
Sketch planning and decision support tools
Much more commonly applied are sketch planning methods and decision support tools for network planning. Sketch planning consists primarily of efficient and effective methods to evaluate early stage alternatives, such as new routes or lines or extensions. These meth-ods are designed to help planners systematically choose between alternatives. Cascetta and Carteni (2014) developed a way to use EU standards to evaluate public transport propos-als. They developed measures to evaluate performance including accessibility, travel time, comfort and security and propose methods to estimate each metric for planned projects.
Deakin et al. (2004) present a methodology developed by Bay Area Rapid Transit (BART) planners for initial sketch planning consisting of demand estimation, cost approx-imation, identification of possible station locations and access needs, evaluation of impacts on the existing system, and consideration of community support. This evaluation framework serves as an initial filter to determine if the project merits further study. This provides a systematic evaluation of proposed services, but does not include a method for identifying opportunities for new services. In a rail network like BART, the options for new service are likely limited, making this aspect less important. However, in large, complex bus networks, the opportunities for network expansion can be vast.
One example of the use of performance indicators to identify improvement opportuni-ties comes from highway infrastructure planning in Minnesota. Planners prioritized existing corridors based on demand, growth trends, and connections to regional trade centers. Pri-oritized corridors were evaluated on how closely actual speeds matched target speeds along the corridor. This process identified corridors for improvement. Planners then identified improvement strategies for these corridors ranging from construction of new roads or public transport services, to travel demand management, and pricing (Zemotel and Montebello, 2002).
Another framework for incorporating performance measures into transportation planning is presented by Miller et al. (2013). They define livability indicators and propose methods for weighting and aggregating the indicators at the community level (Miller et al., 2013). They suggest that these indicators can be used in transportation policy and planning to track performance and select between alternatives. Shah et al. (2013) present a diagnostic tool for transportation networks at the metropolitan level. They make comparisons across cities to benchmark performance and identify key problems and discuss the planning implication
of these results.
Other decision support tools do not make recommendations about specific improvements, but rather make recommendations about network design more generally. Daganzo (2010) proposed a methodology to determine the appropriate network shape (grid or hub-and-spoke) and modes (bus, BRT, or metro) to produce desired performance, given network size and demographics. Badia et al. (2016) compared the performance and cost of four different network structures (radial, direct trip-based, grid, and a hybrid transfer-based system) given various idealized spatial travel patterns. Compared to the framework presented in this dissertation, the recommendations from these methodologies require more interpretation and analysis to be translated into planning decisions, particularly in networks that already have public transport service.
2.3
New sources of travel data
New sources of data present an opportunity for new sketch planning and decision support tools. While automated vehicle location (AVL) systems have been incorporated in public transport systems for several decades, the early 2000s saw a rapid adoption of contactless smart cards for public transport fare payment (Deakin and Kim, 2001). Automated data
collection systems for AVL and smart card data have been lauded as a source for better estimates of existing measures and the development of new measures (Wilson et al., 2009).
Tr6panier et al. (2009) demonstrated the estimation of a variety of supply-oriented mea-sures (vehicle-kilometers, vehicle-hours), demand-oriented meamea-sures (passenger-kilometers, passenger-hours), and measures that combine supply and demand (bus occupancy) from
smart card AFC systems. Uniman et al. (2010) developed new metrics for service reliability based on AFC data. Pelletier et al. (2011) affirmed that smart card data can be informative for strategic, tactical, and operational planning of public transport systems.
Utsunomiya et al. (2006) combined smart card data with personal information provided by passengers to analyze typical patterns for different user groups and develop profiles for users of specific stations. Morency et al. (2007) analyzed the regularity of daily patterns and classified passengers based on their public transportation usage. Bagchi and White (2005) analyzed smart card churn to inform targeted campaigns to retain passengers. These studies can inform decisions about advertising, promotions, and fare structure.
Other studies provide information that can inform operations and service planning. Csikos and Currie (2008) analyzed arrival patterns at heavy rail patterns to understand how unreliability affects waiting time. Zhu (2014) used AFC data, including passengers' station entry and exit times, and train tracking data to assign passengers to specific trains. Guo (2008) used AFC data to estimate transfer penalties and explain path choice.
Smart cards record passengers' entries and (in some cases) exits from the public trans-portation system. Several researchers have developed methodologies to reconstruct indi-viduals' itineraries, inferring origins, destinations, and transfers, based on AFC and AVL data (Chu and Chapleau 2008; Gordon et al. 2013). In networks where smart card usage is prevalent, these itineraries can provide a comprehensive picture of public transport travel. This creates opportunities for analysis of full, multi-stage journeys.
Vanderwaart (2016) developed a framework for using complete
OD-level
journey data for service planning. The framework consists of five steps. First, target locations are selected based on economic, demand, accessibility, and congestion factors. Once target locations are identified, they are analyzed in terms of speed, mode, transfers, journeys per capita, andtravel time variability. Then, service changes are proposed either in terms of system structure or system performance. Finally, the service change proposals are evaluated in terms of costs and benefits. She also emphasized that the service planning framework should include a review of service changes after they are implemented.
Compared to Vanderwaart's research, the framework presented here focuses on generat-ing service alternatives directly from the data, rather than relygenerat-ing on planner judgment to interpret statistics and maps. This makes the framework presented here more appropriate for very large and complex networks. To do so, this framework focuses on a specific service change: the addition of new bus routes, rather than the diverse service changes considered in Vanderwaart's framework.
Mobility data is also increasingly available from GPS-equipped mobile devices, primarily mobile phones. Hung et al. (2015) developed a methodology to infer complete trajectories from GPS-equipped mobile devices. Calabrese et al. (2010) used mobile phone data to an-alyze travel patterns of people attending special events. This type of data is not widely available for all cities due to ownership and privacy issues, and is not used in the imple-mentation of the framework presented here, as it is not strictly necessary. However, mobile phone data could augment the framework by providing additional information on demand outside the public transport system and on the access and egress portion of public transport journeys.
With the exception of Vanderwaart (2016), the existing research uses
OD
travel data primarily to understand travel behavior and patterns rather than to make planning decisions. The framework presented here focuses directly on the planning implications, usingOD
travel data to generate corridors that are candidates for new bus service.2.4
Aggregation, clustering, and statistical methods
In order to use
OD
data for sketch planning, methods are needed to convert the data into planning recommendations. Ackoff (1989) summarizes this process in four steps, the progression from data to information to knowledge to wisdom. Ackoff (1989) defines data as the most direct representation of objects or events. Information is also a representation of these objects or events, but the representation has become more compact and useful through data processing. Knowledge is the use of information to generate instructions, answering questions about how to do something. Finally, understanding is the explanation for the instructions, an answer to questions about why to do something.Andrienko et al. (2008) delve into the process of converting data to information in a summary of methods for visualizing large spatio-temporal data sets. They note that some data can be visualized through direct depiction, with each record presented visually, but large data sets become illegible when all data is depicted. In these cases, researchers use two types of methods to visualize data: summary methods and pattern extraction. Summary methods consist of aggregating, generalizing, and in some cases sampling to extract abstract summary statistics. These statistics may be summarized in plots or figures, but the spatial elements of the data set are not directly displayed. Pattern extraction methods consist of analysis that is dependent on the spatio-temporal representation of the data (Andrienko et al., 2008). Pattern extraction methods serve as the basis of the corridor identification methodology in this framework. In another review of visualization methods Rae (2011) notes that these methods must strike a balance between simplicity and complexity.
2.4.1
Modeling networks as graphs
Much of the early work on network structure addresses this challenge by modeling trans-portation networks as graphs composed of nodes and edges. Garrison and Marble (1964) defined summary metrics to assess connectivity of transportation networks that can be es-timated from a graph. Other studies built on these measures to characterize network shape and levels of circuity (Gordon, 1974), and critically evaluate network structure (Vuchic and Musso, 1991). More recently, Derrible and Kennedy (2010) used concepts from graph the-ory to develop indicators of the maturity of a network, the relationship of the network to the built environment, and the network directness. They applied the metrics to 33 metro networks and classified them by accessibility and coverage.
Highly complex graphs cannot be visualized with every node and edge depicted. For use in planning, information from the graphs can be summarized through statistics, or the graphs can be simplified. Holten and Van Wijk (2009) developed a sophisticated method to simplify directed graphs intended primarily for visualization. The method models graph edges as springs and assesses the compatibility of edges based on angle and length. Similar edges are grouped to reduce visual clutter, allowing flows to be more legible than if each edge was depicted individually. While this methodology can aggregate a large number of edges, it is effective only for reasonably small number of nodes.
Girardin et al. (2008) used mobile phone and geo-referenced photo data to identify the main points of interest for tourists in Rome, Italy. They then visualized the desire lines connecting the points of interest. Limiting the points of interest makes the visualization possible. Nielsen and Hovgesen (2005) use a grid-based approach to visualize a large OD data set of community trips in Denmark. Each trip is represented as a desire line connecting origin to destination. Then, the map is divided into a grid and desire lines passing through, originating, and ending in each grid square are aggregated to a single statistic representing the overall commuting flow in that square. They applied a similar method to commuter trips in England and Wales (Nielsen and Hovgesen, 2008).
2.4.2 Clustering
Many of the methods that summarize or identify patterns from data rely on clustering techniques, which group data based on feature similarities. These include density-based methods, hierarchical methods, and partitioning methods.
Density-based methods assume that the data consists of a mixture of points drawn from many different probability distributions, with each cluster representing a specific distribu-tion. The algorithms grow initial clusters as long as the density in the neighborhood of the clustered points meets a density threshold (Maimon and Rokach, 2005).
Hierarchical clustering methods either merge or divide data points into clusters using rules about cluster linkage, which define the distance between clusters. Hierarchical meth-ods are flexible and can identify non-isotropic clusters including chain-like or concentric clusters. However, they have non-linear complexity, meaning they may not be appropriate for clustering large data sets (Maimon and Rokach, 2005).
Partitioning methods begin with an initial partitioning and then reassign data points based on feature similarity. They typically require the user to specify the number of clusters. The k-means algorithm is the most used partition method and works well for data that forms isotropic, convex clusters. It is unable to accurately identify non-convex clusters such as concentric circles or clusters that are highly variable in size (Maimon and Rokach, 2005).