MODELING THE
EFFECTS OF FOREST
MANAGEMENT
AND CUMA TE
CHANGE
ON CARBON DYNAMICS IN
CANADA
'
S
BOREAL
FORESTS
DISSERTATION
PRESENTED
AS
PARTIAL REQUIREMENT
OF
THE
DOCTORA TE OF
ENVIRONMENT AL SCIENCES
BY
WEIFENG WANG
Avertissement
La diffusion de cette thèse se fait dans le rèspect des droits de son auteur, qui a signé le formulaire Autorisation de reproduire et de diffuser un travail de recherche de cycles supérieurs (SDU-522 - Rév.01-2006}. Cette autorisation stipule que «conformément à l'article 11 du Règlement no 8 des études de cycles supérieurs, [l'auteur] concède
à
l'Université du Québecà
Montréal une licence non exclusive d'utilisation et de publication de la totalité ou d'une partie importante de [son] travail de recherche pour des fins pédagogiques et non commerciales. Plus précisément, [l'auteur] autorise l'Université du Québecà
Montréalà
reproduire, diffuser, prêter, distribuer ou vendre des copies de [son] travail de rechercheà
des fins non commerciales sur quelque support que ce soit,y
compris l'lntern~t. Cette licence et cette autorisation n'entraînent pas une renonciation de [la] part [de l'auteur]à
[ses] droits moraux nià
[ses] droits de propriété intellectuelle. Sauf entente contraire, [l'auteur] conserve la liberté de diffuser et de commercialiser ou non ce travail dont [il] possède un exemplaire.» ·MODÉLISATION DES
EFFETS
DE L'AMÉNAGEMENT FORESTIER
ET
DES
CHANGEMENTS CUMA TIQUES
SUR LA DYNAMIQUE DU
CA
RBON
E
DANS LES FORÊTS BORÉALES DU
CANADA
THÈSE
PRÉSENTÉE
COMME EXIGENCE PARTIELLE
DU DOCTORAT EN
SCIENCES DE L
'
ENVIRONNEMENT
PAR
WEIFENG WANG
This work was financially suppotted by the Natural Sciences and Engineering Research Council of Canada (NSERC) Strategie Project Grant, the Strategie Network (ForValueNet), and FPinnovation.
I would like to gratefully and sincerely thank my supervisor, Dr. Changhui Peng, for his guidance, patience, and understanding during my Ph.D. study at the Université du Québec
à Montréal
(UQAM). I would like to extend the special thank to the other two members of my supervisory committee, Dr. Daniel Kneeshaw (Université du Québec à Montréal) and Dr. Guy Larocque (Canadian Forest Service, Laurentian Forestry Centre) for sharing their wisdom and enthusiasm.I also appreciate the friendship and support of members of the Laboratory of Ecological Modelling and Carbon Science. 1 am thankful to numerous colleagues for discussion, manuscript comments, and data support. Special thank to Brian Doonan for his help on English editing. 1 would like to thank my friends, Conny Garby, François Perreault, Mélanie Desrochers and Terence Epule for their translation hel p. 1 also would like to thank the entire Institut des Sciences de l'Environnement, UQAM, for providing an outstanding academie environment and supporting efforts.
Finally and most importantly, 1 would like to thank my dear wife Xuehong Ma. Her support, encouragement, patience, love, and sacrifice made this work and everything else in my !ife possible. I greatly thank my parents, who have always supported, encouraged, and believed in me during these hard years.
This dissertation is comprised of six chapters (four main papers) that present and discuss the effects and implications of forest management on carbon dynamics in the boreal forest under climate change. Ali four papers involved in the dissertation are my original contributions to my Ph.D. study in Environmental Science at Université du Québec à Montréal.
Chapters 1 and VI are the general introduction and general conclusion, respectively. Chapters II to V are correspondingly based on the following four publications:
1. Wang, W., Peng, C., Zhang, S.Y., Zhou, X., Larocque, G.R., Kneeshaw, D.D. & Lei, X. (20 Il) Development of TRIPLEX-Management mode! for simulating the response of forest growth to pre-commercial th inn i ng. Ecological Modelling, 222,2249-2261.
2. Wang, W., Peng, C., Kneeshaw, D.D., Larocque, G.R., Lei, X., Zhu, Q., Tong, Q. & Song, X. (2011) Modeling the effects of various forest management regimes on carbon dynamics in jack pine stands under future climate., Canadian Journal of Forest Research, (Accepted after revision)
3. Wang, W., Peng, C., Kneeshaw, D.D., Larocque, G.R., Song, X. & Zhou, X. (2012) Quantifying the effects of climate change and harvesting on carbon dynamics of boreal aspen and jack pi ne forests using the TRIPLEX-Management mode!. Forest Eco/ogy and Management, 281. 152-162
4. Wang, W., Lei, X., Ma, Z., Kneeshaw, D.D. & Peng, C. (20 Il) Positive relationship between aboveground carbon stocks and structural diversity in spruce-dominated forest stands in New Brunswick, Canada. Forest Science, 57,506-515.
I developed ali hypotheses with my Ph.D. supervisor, Dr. Changhui Peng. I designed the new forest management sub-model under the framework of TRIPLEX and
programmed the mode! code with C++. After the mode! development, l conducted the mode! validation and data analysis as weil as published five peer-reviewed journal papers (first author) and the dissertation. Dr. Daniel Kneeshaw and Dr. Guy Larocque constantly advised and discussed with me about my Ph.D. project, and commented on early versions of the manuscripts and this dissertation. Dr. Xiangdong Lei discussed and commented on the initial versions of the manuscripts for Chapter II, Chapter III, and Chapter V. Dr. Xiaolu Zhou helped to explain the mode! code and discussed the programming problems. Dr. Qiuan Zhu compiled the climate data used in Chapter Il and III. Dr. S. Y. Zhang and Dr. Queju Tong provided the forest thinning data used in Chapters 11 and Ill. Dr. Xinzhang Song discussed and commented on early versions of the manuscripts in Chapters Ill and lV. Ali coauthors contributed comments and suggestions, greatly improving the quality of the papers.
LIST OF TABLES ...
...
...
...
..
...
...
...
... xiii
LIS
T OF
FIGURES ...
..
...
..
...
.. xv
RÉSUMÉ ...
...
...
...
... xix
ABSTRACT ...
....
....
..
...
..
...
...
....
...
...
..
...
..
...
...
...
xx
i
CHAPTER 1
GENERAL
INTROD
UCTION ...
..
...
....
...
11
.
1 Backgro
und ...
..
...
...
..
..
....
...
..
...
..
...
...
...
...
...
..
...
1
1
.
1
.1
Climate change and
the boreal forest..
...
..
....
..
...
...
1
1.1.2 The
rot
es of
sustainable forest manage
ment under climate change ... 3
1
.2 Modeling forest
manage
ment
activities ...
....
...
..
5
1.
2.
1
Modeling forest thinnin
g ...
..
...
...
..
...
... 6
1
.2.2 Mode! ing forest
harvesting ...
..
...
...
..
...
...
..
...
..
... 8
1.3
General questions and
hypotheses ...
... 9
1.4 Specifie objectives and
thesis structure
...
..
..
...
...
..
..
....
....
..
...
.... 10
CHAPTER
II
D
EVELOPMENT OF TRIPLEX-MANAGEMENT MODEL
FOR
SIMULA TING THE
RES
PON
SE
OF FOREST GROWTH TO
PRE-COMMERCIAL THINNING ..
...
...
....
....
...
....
...
...
...
...
...
...
..
... 1
3
2.1
Résumé ...
...
...
....
...
...
14
2.2
Abstract ....
...
..
...
..
....
..
..
....
...
...
...
...
...
... 1
5
2.3 Introduction ..
....
...
...
...
....
...
..
... 1
6
2.4
Methods ...
..
...
....
...
...
....
...
...
...
...
...
....
...
...
..
....
...
18
2.4.
1
Mode!
development ...
.
...
..
..
....
...
...
...
...
... 18
2.4.2 Sites ...
...
...
...
...
..
....
...
...
.
...
..
...
.
.
....
...
...
... 26
2.4.3 Simulation
experiments ...
.
..
..
....
...
...
....
...
..
...
."
... 28
2.5
Results ...
...
...
...
...
...
...
...
...
...
... 33
2.5 .
1
Diameter distribution comparison ... 33
2.5.2 Stand
characteristic comparison ..
....
...
... 35
2.5.3
Stand
biomass compari
so
n ...
...
...
... 38
2.5.4 Sensitivity to PCT treatment.. ...
...
..
...
....
.... 40
2.6 Discussion ...
...
...
..
...
...
..
...
..
....
...
...
... 42
2.6.
1 Thinning routines
...
...
...
....
...
...
....
...
..
...
...
...
...
.... 42
2.6.2 Diameter distribution and PCT ...
...
...
....
...
... 42
2.6.3 Forest growth,
yie
ld, and PCT ...
.
... 43
2.6.4 Potential application and future work ...
... 45
CHAPTER
I1I
MODELING THE
EFFECTS
OF
VA
RIO
US
FOREST MANAGEMENT
REG
IM
ES
ON
CARBON
DYNAMICS IN JACK
PI
NE
STANDS
UNDER
FUTURE CL
IM
ATE ...
.
...
.
.
....
...
....
...
...
..
...
..
..
...
...
.
...
.
...
.
..
..
.
47
3.
1 Résumé .
...
..
..
.
...
.
..
.
...
.
.
..
.
...
..
....
...
...
....
...
48
3.2 Abstract.
...
...
..
.
...
...
....
...
...
...
.
..
.
....
..
...
...
..
...
....
...
....
..
..
...
...
..
..
... 49
3.
3
Introduction ...
..
..
...
...
...
...
...
..
..
.
.
.
...
...
.
.
..
.
.
...
..
.
.
...
50
3.
4 Method
s
...
.
..
..
.
....
.
....
...
.
..
...
.
.
...
....
.
..
...
.
....
....
...
...
.
.
.
..
..
.
...
51
3.4.
1
Stud
y s
ites
and data co
llect
i
on ...
..
...
...
...
...
.
.
...
...
.
..
...
..
.
....
...
..
.
.
..
... 5
1
3.4.2
The
ln
odel
...
..
...
...
...
.
.
...
.
...
...
.
...
...
....
...
..
.
...
....
...
..
... 54
3.4.3 Harve
s
t co
nsiderations and regeneration input
s
in
si
mul
ation
s
...
...
.
...
.. 57
3.4.4 Simulation experim
e
nts ..
...
...
.
.
...
...
...
...
...
...
..
...
.
...
...
..
...
.
....
.
.
...
58
3.4
.
5 lndicators and
statistica
l analysis ...
..
..
.
.
.
.
.
....
..
..
...
....
...
..
...
..
.
...
...
61
3.5
Result
s
...
....
....
.
...
..
....
...
.
..
.
.
.
.
.
..
.
.
..
.
...
..
.
...
..
...
....
...
..
...
...
...
..
....
...
...
.
.
62
3.5.
1
Effects of climate change on C sequestration
...
...
...
.
..
..
....
...
..
...
62
3.5.2 Fo
rest man
age
ment effects on C seq
ue
stration
...
.
...
.
.
...
.
...
...
...
...
.
.. 66
3.5.4
Interactions betw
ee
n climate chan
ge
and
fore
st
mana
ge
ment
...
...
...
.
.
69
3.6 Discu
ss
ion ...
...
...
...
..
...
...
.
...
..
...
...
..
...
..
....
.
70
3.6.1
Boreal forest
C sequestration through changing climate conditions
...
70
3.6.2.
Rol
e of forest
mana
ge
ment under changing climate conditions
...
71
3.6.4 Madel
-
limitations and
non-simul
ated processe
s ...
...
...
.
...
.
73
3.7
Conclusions ...
....
....
...
...
...
...
...
...
.
...
....
...
...
.
...
..
....
..
.
.
.
..
...
...
...
73
CHA
PTER
IV
QUANTIFYING THE EFFECTS
OF
CLJMATE CHANGE AND
HARVESTING
ON CARBON DYNAM
ICS OF
BOREAL ASPEN AN
D JACK
PINE FORESTS
USING THE TRIPL
EX
-M
ANAGEMENT MODEL ...
..
....
...
.
...
..
..
.
..
....
.
75
4
.
1. Résumé ...
...
...
.
.
...
.
....
.
..
..
..
.
...
...
...
..
..
...
...
...
...
...
.
.
..
.
..
...
76
4.
2
Ab
s
tract.
...
.
...
...
...
..
.
..
...
...
...
...
....
.
.
...
...
77
4.3
Introduction .
.
...
.
..
...
...
...
...
...
...
...
.
.
.
..
.
...
..
...
.
.
..
...
.
.
78
4
.
4 Material and
methods ..
....
...
..
.
...
...
...
..
.
...
...
..
...
...
.
.
...
....
...
....
..
...
....
...
80
4.4.
1
Site description
..
.
.
...
.
...
...
...
..
...
...
...
..
...
..
.
...
80
4.4.2 The
model ...
...
.
...
.
..
.
...
..
...
...
.
...
...
.
.
....
...
.
...
8
2
4.4.3 Mode!
validation
...
..
...
...
...
....
.
..
....
..
...
.
.
...
.
...
.
...
...
..
...
84
4.4.4 Sim
ulation experiments
...
.
...
...
....
.
.
....
...
...
...
.
..
..
..
..
...
...
85
4.5
Results .
...
.
...
...
..
....
..
...
.
....
..
...
..
...
.
..
..
...
...
.
...
.
88
4.5.
1 Mode! validation ...
...
...
...
...
...
...
...
88
4.5.2 Effects ofclimate change on NEP
and
TEC
...
..
...
..
.
..
...
...
...
93
4.5.3 Effects
of clearcut on NEP and TEC
...
.
...
. 95
4.5.4
Combined
effects ofclimate change and clearcut on NEP and TEC
...
96
4.6
Discussion
...
...
..
...
...
.
...
...
...
...
...
...
...
..
...
..
...
.
.
...
96
4.6.1
Sensitiv
i
ty of
net ecosyste
m productivity to drou
g
ht
s ...
...
....
... 96
4.6.3 Harvesting effects on NEP and TEC ... 99
4.6.4 Implications for forest management ... 100
4.7 Conclusions ... 101 CHAPTER V POSITIVE RELATIONSHIP BETWEEN ABOVEGROUND CARBON STOCKS AND STRUCTURAL DlVERSITY IN SPRUCE-DOMINATED FOREST STANDS lN NEW BRUNSWICK, CANADA ... 107 5.1 Résumé ... 108 5.2 Abstract ... 109 5.3 Introduction ... Il 0 5.4 Data and n1ethods ... : ... ...... 1 12 5.4.1 Data ... 1 12 5.4.2 Aboveground C stock estimation ... 113
5 .4.3 Stand structural diversity indices ... 1 14 5.4.4 Statistical analysis ... 115 5.5 Results ... 118
5.5.1 Stand characteristics ... 1 18 5.5.2 Aboveground C stocks ... 118
5.5.3 Relationships between aboveground C stocks and structural diversity .... 121 5.6 Discussion ... 125 5.6.1 Aboveground C stocks throughout forest developmental stage gradients 125 5.6.2 Effects of species diversity on aboveground C stocks ... 125
5.6.3 Effects oftree size and height diversity on aboveground C stocks ... 126 5.6.4 Effects of combined structural diversity on aboveground C stocks ... 127
5.6.5 Implications for forest management initiatives ... 127 5.7 Conclusions ... 128 CHAPTER VI GENERAL CONCLUSIONS AND FUTURE DIRECTION ... 129 6.1 Summary of findings ... 129 6.1.1 Ecological modeling ... 129
6.1.2 Statistical analysis ... 131
6.2 Mode! limitations and future work ... 132
6.2.1 Natural disturbances ... 132
6.2.2 Population dynamics ... 133 6.2.3 Harvested wood C ... 133
6.3 Concluding remarks ... 134 REFERENCES ... 135
Table Page
1.1 Forest management algorithms from a selection of the most commonly
used process-based models, listed approximately in arder of progressive
increase in mechanistic detail... 8
2.1 Biomass equation parameters of Jack pine (from Lambert et al., 2005).... 26
2.2. Site information based on the study by Tong et al. (2005) ... 27
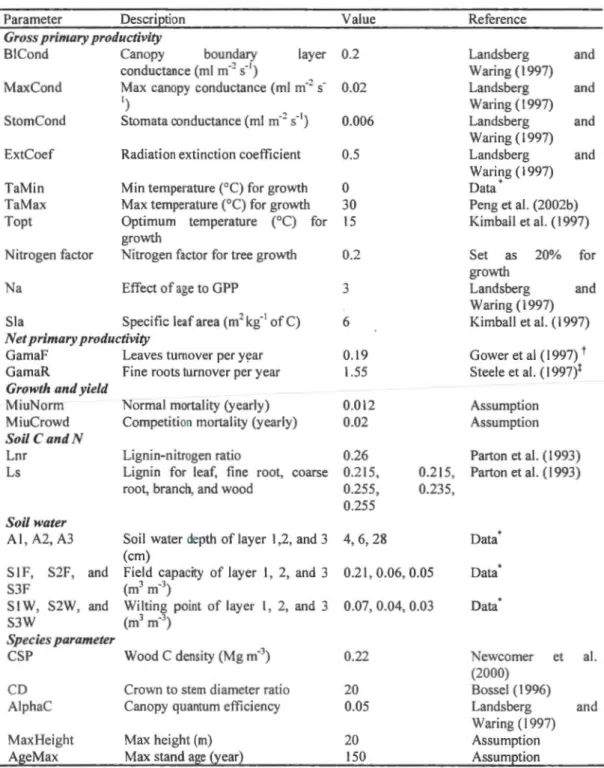
2.3 Parameters used in the madel simulations... 29
2.4 Estimated coefficients and their statistics ofEq. (7) using stepwise linear regression analysis (R Development Core Team, 2009) for Jack pine
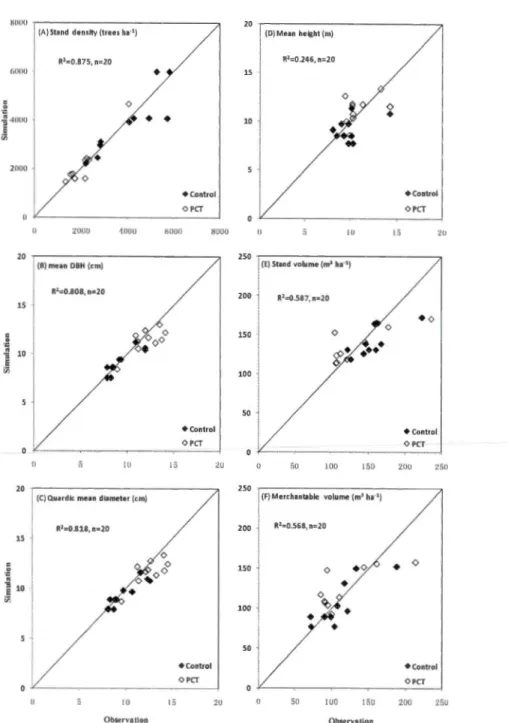
stands... 33 2.5 TRIPLEX-Management madel performance... 37
2.6 Predicted sensitivity of newly introduced key variables to changes in
thinning regime for three selected Jack pine stands (values are percent
change)... 41 3.1 Site information based on Tong et al. (2005) ... 53 3.2 Values of key species-specific parameters used in simulations of the
TRIPLEX-Management mode! ... 56
3.3 Summary of ANOVAs for analyses of climate change (CC) and forest
management (M) effects on net ecosystem productivity (NEP), total
carbon (TC), harvested wood carbon (HWC), total ecosystem carbon
(TEC), soil organic carbon (SOC), litter C, aboveground C (AGC) and
belowground C (BGC). Bold font indicates that the difference is not
statistically significant. ... 64 3.4 The effects of thinning regimes on carbon pools under the three climate
scenarios (A2, B 1, and constant climate). Values are the mean percentage change rates under each thinning regime compared to the corresponding rotation length (clearcut only scenarios: the time span of 40, 50, 60, 70, and 80 years and no thinning treatments occurred). Values in parentheses are standard deviations. The letters of"L T", "MT", and "HT" represent light thinning with 20% removal of trees, medium
thinning with 40% removal of trees, and heavy thinning with 60%
remo val of trees, respectively. The numbers after th ose letters re present thinning time (years). SOC: soil organic carbon; HWC: harvested wood
4.1 Key stand, climate, and soil characteristics of Southern Old Aspen (SOAS) and Southern Old Jack Pine (SOJP) sites in Saskatchewan,
Canada... 81 4.2 TRIPLEX-Management mode! overall performance in carbon fluxes,
stand level variables, and carbon pools at the Southern Old Aspen (SOAS) site and the Southern Old Jack Pine (SOJP) site in
Saskatchewan, Canada... 88 4.S 1 Soil characteristics of the Southern Old Aspen site in Saskatchewan,
Canada*. . . .. . . .. . . .. . . . .. . . 1 02 4.S2 Soil characteristics of the Southern Old Jack Pine site in Saskatchewan,
Canada* . . . .. . . .. . . .. . . 1 02 4.S3 Values of key parameters used in simulations of the
TRIPLEX-Management model... 103 4.S4 Stand characteristics measured (M) by Gower et al. ( 1997) and Howard
et al. (2004) and simulated (S) at the Southern Old Aspen (SOAS) site and the Southern Old Jack Pine (SOJP) site for different ages in
Saskatchewan, Canada... 1 04 5.1 Summary ofspecies composition (percentage ofvolume)... 113 5.2 Stand characteristics during ali four developmental stages. Dq is
quadratic mean dbh; N is stand density; BA is stand basal area per hectare; V is standing volume per hectare; Sp is site productivity; ACS is aboveground C stock; Hs, Hd, Hh, Hsd, Hsp, Hsdh, GCd, and GCh are the structural diversity indices shown in Table 5.3. The value in
parenthesis is the standard deviation... 1 14 5.3 Stand structural diversity indices used in this study (modified from Lei
et al. (2009))... 116 5.4 Relationship between structural diversity indices and aboveground C
stocks: Pearson's correlation coefficient (r), Spearman's rank correlation coefficient ( p ); Hs, Hd, Hh, Hsd, Hsp, Hsdh, GCd, and GCh are the
structural diversity indices shown in Table 5.3. ... 122 5.5 Summary of multiple linear regression models for aboveground C stocks.
Regressions d.f.
= 4, 406;
b0 to b4 r fers to int rception, diversity, stand density, stand age, and site productivity, respectively; r1 to r4 are the partial correlation coefficients of the corresponding explanatory variables; VIF 1 to VIF 4 are the variance inflation factors correspondingto the four explanatory variables; Hs, Hd, Hh, Hsd, Hsp, Hsdh, GCd, and
Figure Page
1.1 The structure of dissertation... 1 1
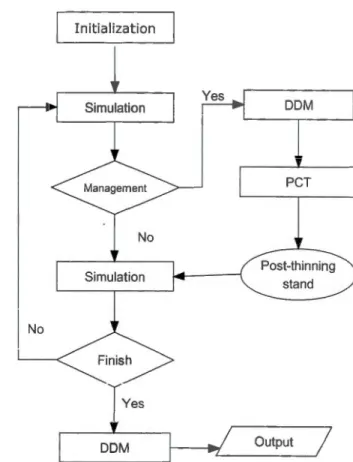
2.1 Flow diagram of a simulation run. DOM refers diameter distribution
mode!... 31 2.2 Comparison of simulated and observed diameter distributions in the
unmanaged (control) and managed (PCT) Jack pi ne stands with different stand age (site 1, 36 years old; site 5, 26 years old) in northwestern Ontario, Canada. Solid and dash curves represent mode! simulated DBH distribution for control and PCT, respective! y. The hollow and grey histograms represent the observed diameter distribution for control and
PCT stands, respectively. . ... .... .... ... ... .. . . . ... .. . ... ... ... ... ... ... ... ... 34 2.3 Comparisons of simulated and observed (A) stand density (trees ha-1),
(B) diameter at breast height (DBH) (cm), (C) quadric mean diameter (cm), (D) mean tree height (m), (E) total stand volume (m3ha-1), and (F) merchantable volume (DBH>9cm) (m3 ha-1) for overall 20 jack pine stands. Solid diamonds represent control plots, and hollow diamonds
represent PCT plots. Sol id diagonal is the 1:1 li ne... 36 2.4 Comparisons of simulated and observed (A) belowground biomass (t ha
-1), (B) aboveground biomass (t ha-1), and (C) total biomass (t ha-1) for overall 20 Jack pine stands. Solid diamonds represent control plots, and
hollow diamonds represent PCT plots. Solid diagonal is the 1:1 line... 39 2.5 Scatter plot comparisons between the effects of PCT (=[PC
T-Control]/Control) on basic stand characteristics such as stand density (trees ha-1
) , mean diameter at breast height (DBH) (cm), the quadratic mean diameter (cm), mean tree height (m), stand volume (m3 ha-1), and merchantable volume (DBH>9cm) (m3 ha-1) for 10 sites located within northwestern Ontario in 2003. The solid diagonal representational line is
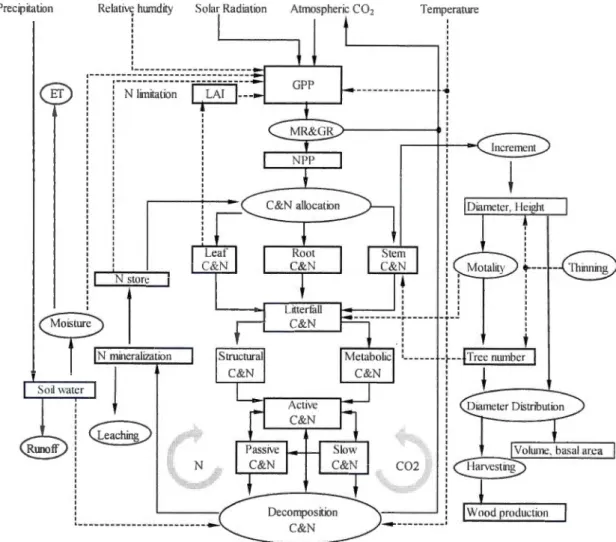
the 1:1 li ne... 44 3.1 The structure of the TRIPLEX mode! (from Wang et al., 20 12).
Rectangles and ovals represent key pools or state variables and core simulation process, respectively. Dashed !ines represent contrais, and sol id !ines represent flows of C (C), nitrogen (N), water, and the fluxes between the forest ecosystem and external environment. Two arrow cycles refer to feedbacks. GPP represents gross primary productivity; MR and GR represent maintenance respiration and growth respiration, respectively; NPP represents net primary productivity; ET represents
3.2 Applied scenarios of climate change from 2080-2099 (20-year monthly mean) relative to historical climate from 1981-2000: historical monthly mean temperature and shifts of mean monthly temperature under two climate change scenarios (top) and historical monthly precipitation and
precipitation under two climate change scenarios (bottom) ... 59 3.3 Schematic applied scenarios illustrating climate change and forest
management regimes (thinning and harvesting). A simulation was assembled by one element from each step. Light, medium, and heavy thinning represent 20%, 40%, and 60%, respectively, tree removal
relative to stand density ... 60 3.4 Simulation output time series of net ecosystem productivity (left) under
three climate scenarios (A2, B 1, and constant climate) for the control sites (A, unmanaged) and two selected management scenarios (B, the management regime ofL Tl OH40 represents light thinning at 1 0-year old and harvesting at 40-year old; C, another regime of L Tl OH 50 represents light thinning at 1 0-year old and harvesting at 50-year old) and carbon pools (right) under the constant climate scenario for the control site (D), L T 1OH40 (E), and L Tl OH 50 (F). The values represent means of 9 sites that have different estimated stocking levels. Chronosequences start from the assumed regeneration year in 2005 and end in 2099. SOC: soi! organic carbon; Litter C; AGC: aboveground living biomass carbon; BGC: belowground living biomass carbon; HWC: harvested wood
carbon ... 63 3.5 Mean (A) annual net ecosystem productivity (NEP) and (B) carbon
stocks under different climate scenarios (A2, B 1, and constant climate). Different letters below the graph indicate significant differences among treatments in each C pool (Tukey's HSD, p<0.05). Error bars represent standard errors. SOC: soi! organic carbon; AGC: aboveground living biomass carbon; BGC: belowground living biomass carbon; HWC:
harvested wood carbon ... 65 3.6 Variations of (left) net ecosystem productivity (NEP) and (right) carbon
stocks under the three climate scenarios (A2, B 1, and constant) for different management scenarios (The letter of "H" represent harvesting; the letters of "L T", "MT", and "HT" represent light thinning with 20% removal of trees, medium thinning with 40% removal of trees, heavy thinning with 60% removal of trees, respectively; the numbers after them represent thinning time [years]) with the same rotation length. Means with different letters are significantly different (Tukey HSD, p<0.05). Error bars represent standard errors. SOC: soil organic carbon. Litter C: litter carbon, BGC: belowground carbon, AGC: aboveground C,
3.7 Pair-wise correlations (A) between total ecosystem carbon (TEC) and mean annual net ecosystem productivity (NEP) and (B) between harvested wood carbon (HWC) and mean annual NEP by various management scenarios under varied climate scenarios (A2, B 1, and constant climate). Triangles, squares, and circles represent the constant,
B 1 and A2 climate change scenarios, respectively. Sol id symbols represent harvesting-only management regimes. Hollow symbols represent management regimes with thinning treatments. Solid and dashed tines linked the same management groups ( e.g., G-H40 represents a set of management regimes with a rotation length of 40
years) under the three climate change scenarios ... 69 4.1 Annual variations in annual mean temperature (upper) and precipitation
(bottom) for constant climate and potential climate change in Saskatchewan, Canada. The mean annual temperature was 0.4
o
c
and the mean annual precipitation was 467 mm (the 30-year mean during 1971-2000 at Waskesiu Lake weather station, 53.92° N, 106.08°W, Environment Canada)... . . . .. . . .... 87 4.2 Monthly carbon fluxes measured/estimated (symbol) and simulated
(!ines) at the Southern Old Aspen (SOAS) site from 1996-2010 in
Saskatchewan, Canada. ... 89 4.3 Monthly carbon fluxes measured/estimated (symbols) and simulated
(!ines) at the Southern Old Jack Pi ne (SOJP) site from 1996-2010 in
Saskatchewan, Canada. ... 90 4.4 Measured (symbols) and simulated (!ines) annual NEP variation at
Southern Old Aspen (SOAS) and Southern Old Jack Pine (SOJP) sites
from 1996 to 20 1 0 in Saskatchewan, Canada. ... ... ... . ... ... ... ... ... ... .. 91
4.5 Carbon (C) pools measured (symbols) and simulated (column) in 2004 for Southern Old Aspen (SOAS) and Southern Old Jack Pine (SOJP) sites in Saskatchewan, Canada. Total ecosystem C (TEC) is comprised of living aboveground (AGC) and belowground biomass C (BGC), woody debris C (WDC), and soi! organic C (SOC). Total biomass C (TBC) is summed by AGC, BGC, and WDC. WDC includes standing dead wood C, wood and branch litterfall on the forest floor. The black points indicate the mean value of measurements. Error bars represent
stand deviations. ... ... ... .... ... ... ... .... ... .. ... ... ... ... .. . 92 4.6 Variations in simulated annual net ecosystem productivity (NEP) and
total ecosystem carbon (TEC) from 1980 to 2100 under constant climate and four climate change scenarios with clearcutting in 2010 (left) and 2055 (right) at Southern Old Aspen (SOAS, upper) and Southern Old
4.S 1 Paired mean annual temperature shift and mean annual precipitation change for the last 20 years (2081-21 00) of 21 century under the four climatic change scenarios. CGCM3.1 and MlROC3.2 represent Coupled Global Climate Mode! developed by Canadian Centre for Climate Modelling and Analysis, and Mode! for Interdisciplinary Research on Climate (JAPAN), respectively. SERA2 and SERB 1 represent lntergovernmental Panel on Climate Change (IPCC) Special Report on
Emissions Scenarios (SRES) A2 and B 1, respectively. ... 105 5.1 Diameter distribution for Spruce-balsam fir plots throughout ali four
developmental stages. Error bars represent standard deviations ... 1 19 5.2 Height distributions for Spruce-balsam fir plots throughout ali four
developmental stages. Error bars represent standard deviations. .... ... 120 5.3 Mean aboveground C stocks for Spruce-balsam fir plots during ali four
deve1opmental stages. Error bars re present standard deviations. .... ... 121 5.4 Relationships between aboveground C stocks and structural diversity
indices (n=411 ). Hs, Hd,
Hh
, Hsd
, Hsp, Hsdh, GCd, and GCh are thestructural diversity indices shown in Table 5.3. ... 122
-Les changements climatiques et ses effets potentiels sur les systèmes environnementaux renforcent la nécessité de stratégies de gestion forestière qui augmentent l'adaptabilité et la capacité de séquestration du carbone (C) forestier. Un modèle qui évalue avec précision les changements dans la productivité des forêts et des stocks de C en réponse aux changements climatiques et la gestion des forêts va nous permettre d'évaluer l'impact des changements globaux sur les forêts.
L'objectif de cette thèse était d'améliorer la compréhension de la façon dont les forêts existantes séquestrent une plus grande quantité de C à cause des changements climatiques mondiaux au moyen de stratégies d'aménagement forestier. Tout d'abord,
un module de gestion des forêts incluant un modèle (TRIPLEX) basé sur les processus a été développé pour quantifier les effets des pratiques d'aménagement forestier (coupes d'éclaircie et coupes à blanc) sur la croissance des forêts, le rendement du bois et la séquestration du C en réponse à des conditions climatiques pour les forêts de pin gris (Pinus banksiana Lamb.). Ce modèle récemment mis au point (TRIPLEX-Management) a ensuite été utilisé pour étudier les moyens d'accroître la séquestration du C dans les forêts de pin gris en utilisant la gestion des forêts exploitées par l'industrie forestière pour la production de bois à long terme. Pour accroître la crédibilité et l'applicabilité du modèle, il a été validé par ·rapport
à
des sources de données multiples (mesures de eddy covariance, de stocks de C et de données de croissance d'arbres) et, par la suite, a été utilisé dans la projection des effets potentiels des changements climatiques et des coupes
à blanc
sur la dynamique du C de la forêt boréale (Populus tremuloides Michx.) et des forêts de pin gris. Finalement, les relations entre la diversité structurelle et les stocks de C dans les forêts dominées par l'épinette ont été examinées par analyse de corrélation, de régression linéaire multiple et de corrélation partielle.Dans le développement du modèle, la validation de ce dernier a montré que le
«
TRIPLEX-Management» a été généralement capable de simuler la réponse de croissance aux éclaircies pré-commerciales des peuplements de pins gris. Dansl'analyse des scénarios de gestion forestière, les résultats des simulations ont montré que les rotations courtes ( 1 0-20 ans par exemple) pourraient améliorer l'absorption du C et diminuer le risque des changements climatiques sur les forêts de pin gris. Les effets positifs des forêts éclaircies sur la production de bois ont été éliminés par le réchauffement climatique. En outre, un éventuel changement climatique sur la limite sud de la forêt boréale en Amérique du Nord pourrait améliorer le taux de séquestration du C s'il n'y avait pas d'épisodes de sécheresse sévère. Dans les forêts
dominées par l'épinette, l'analyse statistique pour 411 placettes-échantillons permanentes a confirmé que la diversité structurelle du peuplement a eu un effet
positif significatif sur les stocks de C hors sol, même si la relation était faible dans
l'ensemble (les coefficients de corrélation de Spearman sont généralement de l'ordre
En résumé, cette thèse présente une tentative d'améliorer notre compréhension du rôle de la gestion des forêts dans l'atténuation et dans l'adaptation des forêts aux changements climatiques. En conséquence, le raccourcissement de l'âge de rotation peut être nécessaire pour les forêts de trembles et de pins gris dans le but d'augmenter la séquestration du C pour une échelle donnée temporelle, et diminuer le risque des impacts des changements climatiques. Le maintien de la complexité de la composition et de la structure peut aider les forêts
à s'adapter
aux futures conditions environnementales et à absorber les perturbations (par exemple, les insectes, les maladies, les incendies, ou les sécheresses). Cette thèse a des implications pratiques pour l'utilisation de stratégies d'aménagement forestier pour atténuer les effets des changements climatiques futurs.Mots-clés: distribution des diamètres, gestion des forêts, gestion du carbone, hypothèse de la complémentarité de niches, indice del Shannon-Wiener, analyse de scénarios, durée de la rotation
Climate change and its potential effects on environmental systems bolster the need for forest management strategies that increase forest carbon (C) sequestration capacity. A model th at accurately evalua tes changes in forest productivity and C stocks in response to cl imate change and forest management wi Il permit us to assess the impact of global changes on forests.
The aim of this dissertation was to improve our understanding of how existing forests sequester a greater amount of C by means of forest management practices. Firstly, a novel forest management module within the framework of a process-based madel (TRIPLEX) was developed tci quantify the effects of forest management practices (thinning and harvesting) on forest growth, timber yield, and C sequestration in response to climatic conditions for jack pine (Pinus banksiana Lamb.) forests. This newly developed model (called TRIPLEX-Management) was then used to investigate how to increase C sequestration within jack pine forests under climate change using forest management that are also exploited by the forestry to produce wood products. To increase the madel credibility and applicability, the madel was validated against multiple data sources (eddy covariance data, C stocks, and forest growth data) and, subsequently, was used for the projection of potential effects of climate change and clearcuts on C dynamics of boreal trembling aspen (Populus tremuloides Michx.) and jack pine forests. Finally, the relationships between the structural diversity and C
stocks in spruce-dominated stands were investigated using correlation analysis, multiple linear regressions and partial correlation analysis.
Madel validations showed that the TRIPLEX-Management madel was generally capable of simulating C dynamics and ecosystem responses to forest management and climatic conditions for aspen and jack pine forests. In the forest management scenario analysis, simulation results showed that shortening rotation length (for example, 10-20 years) could enhance C uptake and decrease the potential risk of climate change on jack pine forests. The positive effects of forest thinning on wood production were enhanced with modest warming, but eliminated with warmer climate. Moreover, potential climate change may enhance the C sequestration rate if there were no severe natural disturbances. In spruce-dominated forests, statistical analysis confirmed that stand structural diversity had a significant positive effect on aboveground C stocks even though the relationship was weak overall (Spearman's rank correlation coefficients are generally in the range of 0.319-0.600, P<O.O 1 ).
Altogether, this dissertation presents an attempt to improve our understanding of forest management role in forest mitigation to climate change. As a result, shortening rotation age may be necessary for aspen and jack pine forests in order to increase C sequestration for a given temporal scale and decrease the risk of climate change impacts. Maintaining complexity of composition and structure can help forests to
adapt to future environmental conditions. This dissertation has practical implications in terms ofusing forest management strategies to mitigate potential climate change.
Keywords: clearcut logging, diameter distribution, forest management, niche
complementarity hypothesis, Shannon-Wiener index, carbon management, soi 1 organic carbon, rotation length, scenario analysis
GENERAL INTRODUCTION
1.1 Background
1.1.1 Climate change and the boreal forest
Future global warming is largely constrained by emissions of carbon (C) dioxide (C02) due to fossil fuel burning and land use changes (Allen et al., 2009, Matthews el al., 2009). The amplitude of temperature increase is largely dependent on anthropogenic emissions of C02 and on C sequestration by the oceans and the land biosphere (Friedlingstein et al., 2001; IPCC, 2007). The world's forests have strong controls on the global C cycle (the exchange ofC between the biosphere, hydrosphere,
geosphere, hydrosphere, and atmosphere of the Earth) and influence the hydrological cycle and energy budgets between the atmosphere and terrestrial ecosystems (Bonan,
2008, Chapin et al., 2008).
The boreal forest, the second largest biome in the world, contains 33% of the Earth's forest cover. Boreal forests are vulnerable to global warming, and have an important role in C storage and subsequently, are identified as an important "tipping point" for the Earth's climate system (Lenton et al., 2008). The climate forcing of boreal forests is highly uncertain. Low surface albedo may warm global climate (Bonan, 2008), but snow-covered boreal forest with high surface albedo during long winters may offset this warming effect (Chapin el al., 2008). The cooling effects (moderate C storage and weak evaporative cooling) might be large enough to result in an overall cooling effect of boreal forests on global warming. The boreal forest stores 272 Pg C in trees and in the soi! (to 1 m depth) and is sensitive to climate (Pan el al., 20 li), although its
The forest is under large pressure from global climate change. Under climate change, more frequent droughts, fires, and insect outbreaks may lead to regional reductions in forest productivity (Ciais et al., 2005, Zhao and Running, 201 0) and even large-scale boreal forest die-off (Peng et al., 20 1 1, Kurz et al., 2008). As a result, regional droughts may lead to reductions of the forest C sink (e.g., Ma et al., 2012, Michaelian et al., 20 1 1 ). Research in Canada has shown th at droughts may be having caused the reduction of 7.89±3.22 Mt year-1 in the C biomass of Canadian boreal forests since 1963 (Ma et al., 20 12). With future 'global warming and drying, more frequent fi res have been identified as a potential in most boreal forests (Bond-Lamberty el al., 2007, Harden et al., 2000). A modeling study conducted by Amiro et al. (2009) estimated that the emissions of greenhouse gases from Canadian wildfires would increase from 162 Tg y(1 of C02 equivalent to 312 Tg y(1 of C02 equivalent under future climate
change. Insect outbreaks have also recently become more severe, resulting in large C !osses from forests due to tree morta! ity (Hicke et al., 20 12). 1 n western Canada, a massive outbreak of mountain pine beetle (Dendroctonus ponderosae Hopkins,
Coleoptera: Curculionidae, Scolytinae) has killed millions of trees weakened by droughts across 130, 00 km2 of forest in multiple years (Kurz et al., 2008), and possibly moved eastwards. In eastern Canada, spruce budworm (Choristoneura jumiferana Clem.) -caused mortality was estimated to decrease ecosystem C stocks
by 2-10% by the end of simulations (2024) (Dymond et al., 201 0).
Elevated atmospheric C02, rising temperature, and elevated nitrogen (N) deposition may enhance forest C sequestration if other growth factors such as water are not limiting (Hyvonen et al., 2007, Luo el al., 2006, Boisvenue and Running, 2006, Reay et al., 2008, Huang et al., 2007). Elevated atmospheric C02 could enhance
photosynthetic C02 fixation (Huang et al., 2007), even if recent studies reported that the effects of
co2
fertilization on forest productivity might still be constrained by 1 imited N availabil ity and/or water 1 imitation (Pefiuelas et al., 20 ll, Si lv a et al., 201 0, Reich et al., 2006, Norby et al., 201 0). Furthermore, modest warming will enhanceforest productivity due to a longer growing season and increased metabolic rates in
boreal forests (Myneni et al., 1997, Nemani et al., 2003). Future increases in N
deposition could also increase N availability, thus enhancing forest growth in
N-limited forest ecosystems (Hyvonen et al., 2007, Reay et al., 2008). ln addition, the
interactions of these stabilizing factors are likely to increase the availability of soi!
moisture, decrease fire frequency, and enhance forest growth and biomass (Lenton et
al., 2008).
1.1.2 The roles of sustainable forest management under climate change
Climate change has resulted in potentially dangerous impacts on global boreal forests
(Section 1.1.1 ). With the common con cern surrounding the impacts of cl imate change
on forests, there has been much debate on the role of forest management on adaptation and mitigation to climate change. The Kyoto Protocol to the United Nations Framework Convention on Climate Change (UNFCCC) provides an opportunity for some countries to claim for large C sinks from land use, land use
change, and forestry (LULUCF), and use the C sinks to offset their fossil fuel emissions. Under Article 3.4 of the Protocol, the forestry community proposed two
ways for existing forests to face the challenge of changing climate (Millar et al., 2007,
Seidl et al., 2007): ( 1) mitigation strategies th at use forest ecosystem to reduce overall
greenhouse gas (GHG) emission via enhancing forest C sequestration and reducing fossil fuel burning; and (2) adaptation strategies that help forest ecosystems
accommodate new climate conditions.
1.1. 2.1 Mitigation strategies
It has been proposed that forest management can be used in climate change mitigation
strategies by (i) increasing C sequestration (stored both on-site and in long-! ived wood products) (e.g., Thornley and Cannell, 2000, Seidl et al., 2007, Lasch et al., 2005); and by (ii) substituting fossil fuels with bioenergy from wood residues (e.g., Malmsheimer et al., 2008, Hudiburg et al., 20 Il).
Forest management can play a key role in climate change mitigation. Much effort has been invested in evaluating how to increase C sequestration (stored both on-sites and off-sites) (Seidl et al., 2007, Thornley and Cannell, 2000, Hudiburg et al., 2011), even if wood product C pools are not accounted for in the guidelines of the first commitment period under the Kyoto Protocol. Common sense dictates that any reasonable assessment of the role of the forests in global, national, or regional C cycles should include the consideration of C stored in forest products (Hennigar et al., 2008), given that harvested wood products contain large amounts of C (Malmsheimer et al., 2008, Chen el al., 2008, Apps et al., 1999). Based on the approach of !ife cycle analysis, the tradeoffs of various harvested wood products in global change mitigation need to be analysed (McKechnie et al. 20 Il).
Previous studies have demonstrated that unmanaged forests, such as old-growth forests, stored greater amounts of C in trees and in the soi! (Pregitzer and Euskirchen, 2004), and that they are still continuing to capture C (Luyssaert et al., 2008). ln order to increase C sequestration, therefore, prolonging rotation length has been recommended as a useful way to increase C sequestration on-sites ( e.g., Nu nery and Keeton, 2010, Peng et al., 2002, Kaipainen et al., 2004, Liski et al., 2001). Longer rotation lengths (> 90 years) in European boreal forests have been suggested to benefit C sequestration (Liski el al., 2001, Kaipainen et al., 2004). On the contrary, shortening rotation ages and replanting with robust genotypes has been proposed as management options for adaptation to climate change in Canada (Johnston et al., 2009). Forest thinning has been suggested as a silvicultural intervention to enhance diameter growth and individual stem volume growth for residual trees due to relatively high resource availability (e.g., Tong et al., 2005, Simard et al., 2004, Lei et al., 2007). On the contrary, research in Finland suggests that unthinned stands may produce higher merchantable volume than thinned stands (Makinen and lsomaki, 2004a, Makinen and lsomaki, 2004b ). Therefore, many uncertainties rem am concerning the effects of forest management on C sequestration.
Substitution of fossil fuel with bioenergy from forests has been recognized as a strategy to reduce C02 emissions from burning fossil fuel (Gustavsson et al., 1995). Forest regeneration on the harvest site can help to achieve zero emissions in a given
temporal scale (McKechnie et al. 20 Il, Ter-Mikaelian et al. 20 Il). The potential of
bioenergy production to offset
co
2
emissions is counteracted by fossil fuel emissionfrom the relative activities (e.g., forest harvest and biomass transportation) (Law and
Harmon, 20 Il). There are also large uncertainties in impacts of biofuel removal on
forest nutrient dynamics and growth.
1.1.2.2 Adaptation strategies
Adaptation strategies include resistance options, resilience options, and response options (Millar et al., 2007). Practices designed to increase resistance (e.g., fuel
breaks and intensive removal of invasive species) are likely to improve the defences
of forests against the impacts of rapid environmental changes (Millar et al., 2007).
The forest response option is more likely to help forests to quickly accommodate or respond to environmental changes (Millar et al., 2007). lmproving forest resilience is the most commonly suggested adaptive option in current debates, but more focus needs to be put on improving the abi lity of forests to return to pre-existing conditions
after disturbance (Millar et al., 2007). A number of recent studies on forest adaptation
have focused on maintaining a high diversity of species composition and structure to
maintain a high productivity (Johnston et al., 2009, D'Amato et al., 20 Il, Malmsheimer et al., 2008, Evans and Perschel, 2009). As such, forests might be able to adapt to future environmental conditions and to absorb disturbances ( e.g., insects,
disease, tires, or droughts).
Forest resource managers are facing challenges such as assessing the vulnerability of forests to cl imate change, evalua ting forest response to natural disturbance ( e.g., droughts), and quantifying the effects of various forest management strategies on net C sequestration under climate change. A new approach is to make use of forest simulation models in order to make decisions that satisfy long-term strategies for adaptation and mitigation to climate change (Peng, 2000).
The models used in simulating forest development can be classified into empirical growth and yield models and process-based models (also called physiological models that can simulate key ecosystem processes regarding C, N, and water cycling). Traditional growth and yield models used in f01·estry are generally based on statistical relationships. However, these models only work well as management tools for forecasting stand growth when environments do not change or change minimally. Thus such models are not suitable for long-term prediction of forest development under changing climate conditions. ln comparison, process-based models are able to simulate key ecosystem processes related to C, N, and water cycles under a changing condition of climate. Therefore, process-based models have great potential in investigating impacts offorest management activities and climate change on forest C dynamics (Johnsen et al., 2001, Makela et al., 2000, Landsberg, 2003, Pretzsch et al., 2008). However, the use of most such models has been limited by the absence of flexible forest management practices.
1.2.1 Modeling forest thinning
Forest thinning has been suggested as a cast-effective and sustainable strategy to enhance diameter growth and individual stem volume growth for remaining trees due to the relatively high resource availability and the decreased risk of wildfire (Huggett et al., 2008). As one of the most important silvicultural practices, thinning has been appl ied to hundreds of thousands stands ac ross the world each year (Masek et al., 20 ll ). However, thinning would not necessarily increase the overall forest C stock, as
the C of the increased growth of remaining trees might be less than the removed C of the thinned trees (e.g., Tong et al., 2005, Lei et al., 2007). Thus, it is important to quantify the effects of forest thinning on C dynamics for given forest conditions under a changing c!imate. This can be done by developing a thinning sub-model to evaluate how forest thinning operations affect stand development.
Within the context of c!imate change, two methods have been proposed for simulating stand structure for forest management consideration (Table 1.1 ): (i) incorporating empirical diameter distributions into process-based models (e.g., Lasch et al., 2005, Bellassen et al., 2010); and (ii) a cohort approach (ali trees of a given species established in a given year are assumed to be identical). Much effort has focused on quantifying stand structure by incorporating typical diameter distribution mode! for management purposes. For example, Lasch et al. (2005) analyzed management effects on forest functions at a regional level in Germany, using a process-based mode!, 4C, that has a Weibull diameter distribution incorporated in the forest thinning algorithms. ln addition, a forest management syb-model has been developed within a dynamic global vegetation mode!, ORCHrDEE (Krinner et al., 2005), where forest thinning is simulated based on an initial distribution calculated from a truncated expqnential law function and an allocation function to trees in each diameter class (Bel lassen et al., 201 0).
Alternatively, the cohort method has also been investigated in simulating the effects of forest management on forest functions under climate change. lncorporated in a cohort approach, the Finnfor mode! (Kellomaki and Vaisanen, 1997) was used to analyze the effects of thinning regimes on C sequestration (Garcia-Gonzalo et al., 2007, Routa et al., 2011, Ge et al., 2011). The EFIMOD mode! also uses the cohort approach to simulate different types of thinning (Chertov et al., 2009, Palosuo et al., 2008, Komarov et al., 2003).
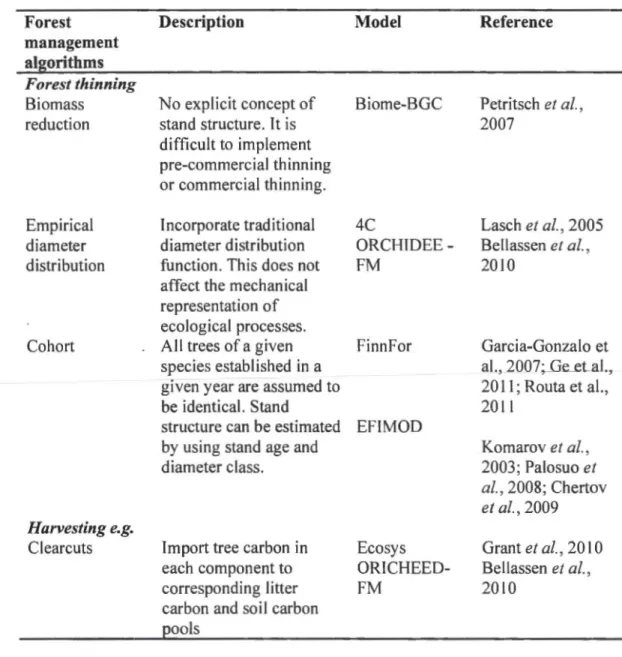
Table 1.1 Forest management algorithms from a selection of the most commonly used process-based models, listed approximately in order of progressive increase in mec han istic de tai 1.
Forest Description Mo del Reference
management algorithms Forest thinning
Biomass No explicit concept of Biome-BGC Petritsch et al.,
reduction stand structure. 1 t is 2007
difficult to implement pre-commercial thinning or commercial thinning.
Empirical I ncorporate traditional 4C Lasch et al., 2005
diameter diameter distribution ORCHIDEE- Bell assen et al.,
distribution function. This does not FM 2010
affect the mechanical representation of ecological processes.
Cohort Ali trees of a given Finn For Garcia-Gonzalo et
species established in a al., 2007; Ge et al.,
given year are assumed to 20 Il; Routa et al.,
be identical. Stand 201 1
structure can be estimated EFIMOD
by using stand age and Komarov et al.,
diameter class. 2003; Palosuo et
al.,2008;Chertov et al., 2009 H arvesting e.g.
Clearcuts Import tree carbon in Ecosys Grant el al., 20 1 0 each component to ORICHEED- Bell assen et al.,
corresponding litter FM 2010
carbon and soi! carbon ools
1.2.2 Modeling forest harvesting
Clearcuts, a common harvesting method m the boreal forest, remove almost ali commercially sized trees (i.e. those trees greater than 9cm DBH [diameter at breast height]). This results in considerable amount of forest C loss not only by direct
transfer of forest C to harvested wood C, but also by respiration !osses if rates of heterotrophic respiration (litrer and soi! organic C decomposition) exceed net primary productivity (NPP) in the years following a clearcut. Many studies have found that negative net ecosystem productivity (NEP) may last for severa! years to decades in the early stages of stand development after clearcuts (e.g., Humphreys et al., 2006, Zha et al., 2009, Kolari et al., 2004, Law et al., 2001, Janisch and Harmon, 2002).
The implications of harvest-related forest C loss highlight the importance of including harvesting in forest simulation to achieve a better understanding of regional and global C cycling (Liu et al., 2011).
Clearcuts may occur at a prescribed rotation age or a prescribed threshold such as stand volume. Using a clearcut sub-model, it can be easily simulate in process-based models. When clearcuts occur, the merchantable portion of the trees is removed from the forests, while harvest residues are transferred to various dead organic C pools (e.g., woody debris and forest tloor) (e.g., Bellassen et al., 2010, Jiang el al., 2002, Peng et al., 2002, Shan in et al., 20 Il). ln some cases, a fraction of harvest residuals is left as slash piles, either burned or left to decay (Grant et al., 2010, Jiang et al., 2002, Peng et al., 2002). After a clearcut, stand reestablishment has to be prescribed. ln mode ling, the reestablishment commonly has to meet a set default value of number of trees or initial biomass in each tree component.
In summary, process-based models can be used to investigate on how future climate change may affect forest C cycling across landscapes and forest types. With forest management sub-models, such as thinning and clearcut sub-models, the process-based models may provide insights into how current management practices can affect forest C dynamics.
There are two major weaknesses in the study of the role of forest management on C sequestration under future climate change. First, modeling forest thinning using the process-based models is highly uncertain due to the inaccurately prediction of stand structure. Second, there is no relatively strict madel validation against multiple data sources (e.g., thinning experiment data, eddy covariance data, and C stocks).
To better understand the role of forest management on climate change mitigation, it is necessary to answer the following question:
How should forests be managed to 1mprove C sequestration to mitigate climate change?
ln this thesis, 1 hypothesize th at ( 1) climate change may enhance forest growth and C sequestration in the boreal forest, especially for pioneer tree species; (2) certain forest management strategies could favour C sequestration both on-site and off-site as weil as decrease the potential climate change induced risk; (3) maintaining the complexity of species composition and structure cou Id enhance forest C stocks.
1.4 Specifie objectives and thesis structure
This dissertation is a combination of four manuscripts related to the investigation of the effects of forest management practices on forest C sequestration facing the challenge of changing climate. The main body of the thesis consists of two phases of research (Figure. 1.1.):
1) Quantifying the effects of forest management and climate change on forest C sequestration on-site and off-site using a process-based madel (Chapters Il, III, and
TV)
;
2) lnvestigating the relationships between structural diversity and C stocks using statistical methods (Chapter V).
1) Chapter II: Oevel op a novel thinning sub-model to quantify the effects of pre-commercial thinning on forest growth, timber yield, and C sequestration 111
response to climatic conditions for jack pine (Pinus banksiana Lamb.) stands.
2) Chapter III: Investigate how to manage jack pine forests to increasing forest C sequestration when producing harvested woods for industrial purposes using the newly developed mode! (TRIPLEX-Management) in Chapter Il.
Chapter 1: Introduction to climate
change and forest management
Ecological Modeling Mitigation
Chapter Il: Development and
validation of TRIPLEX-Management
1
Chapter III: Impacts of thinning and clearcut on forest and harvested
wood C stock
1
Chapter IV: Simulation of forest productivity
and C stocks under management and
climate change
Chapter YI: General conclusions, model limitations, and future
work
Figure 1.1 The structure of dissertation.
Statistical analysis Chapter V: Analysis of the relationship of forest structural diversity and aboveground C stock
3) Chapter IV: Validate the TRIPLEX-Management mode! against multiple sources of measurement data; test whether the mode! is able to simulate the impacts of a drought between 200 1 and 2003 on net eco system productivity of as pen (Populus tremuloides Michx.) and jack pine forests under a continental boreal climate; and predict the potential effects of future cl imate change and clearcut practices on net ecosystem productivity and total ecosystem C stock.
4) Chapter V: Investigate the relationship between structural diversity and C
stocks m spruce-dominated sta.nds and discusses potential management
implementations of increasing C storage by enhancing stand structural diversity in such forests.
Note: This dissertation was written m the form of a collection of published or submitted peer-reviewed journal papers. Therefore, there is a little overlap in the texts between the General Introduction, General Conclusion and the main body of the Chapters.
CHAPTER Il
DEVELOPMENT OF TRIPLEX-MANAGEMENT MODEL FOR
SIMULA TING THE RESPONSE OF FOREST GROWTH TO
PRE-COMMERCIAL THINNING
Weifeng Wang, Changhui Peng, S. Y. Zhang, Xiaolu, Zhou, Guy R Larocque, Daniel O. Kneeshaw, Xiangdong Lei
2.1 Résumé
TRIPLEX 1.0, un modèle basé sur les processus et conçu pour prédire la croissance des forêts ainsi que la dynamique du carbone (C) et de l'azote (N), a été modifié et amélioré pour simuler la productivité des forêts due aux éclaircies précommerciales. Un modèle basé sur la distribution « Weibull » à trois paramètres a été intégré pour simuler des éclaircies précommerciales au sein du modèle nouvellement développé «TRIPLEX-Management». L'intensité de l'éclaircie précommerciale est la composante du modèle qui permet
à
l'utilisateur de simuler des traitementsd'éclaircies en appliquant la surface terrière, la densité du peuplement et le volume.
La mortalité naturelle a diminué suite aux éclaircies précommerciales due
à
une augmentation dans l'espace pour les tiges résiduelles. Le modèle prédit également une augmentation des stocks de litière suite aux éclaircies précommerciales. Le modèle 'TRIPLEX-Management' a été testé sur des données d'observation pour des peuplements de pin gris (Pinus banksiana Lamb.) soumis aux éclaircies précommmerciales dans le nord-ouest de l'Ontario, Canada. Les coefficients de détermination (R2) entre les variables prédites et observées, y compris la densité dupeuplement, la moyenne du DHP (diamètre à hauteur de poitrine), la moyenne quadratique du DHP, le volume total et le volume marchand ainsi que la biomasse souterraine, aérienne et totale variaient de 0.50 à. 0.88 (n
=
20, P <0,00 1 ), àl'exception de la hauteur moyenne des arbres (R2
=
0.25, n=
20, P <0,05). Globalement, l'indice Willmott de l'accord entre les variables prédites et observées variait de 0.97 à 1.00. Les résultats montrent que le modèle « TRIPLEX-Management» est généralement capable de simuler la réponse de la croissance face aux éclaircies précommerciales dans des peuplements de pin gris.Mots-clés : biomasse, distribution des diamètres, gestion forestière, production de bois