Quantification of in vivo tumor invasion and vascularization by
computerized image analysis
S. Blachera, M. Josta, L. Melen-Lamalle a, L.R. Lundb, J. Romerb, J.M. Foidarta,c, A. Noëla
a
Laboratory of Tumor and Development Biology, Centre de Recherche en Cancérologie Expérimentale (CRCE), Groupe Interdisciplinaire de Génoprotéomique Apliquée, University of Liège, Tour de Pathologie, CHU (B23), Sart-Tilman, B-4000 Liège, Belgium
bFinsen Laboratory, Rigshospitalet, Copenhagen, Denmark cDepartment of Gynecology, CHU, 4000 Liège, Belgium
Abstract
The matrix-inserted surface transplantation model is an in vivo assay used to analyse the kinetics of tumor-vessel interactions during different stages of skin carcinoma progression. This system allows the study of host-tumor interface, i.e. penetration of tumor cells into normal host tissue as well as infiltration of normal host cells into the tumor. In the present study, image analysis algorithms for processing and quantifying the extent of such
migratory and tissue remodeling events are presented. The proposed method is non-parametric and its originality lies in its particularity to take into account the specific geometry of tumor-host interface. This methodology is validated by evaluating the contribution of matrix metalloproteases (MMPs) in skin carcinoma invasion and vascularization through pharmacological and genetic approaches.
Keywords: Angiogenesis; Cell migration; Computerized quantification; Image analysis; Matrix
metalloproteases; Proteases; Skin carcinoma; Tumor vascularization; Tumor invasion; Tumor-host interface
Introduction
For a long time, cancer research has been focused on cancer cells leading to identification of genetic alterations associated with cancer pathogenesis. Although this approach has gained new insights into molecular
determinants (oncogenes and tumor suppressor genes) of carcinogenesis, this cancer-centred view of cancer pathogenesis has largely ignored the key contribution of tumor micro environment. Tumors are heterogeneous, structurally complex and result from an evolving crosstalk between tumor cells, infiltrating cells and the surrounding supporting tissue, constitutively the tumor stroma. Over the last decade, important advances have been made in identifying cellular and molecular determinants of the fertile environment provided by host tissue. It is now well accepted that establishment of human tumor xenograft in mice depends on the presence of several host cells including immune and inflammatory cells (Coussens and Werb, 2001), adipocytes (Andarawewa et al., 2005), normal fibroblasts (Noel et al., 1994, 1998; Zhang et al., 2006), senescent fibroblasts (Liu et al., 2006), or tumor-derived fibroblasts (Kuperwasser et al., 2004). Among fibroblast-derived factors promoting cancer growth are matrix metalloproteases (MMPs) (Noel et al., 1998, in press; Egeblad and Werb, 2002; Zhang et al., 2006). This family of 24 human zinc-dependent proteases participates in tissue remodeling and in a complex network of molecular signaling involving chemokines, cytokines, growth factors, cell surface molecules, adhesion
molecules and angiogenic factors (Lopez-Otin and Overall, 2002; Handsley and Edwards, 2005; Overall and Dean, 2006; Cauwe et al., 2007). Recent investigations have highlighted the multiple and complex functions of MMPs (Overall and Kleifeld, 2006; Noel et al., in press). Different MMPs might exert opposite functions. The MMPs contributing to cancer initiation and progression are considered as putative target for drug design, while others are essential for normal cell and tissue functions protecting the organism towards cancer progression and metastatsic dissemination (making them anti-target) (Overall and Kleifeld, 2006).
In order to evaluate tumor-host interactions as well as migratory and tissue remodeling events associated with carcinoma progression, a useful in vivo matrix-inserted surface transplantation model has been set up by Fusenig et al. (Fusenig et al., 1978; Mueller and Fusenig, 2004). It mimics the micro-environment of a developing skin carcinoma and allows a kinetic analysis of tumor-stroma interactions during different stages of malignancy (Mueller and Fusenig, 2004). The extent of tumor invasion and vascularization depends on an adequate balance between pro-angiogenic (such as vascular endothelial growth factor, VEGF) and anti-angiogenic factors, as well as on proteases and their inhibitors (Skobe et al., 1997; Bajou et al., 1998; Mueller and Fusenig, 2004; Maillard
et al., 2005). The application of this model to different transgenic mice deficient for one or two proteases (MMP or serine protease) or their inhibitors has led recently to the identification of key molecules of various proteolytic systems for cancer invasion and vascularization (Bajou et al., 2001; Masson et al., 2004; Maillard et al., 2005). Despite important improvements in the field of tumor-host interface, studies are still hampered by difficulties in achieving objective and reproducible quantification. In most studies, the extent of tumor invasion and
vascularization is estimated by a simple observation of tissue sections immuno-labeled to distinguish tumor cells from blood vessels. In order to classify the various steps of the invasion/vascularization, Bajou et al. (1998, 2001) introduced a scoring method deduced from micrograph visualization. More recently, more quantitative estimations were based on manual measurements (Bajou et al., 2004). In this work, the extent of tumor cell invasion was determined by measuring the distance between the top of tumor cell layer to the deepest front of tumor spread and vascularization by measuring the distance separating tumor cells from the front of migrating endothelial cells (Bajou et al., 2004). In the present work, an original image analysis algorithm for computerized processing and measurement of tumor invasion and vascularization in in vivo mice assays are presented. The aim of this study is to validate this improved image-processing algorithm by applying it to determine the impact of MMP inhibition or deletion in mice on in vivo tumor invasion and vascularization. We developed a
pharmacological approach using a broad spectrum MMP inhibitor (galardin) and a genetic approach using mice deficient for an MMP recently reported as a negative regulator of tumor invasion and angiogenesis
(MMP-19 -/- mice) (Jost et al., 2006). Our data validate our method of quantification in order to screen for MMP inhibitors and to identify the functions of individual MMPs. Such studies are essential to identify among the MMP family those favouring cancer initiation and progression (target) and those displaying anti-tumorigenic effects (anti-target).
Materials and methods MMP-19-null mice
C57B16 mice or mice genetically deficient in MMP-19 (MMP-19-/-) were used. The MMP-19-/- mice were generated by homologous recombination as previously described (Pendas et al., 2004). Animals were maintained with a 12 h light-dark cycle and had free access to food and water. Mice experimentation was done in accordance with guidelines of University of Liège regarding the care and use of laboratory animals.
Transplantation assay in mice
Malignant murine keratinocytes (PDVA cells) were grown in modified Eagle's minimal essential medium containing a 4-fold concentration of amino acids and vitamins (Gibco Laboratories, Grant Island, NY), 10% fetal calf serum (Gibco) and antibiotics. Cells (2x10⁵) seeded on a collagen gel (4 mg/ml of type I collagen isolated from rat tail tendons) inserted in Teflon rings (Renner GmbH, Darmstadt, Germany), were covered by a silicone transplantation chamber (Renner GmbH) and implanted in toto onto dorsal muscle fascia of 6- to 8-week-old mice according to procedure previously described (Bajou et al., 1998, 2001; Maillard et al., 2005). At different time points, tumor transplants were resected, embedded in Tissue Tek (Miles Laboratories Inc., Naperville, IL) and frozen in liquid nitrogen for cryostat sectioning. In vivo assays have been performed twice and each experimental group contained at least 6 animals.
Treatment with MMP inhibitor
Hydroxamate MMP inhibitor galardin (Grobelny et al., 1992) was dissolved in 4% (w/v) carboxymethyl cellulose in 0.9% saline at a final concentration of 20 mg/ml. Starting at day 0 of tumor transplantation, galardin (100 mg/kg body weight) was intraperitoneally injected, daily, according to previous reports (Lund et al., 1999, 2006; Liu et al., 2006). Control animals were treated with the same volume of vehicle.
Immunostaining and image analyzes
Cryostat sections were fixed in acetone at -20 °C and in 80% methanol at 4 °C. For immunofluorescence labeling, type IV collagen Ab (rabbit polyclonal Ab; diluted 1/100, produced in our laboratory) and anti-keratin Ab (polyclonal guinea pig Ab; diluted 1/20, Sigma-Aldrich, St Louis, MO) were used to identify blood vessel basement membrane and tumor cells. Double immunofluorescence labelings were performed as
previously described (Bajou et al., 2001; Masson et al., 2004; Maillard et al., 2005). Images were first digitized in 760 x 570 pixels with 256 grey levels. Image processing and measurements were performed with software
Aphelion 3.2 (Adsis, Meythet, France) on a PC. Algorithms developed in the present work have been carrying out using traditional tools and mathematical morphology (Soille, 1999). Five images at least of different animals were analyzed.
Statistical analysis
Statistical analysis was performed with Matlab 7.0 software and different parameters were calculated. As distribution curves calculated were very skewed and non-normally distributed, usual descriptive statistical parameters such as the mean and the standard deviation were not relevant. To give an idea of centrality and spread of such empirical distributions, percentiles were usually used. Percentiles provide an estimation of the proportion of data that fall above a given value, i.e. Xth percentile means that at most X% of values are less than this value. In the present work, we determined for each calculated distribution X25, X50 and X75 percentiles. It is worth noting that X50 corresponds to median of distribution. Interquartile range (IQR) corresponds to the distance between X25 and X75 percentiles. Dunn's test was used to compare tumor or endothelial cell distributions obtained from the twice transplantation of malignant keratinocytes. p<0.05 was considered significant.
Results
Stromal activation, angiogenic response and tumor invasion after malignant keratinocyte transplantation
When skin carcinoma PDVA cells precultured on a collagen gel were implanted onto the dorsal muscle fascia of a mouse (Fig. la), they initially proliferated to form a multilayered epithelium. This transplanted epithelium grew and evolved progressively to display a typical pattern of invasive malignant cells. Tumor invasion was always preceded by infiltration of the collagen gel by host-derived endothelial and stromal cells occurring a few days after tumor implantation. Such an early host cell migration towards the thin tumor layer led to important matrix remodeling and thereafter favoured tumor cell invasion into surrounding host tissue. In this system, activation of stromal cells and infiltration of blood vessels are prerequisites for tumor invasion.
Image processing and measurements
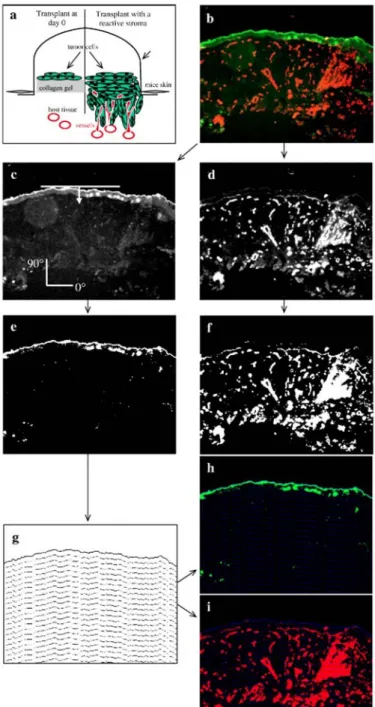
Double immunostainings of histological tumor sections were carried out to distinguish tumor cells (in green) and blood vessels (in red) (Fig. lb). Green (tumor progression) (Fig. lc) and red (vascularization) (Fig. 1d)
components of immunostained tumor images were processed separately. The contrast was optimized by histogram equalization. Tumor cells were segmented automatically using the entropy of histogram of grey level intensities (Kapur et al., 1985) (Fig. le). From the vascularization image (Fig. 1d), blood vessels were
automatically segmented using a threshold transformation that maximizes global average contrast of edges (Kohler, 1981) (Fig. 1f).
Quantification of tumor invasion and vessel migration was performed as follows: (1) The upper boundary of the tumor was obtained by subtracting from the binary image its one time eroded image; to perform this erosion, a linear structuring element perpendicularly oriented to the top of the tumor (Fig. 1c) was used. (2) The obtained upper boundary of tumor was further iteratively dilated n times with the same linear structuring element as previously. At each iteration, (n-1) dilated object was subtracted from n dilated one in such a way to obtain lower boundaries of successive dilated objects. (3) The set of these lower boundaries forms a grid that preserves morphology of the whole structure (Fig. 1g). (4) The grid was superposed to tumor and vascularization binary images, respectively (Figs, 1h, i). Then, tumor/endothelial cell density, defined as the area occupied by tumor/endothelial cells at each interval of grid, divided by area of corresponding grid interval, was calculated. (5) Tumor/endothelial cell density was then plotted as a function of distance to the upper tumor limit. With this construction, Lmax, the longest distance of tumor invasion indicates tumor thickness.
Fig. 1: Image processing of tumor transplanted in vivo onto mice, (a) Schematic representation of tumor
transplants at day 0 and angiogenesis and tumor invasion 21 days after transplantation in wild-type mice, (b) Histological tumor section image showing malignant cells (green, anti-keratin antibody) and blood vessels (red, anti-collagen type IV antibody). Colour image decomposition: (c) green component image showing only tumor cells and (d) red component images corresponding to blood vessels were processed separately. Binary images of tumor cells (e) and blood vessels (f) were obtained after automatic thresholding, (g) A morphological grid was obtained by successive dilatation of the tumor upper border. The constructed grid was superposed with tumor cells (h) and blood vessels (i) images. The quantification method is described in the main text. Original magnification: x 100.
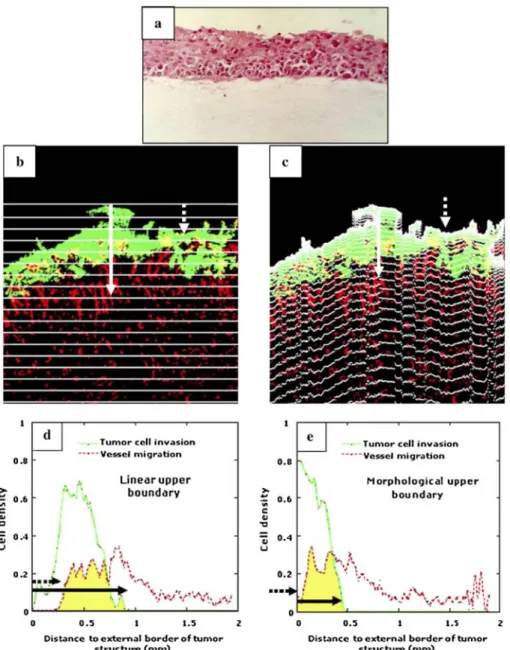
The use of a morphological grid has the advantage to take into account the actual shape of the tumor border. Indeed, we compared on a representative sample (Fig. 2), the quantification of tumor invasion by using a morphological grid (Fig. 2c) and a linear grid used in classical manual measurement (Fig. 2b). For both types of grid, the tumor thickness was evaluated as the distance between the upper limit of the tumor and the intersection of the grid with the lower limit of the tumor cells (see solid white arrows in Figs. 2b, c). This distance
corresponds to the width of the density distribution of tumor cells (see solid black arrows in Figs. 2d, e). The value of tumor thickness obtained by using the linear grid was twofold higher than the value obtained with the morphological grid. This clearly demonstrates that the use of a classical grid instead of the proposed
morphological one overestimates tumor cell invasion. The same conclusion holds true when considering the migration of endothelial cells towards tumor cell layer. White dashed arrows in Figs. 2b and c delineate the position of endothelial cells that have covered the largest distance during migration towards the tumor
compartment. These endothelial cells entered deeper into the tumor layer, almost reaching the upper boundary of tumor. The use of the two different grids led to different curves of cell density distributions (Figs. 2d, e). A lineal grid detected the first endothelial cells at 0.25 mm from the upper boundary of the tumor whereas the use of a morphological grid revealed that those cells are close to its external surface, reflecting thereby the real situation (see black dashed arrows in Figs. 2d, e). Therefore, the morphological grid was used in all assays. To validate our image processing algorithm, in vivo tumor invasion and vascularization of malignant keratinocyte transplants were quantified in different contexts: (a) a kinetic study of tumor transplantation into C57B16 mice; (b) a pharmacological study to evaluate the effect of a synthetic broad spectrum metalloprotease inhibitor (galardin); and (c) a genetic study aimed at evaluating the impact of gene deletion of one MMP, MMP-19.
Kinetic analysis of tumor invasion and vascularization
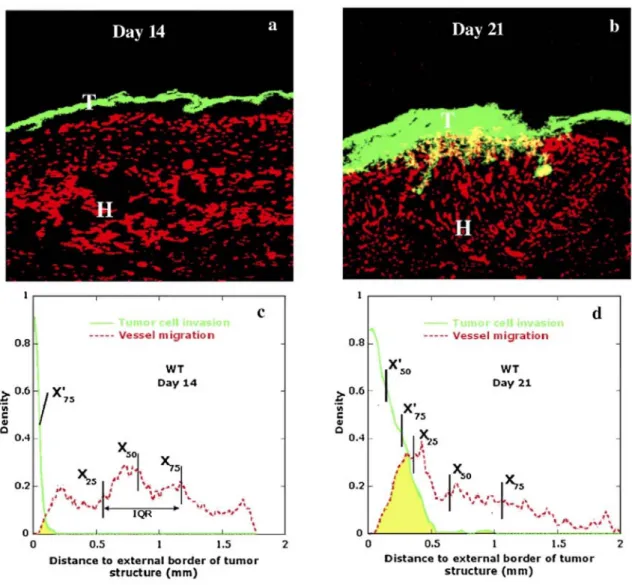
Malignant keratinocytes were transplanted into C57B16 mice for 14 (n = 6 mice) or 21 days (n = 7 mice). Typical double immunostainings of tumor sections are illustrated in Fig. 3. The early event observed 14 days after transplantation (Fig. 3a) was migration of blood vessels towards the thin tumor layer. However, these vessels did not reach tumor cells (Fig. 3a). This blood vessel infiltration preceded tumor invasion which was evidenced at day 21 after tumor transplantation. In order to quantify these successive migratory and invasive events, we determined the distribution of tumor and endothelial cell density as a function of distance to the upper boundary of the tumor layer (Figs. 3c, d). The comparisons between the tumor density or the blood vessel density distributions at days 14 and 21 indicate that tumor invasion and angiogenesis are statistically different (p<0.005). The degree of superimposition of curves corresponding to tumor cell density and vessel density allows determination of the extent of tumor vascularization. Indeed, the more resulting curves are superimposed, the more tumor cells and endothelial cells are intermingled. Yellow spots in Fig. 3b delineate regions in which tumor cells and blood vessels were intermingled and thus reflect tumor vascularization. This process was observed at day 21, but not at day 14. At day 14, tumor invasion had not yet occurred while blood vessels had already migrated towards the thin tumor layer (Fig. 3c). At day 21, tumor cells invaded deeper into host tissue demonstrating that this process occurred after host cell infiltration.
The complex tumor-host interface was more precisely studied by determining additional statistical parameters. Since distributions are non-normally distributed, percentiles were used to evaluate centrality and spread of each distribution curve. Percentiles are often used to describe empirical distributions. Obtained values are presented both in Fig. 3 and Table 1 (X'percentile for tumor cells and Xpercentile for endothelial cells).
At day 14 (Figs. 3a, c), the tumor layer exhibited a very thin ribbon-like structure of 0.15 mm width revealing that tumor invasion had not yet occurred (X75'=0.04 mm). On the contrary, blood vessels spread over a large distance confirming that endothelial cells migrated towards tumor cells. This migrative behaviour was evidenced in blood vessel distribution (X75 = 1.17 mm) by a wide interquartile range (IQR = 0.62 mm) and by the longest distance (Lmax =1.77 mm) between the upper limit of tumor layer and the most distant blood vessels. Vessel distribution also shows that most endothelial cells were still far from tumor cells. Indeed, the median (X50) and mean value of this distribution were 0.83 mm and 0.87 mm, respectively, a great distance away from the thin tumor structure. The proximity between these two values indicates that the distribution is strongly centered and gives the distance at which most endothelial cells are located.
Fig. 2: (a) Tumor cells cultured on a collagen gel after 1 day of transplantation in mice. At this time point,
tumor basis is linear (hematoxylin staining), (b, c) Immunostaining of tumors transplanted for 3 weeks in mice. Green colour represents tumor cells (anti-keratin), red colour represents blood vessels (anti-type IV collagen) and yellow intermingling of tumor cells and vessels after colour imaging decomposition (merge between green and red colours). Quantification of tumor invasion and endothelial cell migration were performed by using a linear grid (b, d) and a morphological grid (c, e). Graphs correspond to tumor cell (—; tumor cell invasion) and endothelial cell (----; vessel migration) density distributions obtained using a linear grid (e) and a
Fig. 3: Histological analysis of kinetic tumor transplantation. Immunofluorescence labeling of malignant
keratinocytes (green) and vessels (red) in transplanted tumors observed at 14 days (a) and 21 days (b) in wild-type mice, (b) Yellow represents intermingling of tumor cells and vessels, (c, d) Graphs represent the
distributions of tumor cell density (—; tumor cell invasion) and vessel density (----; vessel migration) as a function of the distance of upper boundary of tumor layer. Intermingling of tumor cells and vessels is supported by superimposition of respective curves (yellow spots). T: tumor cells; H: host tissue. n=6-7 mice per group. Original magnification: x 100.
Table 1: Statistical parameters of tumor and endothelial cell density distributions
Tumor cell invasion Vessel migration
Sample Day X'25 X'50 X'75 X25 X50 X75 WT 14 - 0.03 0.04 0.55 0.83 1.17 21 0.06 0.14 0.26 0.36 0.64 1.06 Control 21 0.03 0.08 0.40 0.49 0.83 1.35 Metalloprotease inhibitor 21 - 0.03 0.08 0.88 1.17 1.47 WT 14 - 0.02 0.03 0.55 0.75 0.99 21 0.06 0.13 0.22 0.25 0.48 0.81 MMP-19-/- 14 - 0.03 0.06 0.34 0.62 0.94 21 0.16 0.50 0.94 0.33 0.70 1.17
At day 21, an increase of tumor thickness was observed (Fig. 3b). Moreover, blood vessels migrated roughly towards tumor cells leading to overlapping of tumor and blood vessel density distributions (yellow spots) (Fig. 3d). Table 1 reveals that all statistical parameters characterizing tumor cell density increased while those of vessel distribution decreased as compared to corresponding values calculated at day 14. The size of tumor layer reached more than 0.60 mm, i.e., almost four times larger than at day 14 and some tumor cells invaded deep into host tissue reaching a distance of 1 mm from the upper limit of the tumor. A loss of centrality of both
distributions was pointed out by a larger difference between the corresponding percentile values. This means that invasion/migration led to a widening of spatial location of both tumor and endothelial cells. Intermingling of tumor cells and vessels is supported by superimposition of their respective curves (yellow spots) (Fig. 3d).
Pharmacological inhibition of tumor invasion and vascularization by a synthetic metalloprotease inhibitor
Mice transplanted with malignant keratinocytes were treated with galardin, a synthetic metalloprotease inhibitor. Statistical analysis indicates that tumor density distributions corresponding to the control and to treated mice are different (p<0.005). The same result is obtained for vessel density distributions between the same groups. At day 21, blood vessels have reached tumor cell layers in control animals (n = 6 mice) and malignant keratinocytes formed tumor sprouts that invaded downwards into remodelled host tissue (Fig. 4a). Treatment of mice with galardin (n = 6 mice) abrogated tumor invasion and vascularization (Fig. 4b). This was evidenced by: (1) the lack of overlap between tumor distribution and vessel distribution curves; (2) the wide interquartile range (IQR = 0.59 mm) in vessel distribution curve; and (3) the small distance (Lmax=0.20 mm) between upper tumor layer and deepest migrating tumor cells. This result indicates that tumor invasion and blood vessel recruitment are MMP-dependent and can be inhibited by a broad spectrum inhibitor.
Impact of MMP-19 deficiency on tumor invasion and vascularization
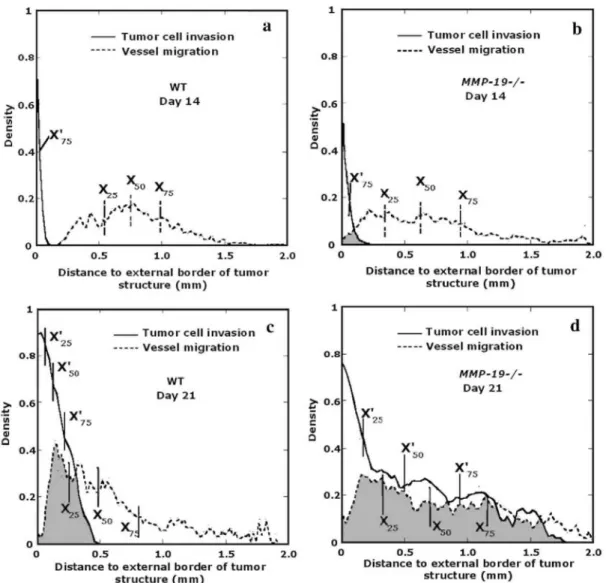
Malignant keratinocytes were transplanted into MMP-19-deficient mice (MMP-19-/-) and their corresponding control (WT) for 14 or 21 days (Fig. 5). At day 14 (Figs. 5a, c), the median (X50'=0.03 mm) and maximal extent of tumor cell distribution (Lmax=0.25 mm), in MMP-19-/- mice, were slightly higher than for WT mice (X50' = 0.02 mm, Lmax=0.11 mm). However, since tumor thickness was small in both genotypes and indistinguishable between them (Table 1), it is concluded that invasion has not yet started in either genotype. On the contrary, endothelial cell migration has already initiated in MMP-19-/- mice as shown by the shift of all percentiles to lower values in relation to those measured in corresponding WT mice (Table 1) and in the larger IQR of MMP-19-/- curve distribution (0.60 mm) (n = 8 mice) in comparison with the WT curve (0.44 mm) (n = 8 mice). At day 21, the invasion and migration process was clearly established in both WT (n=18 mice) and MMP-19-/- (n = 17 mice) (Figs. 5c, d). However, in MMP-19-/- mice, it took place to a much larger extent. On one hand, a strong invasion characterized by a very wide tumor structure which extents up to Lmax= 1.78 mm was observed. On the other hand, blood vessel area distribution (Fig. 5d) began very close to the origin indicating an important intermingling of tumor and endothelial cells. The percentiles values corresponding to tumor and blood vessel density distributions were very close meaning that those distributions were entirely superimposed (Table 1). This result indicates that host mice deficiency in MMP-19 is associated with a positive angiogenic and tumor invasion process.
Fig. 4: Histological analysis of tumor invasion inhibition by a broad spectrum MMP inhibitor. Typical double
immunostaining of histological section micrographs represents tumor (white) and endothelial cells (grey) in WT mice injected with placebo (control) (a) and in WT mice treated with MMP inhibitor (b). (c, d) Respective distributions of tumor (—; tumor cell invasion) and endothelial cell densities (---; vessel migration). Intermingling of tumor cells and vessels is supported by superimposition of respective curves (grey spots). T: tumor cells; G: collagen gel; H: host tissue. n = 6 mice per group. Original magnification: x 100.
Fig. 5: Histological analysis of tumor transplants into MMP-19—/— mice and WT mice at different time points,
(a, b) Tumor and endothelial cell density distributions, 14 days after tumor transplantation, of WT mice and MMP19—/— mice respectively; (c, d) 21 days after tumor transplantation. Intermingling of tumor cells and vessels is supported by superimposition of respective curves (grey spots). n = 8 mice per group at day 14; n = 17-18 mice per group at day 21.
Discussion
Angiogenesis promotes not only tumor growth, but also progression to an invasive tumor phenotype (Mueller and Fusenig, 2004). A better understanding of tumor invasion and endothelial cell recruitment in in vivo mice assays is essential to evaluate the efficacy of anti-angiogenic agents, as well as to determine the impact of gene deficiency on cancer progression. These effects are usually evaluated qualitatively or by manual measurements on micrographs. In the present work, objective image analysis is proposed to determine the extent of tumor invasion and endothelial cell migration in the matrix-inserted surface transplantation model (Bajou et al., 1998, 2001 ; Maillard et al., 2005). The preliminary step of image processing, i.e., the binarization of tumor and endothelial cells, depends strongly on the good quality of double immunostaining that allows discrimination between the two cell types. With an efficient staining, automatic non-parametric thresholding can be applied. The methods previously used to determine the extent of cell invasion/migration consists in measuring manually the average distance between the lower boundary of the tumor and the blood vessel front (Bajou et al., 2004). In the present work, the determination of the tumor/endothelial cell density as a function of the distance to the upper boundary of the tumor allows to obtain more information related to the particular morphology of the studied structures. Indeed, from cell density distributions, it is possible to determine the tumor thickness, the distance between tumor and endothelial cell front, and the degree of superimposition of tumor and endothelial cells when invasion/migration brings the cell two types into contact. Furthermore, percentile analysis of cell
density distribution allows to quantify the proportion of tumor/blood cells at various distances from the upper boundary of the tumor structure. The originality of the method proposed to measure the extent of
invasion/migration relies on taking into account the particular geometry of tumor/endothelial cell structure. Indeed, a grid is constructed automatically for each image provided that the appropriate structuring element is chosen. It must be noticed that when tumor cells cultured on a collagen gel are transplanted into mice, the bottom of these transplants are linear (see Fig. 2a). However, 2 or 3 weeks later, the basis (front of migration) of the multilayered epithelium grown in vivo is irregular (Fig. 2b). Indeed, tumor invasion occurs through progressive infiltration of some tumor cells in bundles progressively intermingled with host cells. The use of a classical linear grid led to an overestimation of tumor cell invasion and endothelial cell migration revealing that the use of morphological grid is more appropriate for quantification (Fig. 2d). To the best of our knowledge, this
quantitative method is the first one allowing a precise measurement of tumor cell/ vessel intermingling in a complex histological structure.
The proposed quantification method has been validated by quantifying tumor invasion and vascularization in different contexts. First, in a kinetic study of tumor invasion and vascularization in WT mice, we demonstrate that migration of endothelial cells precedes tumor cell invasion when tumor cells still formed a noninvasive multilayer. Indeed, endothelial cell migration was evidenced at day 14, therefore the angiogenic response occurred earlier than tumor cell invasion which was clearly established only after 21 days of transplantation. Second, the inhibition of tumor invasion and vascularization by a broad spectrum synthetic metalloprotease inhibitor supports the key contribution of MMP to this process. The capacity of galardin to block tissue remodeling processes has been previously reported in wound healing (Lund et al., 1999) and embryo
implantation and placentation (Solberg et al., 2003). Third, application of this method to tumor transplanted into MMP-19 deficient mice illustrates the role of MMP-19 as a negative regulator of tumor progression.
Interestingly, the extent of the combined invasion/ vascularization process is strongly amplified in
MMP-19-/-mice as compared to WT mice. This was assessed by different statistical parameters of density cell distribution. The protective role of MMP-19 in tumor vascularization and tumor invasion is opposite to the pro-tumoral role mediated by most MMPs. Indeed, application of the same keratinocyte transplantation model into double MMP-2/MMP-9-deficient mice demonstrated that both MMP-2 and -9 promote tumor vascularization and invasion (Masson et al., 2004). These gelatinases are positive regulators of tumor angiogenesis in contrast to MMP-19, which is a negative regulator by slowing down the angiogenic process. This model will be helpful to investigate the cellular source of MMP-19 by immuno staining and in situ hybridization and to quantify their spatial and temporal distribution during the tumor vascularization and invasion. An important issue to address is whether MMP-19 exerts its anti-tumorigenic effect independently to its localization (tumor compartment versus host tissue). Therefore, the transplantation of tumor cells overexpressing MMP-19 will determine whether the production of the enzyme by tumor cells could compensate for host deficiency. In addition, the application of our method to mice deficient for other MMP or MMP-related genes such as ADAM and ADAMTS will be suitable to identify putative targets and anti-targets (Overall and Kleifeld, 2006).
In conclusion, our computerized image analysis coupled to the determination of different statistical parameters provides a novel objective method for studying and quantifying the combined process of tumor invasion and angiogenesis. It allows a precise quantification of tumor-host intermingling during early events of tumor-host interactions. In addition, it enables a quantitative evaluation of pro- or anti-angiogenic agents. The use of the in vivo mice assay and its quantification is particularly suitable to study the host-tumor interface which is now more and more recognized as an important aspect of cancer evolution.
Acknowledgments
We acknowledge Carlos Lopez-Otin and Alberto Pendas (University of Oviedo) for providing us with MMP-19-deficient mice. We thank I. Dasoul, P. Gavitelli, F. Olivier and G. Roland for their excellent technical assistance. This work was supported by grants from the Communauté Française de Belgique (Actions de Recherches Concertées), the European Union (FP6 no. LSHC-CT-2003-503297), the Fonds National de la Recherche Scientifique (FNRS, Belgium), the Fédération Belge Contre le Cancer, the Centre Anticancéreux près l'Université de Liège, the FB Assurances, the Fondation Léon Frédéricq (University of Liège), the D.G.T.R.E. from the "Région Wallonne", the Interuniversity Attraction Poles Programme-Belgian Science Policy (Brussels, Belgium). M.J. is a recipient of a grant from FNRS-Télévie.
References
Andarawewa, K.L., Motrescu, E.R., Chenard, M.P., Gansmuller, A., Stoll, I., Tomasetto, C, Rio, M.C., 2005. Stromelysin-3 is a potent negative regulator of adipogenesis participating to cancer cell-adipocyte interaction/crosstalk at the tumor invasive front. Cancer Res. 65, 10862-10871.
Bajou, K., Noel, A., Gerard, R.D., Masson, V, Brunner, N, Holst-Hansen, C, Skobe, M., Fusenig, N.E., Carmeliet, P., Collen, D., Foidart, J.M., 1998. Absence of host plasminogen activator inhibitor 1 prevents cancer invasion and vascularization. Nat. Med. 4, 923-928. Bajou, K., Masson, V, Gerard, R.D., Schmitt, P.M., Albert, V, Praus, M., Lund, L.R., Frandsen, T.L., Brunner, N, Dano, K., Fusenig, NE., Weidle, U., Carmeliet, G, Loskutoff, D., Collen, D., Carmeliet, P., Foidart, J.M., Noel, A.S., 2001. The plasminogen activator inhibitor PAI-1 controls in vivo tumor vascularization by interaction with proteases, not vitronectin: implications for antiangiogenic strategies. J. Cell Biol. 152, 777-784.
Bajou, K., Maillard, C, Jost, M., Lijnen, R.H., Gils, A., Declerck, P., Carmeliet, P., Foidart, J.M., Noel, A., 2004. Host-derived plasminogen activator inhibitor-1 (PAI-1) concentration is critical for in vivo tumoral angiogenesis and growth. Oncogene 23, 6986-6990.
Cauwe, B., Van den Steen, P.E., Opdenakker, G, 2007. The biochemical, biological, and pathological kaleidoscope of cell surface substrates processed by matrix metalloproteinases. Crit. Rev. Biochem. Mol. Biol. 42, 113-185.
Coussens, L.M., Werb, Z., 2001. Inflammatory cells and cancer: think different! J. Exp. Med. 193, F23-F26.
Egeblad, M., Werb, Z., 2002. New functions for the matrix metalloproteinases in cancer progression. Nat. Rev, Cancer 2, 161-174. Fusenig, N.E., Amer, S.N., Boukamp, P., Worst, P.K., 1978. Characteristics of chemically transformed mouse epidermal cells in vitro and in vivo. Bull. Cancer 65, 271-279.
Grobelny, D., Poncz, L., Galardy, R.E., 1992. Inhibition of human skin fibroblast collagenase, thermolysin, and Pseudomonas aeruginosa elastase by peptide hydroxamic acids. Biochemistry 31, 7152-7154.
Handsley, M.M., Edwards, D.R., 2005. Metalloproteinases and their inhibitors in tumor angiogenesis. Int. J. Cancer 115, 849-860.
Jost, M., Folgueras, A.R., Frerart, F., Pendas, A.M., Blacher, S., Houard, X., Berndt, S., Munaut, C, Cataldo, D., Alvarez, J., Melen-Lamalle, L., Foidart, J.M., Lopez-Otin, C, Noel, A., 2006. Earlier onset of tumoral angiogenesis in matrix metalloproteinase-19-deficient mice. Cancer Res. 66, 5234-5241.
Kapur, J.N., Sahoo, P.K., Wong, A.K.C., 1985. A new method for gray-level picture thresholding using the entropy of the histogram. Comput. Vis. Graph. Image Process. 29.
Kohler, R., 1981. A segmentation system based on thresholding. Comput. Graph. Image Process. 15, 319-338.
Kuperwasser, C, Chavarria, T, Wu, M., Magrane, G, Gray, J.W., Carey, L., Richardson, A., Weinberg, R.A., 2004. Reconstruction of functionally normal and malignant human breast tissues in mice. Proc. Natl. Acad. Sci. U.S.A. 101,4966-4971.
Liu, K., Wahlberg, P., Leonardsson, G, Hagglund, A.C., Ny, A., Boden, I., Wibom, C, Lund, L.R., Ny, T, 2006. Successful ovulation in plasminogen-deficient mice treated with the broad-spectrum matrix metalloproteinase inhibitor galardin. Dev. Biol. 295, 615-622. Lopez-Otin, C, Overall, CM., 2002. Protease degradomics: a new challenge for proteomics. Nat. Rev, Mol. Cell Biol. 3, 509-519.
Lund, L.R., Romer, J., Bugge, TH., Nielsen, B.S., Frandsen, T.L., Degen, J.L., Stephens, R.W., Dano, K., 1999. Functional overlap between two classes of matrix-degrading proteases in wound healing. EMBO J. 18, 4645-4656.
Lund, L.R., Green, K.A., Stoop, A.A., Ploug, M., Almholt, K., Lilla, J., Nielsen, B.S., Christensen, I.J., Craik, C.S., Werb, Z., Dano, K., Romer, J., 2006. Plasminogen activation independent of uPA and tPA maintains wound healing in gene-deficient mice. EMBO J. 25, 2686-2697.
Maillard, C, Jost, M., Romer, M.U., Brunner, N, Houard, X., Lejeune, A., Munaut, C, Bajou, K., Melen, L., Dano, K., Carmeliet, P., Fusenig, N.E., Foidart, J.M., Noel, A., 2005. Host plasminogen activator inhibitor-1 promotes human skin carcinoma progression in a stage-dependent manner. Neoplasia 7, 57-66.
Masson, V, de la Ballina, L.R., Munaut, C, Wielockx, B., Jost, M., Maillard, C, Blacher, S., Bajou, K., Itoh, T, Itohara, S., Werb, Z., Libert, C, Foidart, J.M., Noel, A., 2004. Contribution of host MMP-2 and MMP-9 to promote tumor vascularization and invasion of malignant keratinocytes. FASEB J. 18, 234-236.
Mueller, M.M., Fusenig, N.E., 2004. Friends or foes - bipolar effects of the tumour stroma in cancer. Nat. Rev, Cancer 4, 839-849. Noel, A., Emonard, H., Polette, M., Birembaut, P., Foidart, J.M., 1994. Role of matrix, fibroblasts and type-IV collagenases in tumor progression and invasion. Pathol. Res. Pract. 190, 934-941.
Noel, A., Hajitou, A., L'Hoir, C, Maquoi, E., Baramova, E., Lewalle, J.M., Remacle, A., Kebers, F., Brown, P., Calberg-Bacq, CM., Foidart, J.M., 1998. Inhibition of stromal matrix metalloproteases: effects on breast-tumor promotion by fibroblasts. Int. J. Cancer 76, 267-273. Noel, A., Jost, M., Maquoi, E., in press. Matrix metalloproteinases at cancer tumor-host interface. Semin. Cell Dev. Biol.
doi:10.1016/j.semcdb. 2007.05.01.
Overall, CM., Dean, R.A., 2006. Degradomics: systems biology of the protease web. Pleiotropic roles of MMPs in cancer. Cancer Metastasis Rev. 25, 69-75.
Overall, CM., Kleifeld, O., 2006. Tumour microenvironment - Opinion -validating matrix metalloproteinases as drug targets and anti-targets for cancer therapy. Nat. Rev, Cancer 6, 227-239.
Pendas, A.M., Folgueras, A.R., Llano, E., Caterina, J., Frerard, F., Rodriguez, F., Astudillo, A., Noel, A., Birkedal-Hansen, H., Lopez-Otin, C, 2004. Diet-induced obesity and reduced skin cancer susceptibility in matrix metalloproteinase 19-deficient mice. Mol. Cell. Biol. 24, 5304-5313.
Skobe, M., Rockwell, P., Goldstein, N, Vosseler, S., Fusenig, N.E., 1997. Halting angiogenesis suppresses carcinoma cell invasion. Nat. Med. 3, 1222-1227.
Soille, P., 1999. Morphological Image Analysis: Principles and Applications. Springer-Verlag, Berlin.
Solberg, H., Rinkenberger, J., Dano, K., Werb, Z., Lund, L.R., 2003. A functional overlap of plasminogen and MMPs regulates vascularization during placental development. Development 130, 4439-4450.
Zhang, W.Y., Matrisian, L.M., Holmbeck, K., Vick, C.C, Rosenthal, E.L.., 2006. Fibroblast-derived MT1-MMP promotes tumor progression in vitro and in vivo. BMC Cancer 6.