HAL Id: hal-00297987
https://hal.archives-ouvertes.fr/hal-00297987
Submitted on 27 Mar 2008HAL is a multi-disciplinary open access
archive for the deposit and dissemination of sci-entific research documents, whether they are pub-lished or not. The documents may come from teaching and research institutions in France or abroad, or from public or private research centers.
L’archive ouverte pluridisciplinaire HAL, est destinée au dépôt et à la diffusion de documents scientifiques de niveau recherche, publiés ou non, émanant des établissements d’enseignement et de recherche français ou étrangers, des laboratoires publics ou privés.
Spatial and temporal variation of methane emissions in
drained eutrophic peat agro-ecosystems: drainage
ditches as emission hotspots
A. P. Schrier-Uijl, E. M. Veenendaal, P. A. Leffelaar, J. C. van Huissteden, F.
Berendse
To cite this version:
A. P. Schrier-Uijl, E. M. Veenendaal, P. A. Leffelaar, J. C. van Huissteden, F. Berendse. Spatial and temporal variation of methane emissions in drained eutrophic peat agro-ecosystems: drainage ditches as emission hotspots. Biogeosciences Discussions, European Geosciences Union, 2008, 5 (2), pp.1237-1261. �hal-00297987�
BGD
5, 1237–1261, 2008 Methane emissions in drained peat agro-ecosystems A. P. Schrier-Uijl et al. Title Page Abstract Introduction Conclusions References Tables Figures ◭ ◮ ◭ ◮ Back CloseFull Screen / Esc
Printer-friendly Version
Interactive Discussion Biogeosciences Discuss., 5, 1237–1261, 2008
www.biogeosciences-discuss.net/5/1237/2008/ © Author(s) 2008. This work is distributed under the Creative Commons Attribution 3.0 License.
Biogeosciences Discussions
Biogeosciences Discussions is the access reviewed discussion forum of Biogeosciences
Spatial and temporal variation of methane
emissions in drained eutrophic peat
agro-ecosystems: drainage ditches as
emission hotspots
A. P. Schrier-Uijl1, E. M. Veenendaal1, P. A. Leffelaar2, J. C. van Huissteden3, and F. Berendse1
1
Department of Nature Conservation and Plant Ecology, Wageningen University, Droevendaalse steeg 3a, 6708 PD Wageningen, The Netherlands
2
Department of Plant Production Systems, Wageningen University, P.O. Box 430, 6700 AK Wageningen, The Netherlands
3
Department of Hydrology and Geo-Environmental Sciences, Faculty of Earth and Life Sciences, Vrije Universiteit Amsterdam, De Boelelaan 1085, 1081 HV Amsterdam, The Netherlands
Received: 31 January 2008 – Accepted: 18 February 2008 – Published: 27 March 2008 Correspondence to: A. P. Schrier-Uijl ([email protected])
BGD
5, 1237–1261, 2008 Methane emissions in drained peat agro-ecosystems A. P. Schrier-Uijl et al. Title Page Abstract Introduction Conclusions References Tables Figures ◭ ◮ ◭ ◮ Back CloseFull Screen / Esc
Printer-friendly Version
Interactive Discussion
Abstract
Our research investigates the spatial and temporal variability of methane (CH4)
emis-sions in two drained eutrophic peat areas (one intensively managed and the other less intensively managed) and the correlation between CH4 emissions and soil tempera-ture, air temperatempera-ture, soil moisture content and water table. We stratified the land-5
scape into landscape elements that represent different conditions in terms of topogra-phy and therefore differ in moisture conditions. There was great spatial variability in the fluxes in both areas; the ditches and ditch edges (together 27% of the landscape) were methane hotspots whereas the dry fields had the smallest fluxes. In the inten-sively managed site the fluxes were significantly higher by comparison with the less 10
intensively managed site. In all the landscape element elements the best explanatory variable for CH4 emission was temperature. Neither soil moisture content nor water
table correlated significantly with CH4 emissions, except in April, where soil moisture
was the best explanatory variable.
1 Introduction
15
It is of great importance to assess the contribution of the trace gas methane (CH4) to the greenhouse gas effect and the related global warming. Northern peatlands are believed to be significant sources of CH4, estimated to emit between 20 and 50 Tg yr−1
(Mikaloff Fletcher et al., 2004a, 2004b). In northern oligotrophic and eutrophic man-aged peatland systems, net uptake and emission rates have been found to depend 20
on groundwater level, soil moisture content, temperature, and grassland management (Blodau and Moore, 2003; Christensen et al., 2003; Hendriks et al., 2007; Hargreaves and Fowler, 1998; Pelletier et al., 2007; Van den Pol-Van Dasselaar et al., 1998a). CH4
emissions are difficult to estimate because of their large spatial and temporal variabil-ity. Furthermore, there are two major challenges when upscaling: selecting the correct 25
ecosystem variables for the stratification and developing predictive relationships (Groff-man et al., 2000).
BGD
5, 1237–1261, 2008 Methane emissions in drained peat agro-ecosystems A. P. Schrier-Uijl et al. Title Page Abstract Introduction Conclusions References Tables Figures ◭ ◮ ◭ ◮ Back CloseFull Screen / Esc
Printer-friendly Version
Interactive Discussion In the Netherlands, eutrophic peatlands have been drained for centuries and in the
last 50 years peatlands have been drained more deeply to make agriculture possible, resulting in peat oxidation. These peatlands are therefore major carbon sources of CO2
(Langeveld et al., 1997; Schothorst, 1977; Veenendaal et al., 2007). Burgerhart (2001) and Van den Bos (2003) have suggested that peat oxidation can be reduced if agri-5
cultural peatlands are transformed into wetland nature by raising the water table and by reducing agricultural intensity, thus altering the carbon cycle and probably turning sources into sinks. There is great uncertainty, however, about the impact of such mea-sures on the CH4 balance. Hendriks et al. (2007) found that in an area in the centre
of the Netherlands where intensive farming had ceased 14 years previously and the 10
water table had risen, a very small sink of 71 g CO2-equiv m−2yr−1 had developed.
They attributed this to a decrease in CO2emissions and an increase in CH4emissions
from ditches and waterlogged soil however, they had no data from the pre restoration situation.
We investigated spatial and temporal variability of CH4emissions in two drained peat
15
areas – one intensively managed and the other less intensively managed – and exam-ined the correlation between CH4emissions and soil temperature, air temperature, soil moisture content, water table and management over almost two years. We monitored CH4flux measurements at discrete points within landscape elements representing
dif-ferent micro topographical conditions. We aimed to determine the mean flux associated 20
with the landscape element, and to provide a spatially integrated flux measurement for the study areas. We compared the annual CH4emission balances of both areas.
2 Materials and methods
2.1 Site description
The experimental sites (Oukoop, intensively managed dairy farm and Stein, less in-25
BGD
5, 1237–1261, 2008 Methane emissions in drained peat agro-ecosystems A. P. Schrier-Uijl et al. Title Page Abstract Introduction Conclusions References Tables Figures ◭ ◮ ◭ ◮ Back CloseFull Screen / Esc
Printer-friendly Version
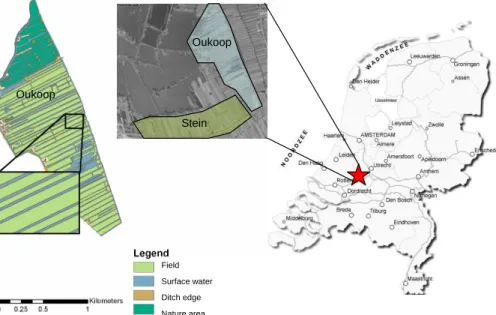
Interactive Discussion 52◦02′01′′N′′04◦46′′E′′and 52◦01′07′′N′′04◦46′′E′′) (Fig. 1). The climate is temperate
and humid, with mean annual precipitation of about 800 mm and an annual long-term mean temperature of 9.8◦C. Nol et al. (2008) calculated that 21% of the polder is open water (ditches and small permanent pools) 6% is ditch edges (waterlogged land bor-dering the ditches), <2% is drainage trenches (located in the middle of the field, con-5
taining water in winter) and >71% is drier land with a fluctuating water table. The soils consist of a clayey peat or peaty clay top layer of 25 cm overlying 12 m eutrophic peat deposits. The polder is below sea level: its mean elevation is between 1.6 and 1.8 m below the Amsterdam Ordnance Datum (NAP). The depth to the groundwater varies from 70 to 15 cm; perched water tables occur after heavy rain, when the soil impedes 10
water infiltration. Both sites have been described in detail by Veenendaal et al. (2007). As Stein has become a bird reserve, its management is less intensive than pre-viously. Intensive dairy farming on the two experimental parcels of land here was stopped more than 20 years ago. During the measurement period, both parcels were used as hayfields; they were mown three times after 15 June each year (2005, 2006 15
and 2007). The water table has been allowed to fluctuate since 2006, with a high water table (20 cm below field level) in winter. In both plots, the average C and N contents in the top 20 cm of the soil are 15% and 1.3%, respectively. In most of the parcels of land in Stein, Lolium perenne is dominant, often with Poa trivialis co-dominant. Over time, Holcus lanatus, Anthoxanthum odoratum and Rumex acetosa have become more 20
abundant.
The Oukoop experimental plots are situated on an intensive dairy farm. The man-agement regime varies per year, but overall consists of mowing three times a year and manuring and fertilizing three times a year. The average C and N contents in the top 20 cm of the soil are 24% and 2.4%, respectively. Here too, Lolium perenne is the most 25
BGD
5, 1237–1261, 2008 Methane emissions in drained peat agro-ecosystems A. P. Schrier-Uijl et al. Title Page Abstract Introduction Conclusions References Tables Figures ◭ ◮ ◭ ◮ Back CloseFull Screen / Esc
Printer-friendly Version
Interactive Discussion 2.2 Field sample points
Two land parcels were used for this experiment: one intensively managed and the other less intensively managed. At the beginning of January 2005, 6 PVC collars (diameter 30 cm) were installed in the middle of each parcel, so that gas emissions could be sampled. The measurements were carried out from January 2005 to September 2007. 5
From February 2006 until September 2007, 19 additional sampling points, distributed over two different land parcels per location, were sampled at both research locations to study spatial variability. We stratified both locations into four landscape elements with differing soil/water temperature and soil moisture conditions: permanently water-filled ditches, ditch edges, narrow drainage lines or trenches in the middle of the fields, and 10
the field area with fluctuating water table (henceforth referred to as “ field”). In each of the two fields, there were four sample points in the ditches, four points in the ditch edges, two or three sample points in the drainage trenches and eight or nine sample points in the fields.
2.3 Chamber measurements 15
Fluxes of CH4were determined using a modified closed chamber method (Hutchinson
and Mosier, 1981). Gas flux was measured using a Photo Acoustic Field Gas Monitor (INNOVA 1412 sn, 710-113, ENMO services, Belgium) connected by Teflon tubes to a PVC chamber (Van Huissteden et al., 2005). Samples were taken from the headspace of the closed, dark chamber (30 cm diameter, 25 cm height) that was placed on a collar. 20
A small fan was installed in the chamber to homogenize the inside air and a water lock was placed to control inside pressure. On land we used water between the chamber and the collar to seal the chamber from the ambient air during the measurement. At the ditches we used floaters and a lever system to gently lower the chamber onto the water surface, carefully avoiding the effect of pressure differences. We used external 25
silica gel and soda lime filters to minimize cross-interference of CO2and water vapour with methane at high concentrations. Our gas analyser was calibrated and tested for
BGD
5, 1237–1261, 2008 Methane emissions in drained peat agro-ecosystems A. P. Schrier-Uijl et al. Title Page Abstract Introduction Conclusions References Tables Figures ◭ ◮ ◭ ◮ Back CloseFull Screen / Esc
Printer-friendly Version
Interactive Discussion drift every year at the NMI (Nederlands Meet Instituut: Delft, The Institution of
Stan-dards). Occasional cross-checks with a standard calibration gas established that the instrument did not drift. All measurements were taken during the day, between 8 a.m. and 4 p.m. Each flux measurement consisted of five point-measurements taken at one-minute intervals.
5
In addition to each flux measurement, soil or water temperature was measured at 10 cm depth and soil moisture content was determined in the top 5 cm of soil at the sample points, using a HH2 Delta-T device (Delta T Devices, Llandindrod Wells) cali-brated for the soil type. The water table was recorded with pressure sensors installed in a steel frame to a depth of 70 cm into the soil at one or two places in the field (e+ 10
sensor L-50, Eijkelkamp Agrisearch Equipment BV, Giesbeek, Netherlands). Water levels were logged hourly. Any gaps in the data were filled with average values from other sensors in the surrounding area.
2.4 Calculations and statistical analyses
CH4 fluxes were calculated using linear regression of the changes in concentration
15
over time, because the closure times of the chambers were short. First, the data qual-ity was assessed: outliers resulting from disturbances, chamber leakage or instrument failures were removed from the data set. Annual mean net CH4 emissions were esti-mated by trapezoidal integration of mean net CH4 emission over time (design-based
approach, Van den Pol-Van Dasselaar and Oenema, 1997; Velthof et al., 1996) and by 20
linear regression of natural logarithm-transformed CH4 data (model-based approach, Hendriks et al., 2007).
The statistical significance of differences between landscape elements within sites was calculated with one-way ANOVA; analysis of covariance, with temperature as co-variate, was used to ascertain the statistical significance of differences in the fluxes 25
from the landscape elements of the two sites. Correlations between natural logarithm-transformed emissions and independent variables were calculated using step-wise multiple linear regression analysis (case-wise elimination of variables). Statistical
BGD
5, 1237–1261, 2008 Methane emissions in drained peat agro-ecosystems A. P. Schrier-Uijl et al. Title Page Abstract Introduction Conclusions References Tables Figures ◭ ◮ ◭ ◮ Back CloseFull Screen / Esc
Printer-friendly Version
Interactive Discussion analyses were carried out with SPSS.
For the calculations of the contribution of animals and manure on the inten-sive dairy farm, we used the method with simple emission factors as described by Hensen et al. (2005). Though the most recent IPCC report (IPCC, 2007) mentions a global warming potential (GWP) of 25 to convert CH4 emissions to CO2
equiva-5
lents, we used a (GWP) of 23 for CH4, at a 100-year time horizon (IPCC 2001,
UN-FCCC/CP/1997/7/Add.1/Decision2/CP.3, e.g. Lashof et al., 2000) to allow comparisons to be made with other research.
3 Results
3.1 Seasonal and spatial variation of methane fluxes 10
We compared the landscape elements for the period that measurements of emissions from all landscape elements ran parallel (January 2006 to September 2007). The av-erage soil moisture content and air temperature during this period are shown in Fig. 2: highest temperatures were in July and August and lowest temperatures in December and January.
15
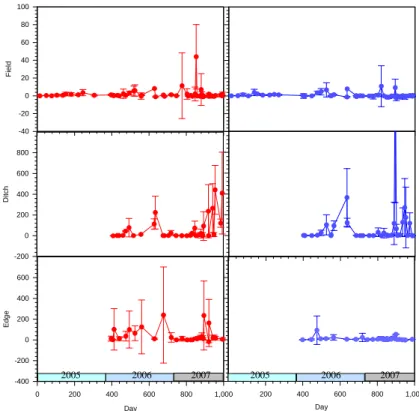
Emission rates varied greatly, depending on the time of the year. For instance, at both sites in 2006 and 2007, ditch emission rates were highest in June, July, Au-gust and September; field emission rates were highest in March, April, May and June (Fig. 3). We also observed that in February 2006 emission rates were slightly higher from the intensively managed site after thaw and manure application. There was a 20
seasonal effect: over 85% of the total annual CH4 emissions were observed in
sum-mer and maximum emission rates in ditches were ten times those of the fields. Ditches showed episodic, exceptionally high emission values: for example in 2006 on 27 and 28 September: 366.05 (n=6) and 123.8 (n=4) mg m−2hr−1for the intensively managed and less intensively managed areas, respectively. During these measurements we ob-25
BGD
5, 1237–1261, 2008 Methane emissions in drained peat agro-ecosystems A. P. Schrier-Uijl et al. Title Page Abstract Introduction Conclusions References Tables Figures ◭ ◮ ◭ ◮ Back CloseFull Screen / Esc
Printer-friendly Version
Interactive Discussion for both sites: maximum ditch emissions were higher in 2007 than in 2006 whereas
maximum edge emissions were higher in 2006 than in 2007.
Spatially, the fluxes from edges and ditches differed significantly between the two sites: in the intensively managed site they were up to 1.5 and 3 times higher, re-spectively (Fig. 3). At both sites, the CH4 fluxes from the ditches (21% of the area) 5
were significantly greater than those from the fields, ditch edges and drainage trenches (P <0.01). At both sites, the fluxes from the ditch edges (6 % of the landscape) were significantly greater than those from the fields (P <0.01). The lowest emissions were from the fields (>71% of the landscape surface area). The emission rates of drainage trenches (<2% of the landscape) did not differ significantly from the emission rates of 10
fields and ditch edges.
3.2 Temperature, soil moisture and the dependence of the methane fluxes on water table
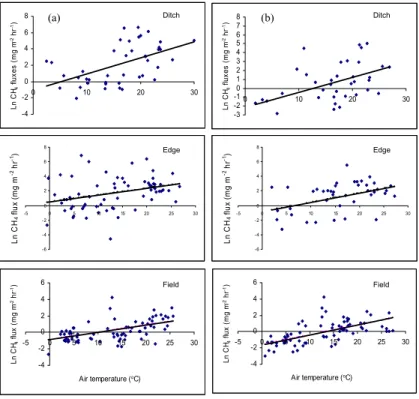
The ditches in both sites showed a positive correlation (r2=0.259; P <0.01; n=74 and
r2=0.295; P <0.01; n=77, respectively) between the Ln-transformed CH4emissions 15
(hereafter LnCH4) and water temperature and also a significant positive correlation
(r2=0.221; P <0.01; n=67 and r2=0.216; P <0.01; n=57, respectively) between LnCH4
emissions and air temperature (Fig. 4).
In both sites there was a significant, positive correlation between LnCH4 emissions
from fields and soil temperature (r2=0.212; p<0.01; n=171 and r2=0.091; p<0.01; 20
n=178, respectively) and an even stronger positive correlation (r2=0.371; P <0.01; n=117 and r2=0.226; P <0.01; n=169, respectively) between LnCH4 emissions and air temperature (Fig. 4).
Overall, the correlations of CH4emissions with soil moisture were weak in both the
intensively and the less intensively managed sites. Adding moisture in a stepwise re-25
gression did not significantly improve the predictive power of the regression. However, analysing the dataset month by month revealed an exception for April in 2006 and
BGD
5, 1237–1261, 2008 Methane emissions in drained peat agro-ecosystems A. P. Schrier-Uijl et al. Title Page Abstract Introduction Conclusions References Tables Figures ◭ ◮ ◭ ◮ Back CloseFull Screen / Esc
Printer-friendly Version
Interactive Discussion 2007, when soil moisture appeared to be a stronger predictor for the emission rates at
both sites (Fig. 5).
The water table in both sites fluctuated greatly during the measurement period: it was high (−15 cm) in winter and low (−65 cm) in summer. The water table did not show any significant correlation with CH4emissions from the fields.
5
The CH4 emissions from ditch edges correlated significantly with soil temperature,
but the best explanatory variable was air temperature (Fig. 4). The correlation between emission rates and soil moisture in the edges of our fields was not significant, except for April in the less intensively managed site where again a significant positive correlation occurred (r2=0.862; P <0.05; n=7).
10
3.3 Annual methane balances
For the estimation of annual terrestrial CH4 balances we used 2 methods: (1) trape-zoidal integration over time (for 2005, 2006 and 2007) and (2) linear regression with temperature as explanatory variable (for 2006) (Table 1). The regression-based esti-mates are based on hourly air temperature data. Fluxes were estimated per landscape 15
element and multiplied by the area occupied by the landscape element, providing a spatially integrated flux measurement. Emissions from drainage trenches were not used in the calculations of the annual CH4balance because their contribution is negli-gible. Comparison of the fluxes estimated by these two methods sometimes revealed large differences.
20
In the fields, integrated annual fluxes based on the daytime measurements were higher but of comparable magnitude to the estimates from regression. However in the ditches and ditch edges, large episodic venting events, in the ditches mainly caused by turbulent water, caused averages to be up to 20 times higher. Even when these are excluded, the mean values are much higher than the values estimated from regres-25
sion. Our exclusive use of daytime measurements might have resulted in overestima-tion of methane fluxes. We estimated regression-based methane fluxes for two days and found that when using data between 12 p.m. and 4 p.m. only, the estimated daily
BGD
5, 1237–1261, 2008 Methane emissions in drained peat agro-ecosystems A. P. Schrier-Uijl et al. Title Page Abstract Introduction Conclusions References Tables Figures ◭ ◮ ◭ ◮ Back CloseFull Screen / Esc
Printer-friendly Version
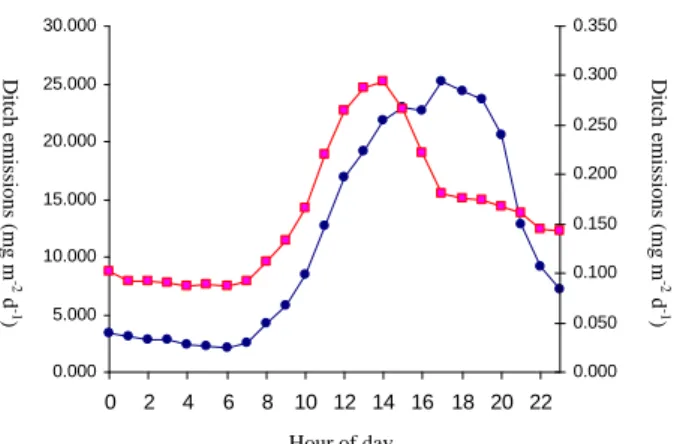
Interactive Discussion methane fluxes were higher: by up to 45% on a winter day and up to 50% on a summer
day. Regression-based estimated methane fluxes at different times on 21 December and 4 July are given in Fig. 6.
3.4 Field methane emissions compared to farm-based emissions
It is interesting to compare measured field methane emissions with farm-based 5
emissions. We estimated farm fluxes using emission factors for dairy cows (Ed),
heifers (Ey), calves (Ec), manure (Es) and farmyard manure (FYM) (274, 170, 48,
53 and 40 g CH4day−1animal−1 or m−3, respectively) as described by Hensen et al. (2005). Using these factors, emission (Q) from the farm was calculated as:
10
Q=(No. Dairy)×Ed+(No. Heifers)×Ey+(No. Calves)×Ec+(m
3
Slurry)×Es+(m
3
FYM)×Ef
(Table 2)
The farm emission (467 kg CH4ha −1yr−1) is estimated to be ∼64% of the total
emission when terrestrial emissions (258 kg CH4yr−1) are included in the balance. For
15
this calculation we used the regression-based values from table 1, multiplied by the farm size: 50 ha.
4 Discussion and conclusions
4.1 Ditches and edges: methane hotspots in eutrophic, drained peatlands
In both sites, the ditches and ditch edges (which together account for 27% of the total 20
landscape) turned out to be CH4 hotspots. As Table 1 shows, linear regression
re-vealed that in the intensively managed site they emitted 6.3 and 4.4 times more CH4,
respectively than the dry field; this compares with 1.7 and 2.5 times more in the less intensively managed site.
BGD
5, 1237–1261, 2008 Methane emissions in drained peat agro-ecosystems A. P. Schrier-Uijl et al. Title Page Abstract Introduction Conclusions References Tables Figures ◭ ◮ ◭ ◮ Back CloseFull Screen / Esc
Printer-friendly Version
Interactive Discussion The CH4 emission rates from the permanently water-filled, 30–60 cm deep ditches
could be predicted by water temperature or air temperature. The exceptionally high emission peaks (up to 800 mg m−2hr−1in the summer) may have resulted from ebulli-tion events, during which CH4quickly passes through the top layer in the water column where oxidation can take place, but they probably mainly occurred when both wa-5
ter temperature and wind velocity were high. In a peatland study in Central Finland, Minkkinen and Laine (2006) found that the methane fluxes from ditches with flowing wa-ter were generally higher than from ditches with standing wawa-ter. They argued that the diffusion rates were higher in flowing water because when water is turbulent the bound-ary layer is thinner. The contribution of very high fluxes to the annual balance may lead 10
to overestimation in the integration-based approach. Even when using a regression-based approach, annual averages of methane emission must be presented with some caution. Our comparison of trapezoid integrated calculated means and the regression-based temperature-dependent calculations highlights the uncertainty in the means: for example, all the flux measurements were performed during the day, so when trapezoid 15
calculations were used, the fluxes may have been overestimated due to diurnal tem-perature changes when integrating over time (cf. Mikkel ¨a et al., 1993; Chanton et al., 1993). It will be recalled that when using data from 12 p.m. to 4 p.m. only, we found that the daily methane fluxes were 45% higher on 21 December (winter) and 50% higher on 4 July (summer).
20
Our results demonstrate that field emissions are an exponential function of soil and air temperature: the regression-based fluxes in the intensively managed site were sta-tistically significantly higher in 2006 and 2007 despite varying soil moisture contents. The seasonal distribution of emission rates varied between sites. In the less intensively managed site, high CH4fluxes were concentrated in the summer period, while in the
25
intensively managed site they were concentrated in early spring and summer, partly as-sociated with field applications of slurry. Van den Pol-Van Dasselaar et al. (1999) also reported higher CH4 emissions after manure application (but the increase they found
BGD
5, 1237–1261, 2008 Methane emissions in drained peat agro-ecosystems A. P. Schrier-Uijl et al. Title Page Abstract Introduction Conclusions References Tables Figures ◭ ◮ ◭ ◮ Back CloseFull Screen / Esc
Printer-friendly Version
Interactive Discussion production is the combination of wet soil, the application of easily decomposable
or-ganic material and the anaerobic conditions in the slurry. The only month for which we found significant correlation between soil moisture and CH4emission rates was April –
the period when the field begins to dry out after being waterlogged in winter and when air temperature may rise rapidly from 10 to 25◦C. The correlation between depth to
5
water table (65 to 15 cm) and CH4fluxes at both sites was not significant: the highest
fluxes occurred at intermediate and sometimes high water tables. In both sites the wa-ter table fluctuated not only seasonally, but also because of hydraulic regulation by the Dutch water board. In both sites, the impermeable soil prevented water from infiltrating after heavy rain, resulting in perched water tables in winter. The large variation in the 10
water table could explain the weak correlation between water table and CH4emissions. Ditch-edge CH4 fluxes correlated significantly with soil and air temperature, but not
with soil moisture content except, as in the fields, for April (positive correlation). At both sites the edge fluxes were significantly higher than the field fluxes. The edges border the ditches and so were damp for most of the year, with soil moisture contents >60%. 15
These damp conditions give rise to a different vegetation than in the dry fields: in some places Iris pseudacorus and Typha angustifolia are present. These aerenchymatic plants might cause additional fluxes because CH4diffuses rapidly through their stems.
4.2 Methane fluxes in other peatland ecosystems
Our measurements showed that both our drained sites are a net source of CH4 the
20
annual regression-based means were 258 and 114 kg ha−1 for the intensively man-aged site and less intensively manman-aged site, respectively. These values are in the same order of magnitude as fluxes found in other managed and unmanaged peatland ecosystems (Table 3). Van den Pol-Van Dasselaar et al. (1998a), who studied CH4 emissions in grassland on peat soils in a nature reserve elsewhere in the Netherlands, 25
reported great spatial variability; though the emission values in fields were similar to ours, the emission rates they found in saturated land were higher.
BGD
5, 1237–1261, 2008 Methane emissions in drained peat agro-ecosystems A. P. Schrier-Uijl et al. Title Page Abstract Introduction Conclusions References Tables Figures ◭ ◮ ◭ ◮ Back CloseFull Screen / Esc
Printer-friendly Version
Interactive Discussion et al. (2007) for a site some 35 km from our research area. They studied the full
greenhouse gas balance of a peatland on comparable soils that had not been inten-sively farmed for >10 years but left unmanaged, with a high water table. Their esti-mated total weighted (per landscape element), regression-based annual methane flux of 417 kg ha−1, was higher than both our estimated, weighted regression-based annual
5
methane fluxes: 258 and 114 kg ha−1 for the intensively and less intensively managed sites, respectively. The estimated annual emission rate of 18.72 mg m−2hr−1in ditches reported by Minkkinen and Laine (2006) is also higher than the regression-based fluxes from our ditches. The extremely high emission rates from ditches found by Minkkinen and Laine (2006) and by Bubier et al. (1993) were similar to the extreme values we 10
found at turbulent water conditions. However, when we took account of the farm-based emissions (which are ∼64% of total emissions), our estimated annual methane flux was 725 kg ha−1 in the intensively managed site. Compared with the values found in formerly intensively farmed peatland (Hendriks et al., 2007), this estimated annual methane flux is ∼42% lower, whereas the fluxes from our less intensively managed site 15
are ∼84% lower.
For the total balance (i.e. CO2plus CH4) we used data from Veenendaal et al. (2007) who performed CO2 eddy correlation measurements in our intensively and less
inten-sively managed sites. The inteninten-sively managed site had a net annual CO2 emission
of 122 g C m−2, whereas the less intensively managed site had a net annual CO2 up-20
take of 57.6 g C m−2. The resulting annual sources obtained when the terrestrial annual
methane emissions were included (using global warming potentials of 23 for CH4, IPCC
2001) were of 567 and 138 g C m−2CO2eq, respectively. The restored site studied by
Hendriks et al. (2007) was found to be a very small sink of 269 g C m−2. These esti-mates of the total balance in the intensively and less intensively managed sites do not 25
include nitrous oxide (N2O) emissions. The N2O fluxes found for the restored site were
BGD
5, 1237–1261, 2008 Methane emissions in drained peat agro-ecosystems A. P. Schrier-Uijl et al. Title Page Abstract Introduction Conclusions References Tables Figures ◭ ◮ ◭ ◮ Back CloseFull Screen / Esc
Printer-friendly Version
Interactive Discussion 4.3 Conclusion
Our study has demonstrated the value of stratifying the landscape when calculating annual CH4 balances. We found that in managed, eutrophic peat areas, the ditches and their adjacent saturated edges are CH4 emission hotspots. However, the results
were not clearcut, due to the occurrence of episodic emission under turbulent water 5
conditions in ditches. It can be concluded that by comparison with less intensively managed areas and restoration areas, the intensively managed area is a large source of methane when farm methane fluxes are included.
Acknowledgements. This study was funded by Wageningen University, The Province of North
Holland, CarboEurope IP (contract number: GOCE-CT-2003-505572) and the Klimaat voor
10
Ruimte Project (BSIK). Many thanks to J. van Walsem and F. M ¨oller for their help in the field and the lab and to the Van Eijk and Van Eeuwijk families for their logistical support. We are grateful to the State Forestry Service for access to the site and to N. de Bruin for his collaboration. J. Burrough advised on the English.
References
15
Adrian, N. R., Robinson, J. A., and Suflita, J. M.: Spatial variability in biodegradation rates as evidenced by methane production from an aquifer, Appl. Environ. Microb., 60, 3632–3639, 1994.
Bellisario, L. M., Bubier, J. L., Moore, T. R., and Chanton, J. P.: Controls on ch4 emissions from a northern peatland, Global Biogeochem. Cy., 13, 81–91, 1999.
20
Blodau, C. and Moore, T. R.: Experimental response of peatland carbon dynamics to a water table fluctuation, Aquat. Sci., 65, 47–62, 2003.
Bubier, J., Costello, A., Moore, T. R., Roulet, N. T., and Savage, K.: Microtopography and methane flux in boreal peatlands, northern ontario, canada, Can. J. Bot., 71, 1056–1063, 1993.
25
Chanton, J. P., Whiting, G. J., Happell, J. D., and Gerard, G.: Contrasting rates and diurnal patterns of methane emission from emergent aquatic macrophytes, Aquat. Bot., 46, 111– 128, 1993.
BGD
5, 1237–1261, 2008 Methane emissions in drained peat agro-ecosystems A. P. Schrier-Uijl et al. Title Page Abstract Introduction Conclusions References Tables Figures ◭ ◮ ◭ ◮ Back CloseFull Screen / Esc
Printer-friendly Version
Interactive Discussion
Christensen, T. R., Ekberg, A., Strom, L., Mastepanov, M., Panikov, N., Mats, O., Svens-son, B. H., Nykanen, H., Martikainen, P. J., and OskarsSvens-son, H.: Factors controlling large scale variations in methane emissions from wetlands, Geophys. Res. Lett., 30(7), 1414, doi:10.1029/2002L016848, 2003.
Groffman, P. M., Brumme, R., Butterbach-Bahl, K., Dobbie, K. E., Mosier, A. R., Ojima, D.,
5
Papen, H., Parton, W. J., Smith, K. A., and Wagner-Riddle, C.: Evaluating annual nitrous oxide fluxes at the ecosystem scale, Global Biogeochem. Cy., 14, 1061–1070, 2000. Hamilton, J. D., Kelly, C. A., Rudd, J. W. M., Hesslein, R. H., and Roulet, N. T.: Flux to the
atmo-sphere of ch4 and co2 from wetland ponds on the hudson-bay lowlands (hbls), J. Geophys. Res.-Atmos., 99, 1495–1510, 1994.
10
Hargreaves, K. J. and Fowler, D.: Quantifying the effects of water table and soil temperature on the emission of methane from peat wetland at the field scale, Atmos. Environ., 32, 3275– 3282, 1998.
Hendriks, D. M. D., Van Huissteden, J., Dolman, A. J., and van der Molen, M. K.: The full greenhouse gas balance of an abandoned peat meadow, Biogeosciences, 4, 411–424, 2007,
15
http://www.biogeosciences.net/4/411/2007/.
Huttunen, J. T., Nykanen, H., Turunen, J., and Martikainen, P. J.: Methane emissions from natural peatlands in the northern boreal zone in finland, fennoscandia, Atmos. Environ., 37, 147–151, 2003.
Liblik, L. K., Moore, T. R., Bubier, J. L., and Robinson, S. D.: Methane emissions from wetlands
20
in the zone of discontinuous permafrost: Fort simpson, northwest territories, canada, Global Biogeochem. Cy., 11, 485–494, 1997.
Mikaloff Fletcher, S. E., Tans, P. P., Bruhwiler, L. M., Miller, J. B., and Heimann, M.: Ch4 sources estimated from atmospheric observations of ch4 and its c-13/c-12 isotopic ra-tios: 1. Inverse modeling of source processes, Global Biogeochem. Cy., 18(4), GB4004,
25
doi:10.1029/2004GB002223, 2004a.
Mikaloff Fletcher, S. E., Tans, P. P., Bruhwiler, L. M., Miller, J. B., and Heimann, M.: Ch4 sources estimated from atmospheric observations of ch4 and its c-13/c-12 isotopic ratios: 2. Inverse modeling of ch4 fluxes from geographical regions, Global Biogeochem. Cy., 18(4), GB4005, doi:10.1029/2004GB002224, 2004b.
30
Minkkinen, K. and Laine, J.: Vegetation heterogeneity and ditches create spatial variability in methane fluxes from peatlands drained for forestry, Plant Soil, 285, 289–304, 2006.
BGD
5, 1237–1261, 2008 Methane emissions in drained peat agro-ecosystems A. P. Schrier-Uijl et al. Title Page Abstract Introduction Conclusions References Tables Figures ◭ ◮ ◭ ◮ Back CloseFull Screen / Esc
Printer-friendly Version
Interactive Discussion
Nol, L., Verburg, P. H., Heuvelink, G. B. M., and Molenaar, K.: Effect of Land Cover Data on Nitrous Oxide Inventory in Fen Meadows, J. Environ. Qual., in press, 2008.
Pelletier, L., Moore, T. R., Roulet, N. T., Garneau, M., and Beaulieu-Audy, V.: Methane fluxes from three peatlands in the la grande riviere watershed, james bay lowland, canada, J. Geo-phys. Res.-Biogeo., 112(G1), G01018, doi:10.1029/2006JG000216, 2007.
5
Van den Bos, R.: Restoration of former wetlands in the netherlands; effect on the balance between co2 sink and ch4 source, Neth. J. Geosci., 82, 325–331, 2003.
Van den Pol-Van Dasselaar, A., Corre, W. J., Prieme, A., Klemedtsson, A. K., Weslien, P., Stein, A., Klemedtsson, L., and Oenema, O.: Spatial variability of methane, nitrous oxide, and carbon dioxide emissions from drained grasslands, Soil Sci. Soc. Am. J., 62, 810–817,
10
1998a.
Van den Pol-Van Dasselaar, A., Van Beusichem, M. L., and Oenema, O.: Effects of soil moisture content and temperature on methane uptake by grasslands on sandy soils, Plant Soil, 204, 213–222, 1998b.
Van den Pol-Van Dasselaar, A., Van Beusichem, M. L., and Oenema, O.: Methane emissions
15
from wet grasslands on peat soil in a nature preserve, Biogeochemistry, 44, 205–220, 1999. Van Huissteden, J., Maximov, T. C., and Dolman, A. J.: High methane flux from an arctic
floodplain (indigirka lowlands, eastern siberia), J. Geophys. Res.-Biogeo., 110(G2), G02002, doi:10.1029/2005JG000010, 2005.
Waddington, J. M. and Day, S. M.: Methane emissions from a peatland following restoration, J.
20
BGD
5, 1237–1261, 2008 Methane emissions in drained peat agro-ecosystems A. P. Schrier-Uijl et al. Title Page Abstract Introduction Conclusions References Tables Figures ◭ ◮ ◭ ◮ Back CloseFull Screen / Esc
Printer-friendly Version
Interactive Discussion
Table 1. Estimates of annual CH4fluxes (kg ha−1) for the intensively and less intensively man-aged sites by trapezoidal integration and linear regression.
Year Intensive management Less intensive management integration regression integration regression
Field 2005 98 – 98 – 2006 174 112 150 92 2007 221 – 48 – Ditch 2005 – – – – 2006 1508 702 1895 158 2007 2501a – 2130a – Edge 2005 – – – – 2006 2398 492 1,307 226 2007 778a – 538a – Total 2005 – – – – 2006 587 258 586 114 2007 733a – 515a – a
for the last two months of 2007 we used values from 2006. – not enough data yet to estimate a year balance.
BGD
5, 1237–1261, 2008 Methane emissions in drained peat agro-ecosystems A. P. Schrier-Uijl et al. Title Page Abstract Introduction Conclusions References Tables Figures ◭ ◮ ◭ ◮ Back CloseFull Screen / Esc
Printer-friendly Version
Interactive Discussion
Table 2. Estimated emissions from the intensive farm (kg CH4day−1) using the simple emission
factor approach as described by Hensen et al. (2005). Emission factors are those estimated by Van Amstel et al. (2003) and Sneath et al. (2006).
Emission factor Number Volume Calculated emission (g CH4day−1) (No) (m3
) (kg CH4day−1)
Dairy cow (Ed) 274 65 – 17.81
Heifer (Ey) 170 20 – 3.4
Calf (Ec) 48 10 – 1.44
Manure (slurry) (Es) 53 – 780a 41.34
Farmyard manure (FYM) 40 – 0 0
Total emission (kg CH4day−1) 63.99
a
Calculated from herd size and a production of 12 m3manure adult animal−1 for the whole
BGD
5, 1237–1261, 2008 Methane emissions in drained peat agro-ecosystems A. P. Schrier-Uijl et al. Title Page Abstract Introduction Conclusions References Tables Figures ◭ ◮ ◭ ◮ Back CloseFull Screen / Esc
Printer-friendly Version
Interactive Discussion
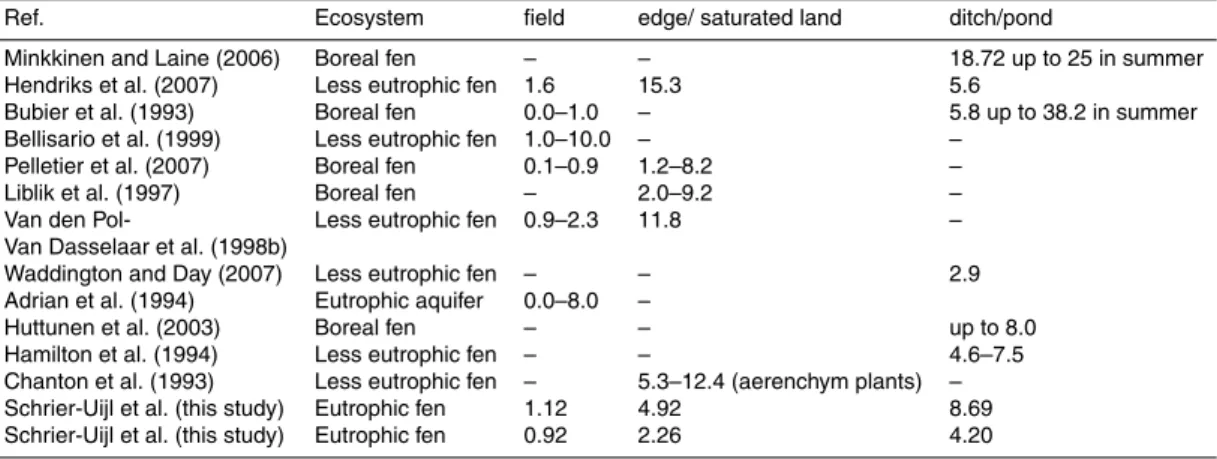
Table 3. Comparison between the CH4 emission rates in this study and the CH4 emission rates reported in other studies on peatland ecosystems. Mean CH4 emission rates are in mg CH4m−2hr−1and the three last columns on the right represent the landscape elements.
Ref. Ecosystem field edge/ saturated land ditch/pond
Minkkinen and Laine (2006) Boreal fen – – 18.72 up to 25 in summer
Hendriks et al. (2007) Less eutrophic fen 1.6 15.3 5.6
Bubier et al. (1993) Boreal fen 0.0–1.0 – 5.8 up to 38.2 in summer
Bellisario et al. (1999) Less eutrophic fen 1.0–10.0 – –
Pelletier et al. (2007) Boreal fen 0.1–0.9 1.2–8.2 –
Liblik et al. (1997) Boreal fen – 2.0–9.2 –
Van den Pol- Less eutrophic fen 0.9–2.3 11.8 –
Van Dasselaar et al. (1998b)
Waddington and Day (2007) Less eutrophic fen – – 2.9
Adrian et al. (1994) Eutrophic aquifer 0.0–8.0 –
Huttunen et al. (2003) Boreal fen – – up to 8.0
Hamilton et al. (1994) Less eutrophic fen – – 4.6–7.5
Chanton et al. (1993) Less eutrophic fen – 5.3–12.4 (aerenchym plants) –
Schrier-Uijl et al. (this study) Eutrophic fen 1.12 4.92 8.69
Schrier-Uijl et al. (this study) Eutrophic fen 0.92 2.26 4.20
BGD
5, 1237–1261, 2008 Methane emissions in drained peat agro-ecosystems A. P. Schrier-Uijl et al. Title Page Abstract Introduction Conclusions References Tables Figures ◭ ◮ ◭ ◮ Back CloseFull Screen / Esc
Printer-friendly Version Interactive Discussion Field Surface water Ditch edge Nature area Oukoop Oukoop Stein
Fig. 1. The location of the intensively and less intensively managed areas in the Netherlands (right) and a close up (middle) of the intensively manage area (Oukoop) and the less intensively managed area (Stein). The insets on the left are close-ups of Oukoop (the intensively managed area): they show the characteristic parcellation of the polder landscape in more detail: long, narrow land parcels bounded by ditches (by Nol et al., 2008).
BGD
5, 1237–1261, 2008 Methane emissions in drained peat agro-ecosystems A. P. Schrier-Uijl et al. Title Page Abstract Introduction Conclusions References Tables Figures ◭ ◮ ◭ ◮ Back CloseFull Screen / Esc
Printer-friendly Version Interactive Discussion 40 60 80 S o il m o is tu re (v o l. % ) 0 100 200 300 400 500 600 700 800 900 -5 0 5 10 15 20 25 30 A ir te m p e ra tu re (o C ) 0 200 400 600 800 1,000 Day number 2005 2006 2007
Fig. 2. Average (mean ±SD) soil moisture content (vol%) and air temperature (◦C) for the
intensively managed (red) and less intensively (blue) managed areas from day 0 (1 January 2005) to day 994 (21 September 2007).
BGD
5, 1237–1261, 2008 Methane emissions in drained peat agro-ecosystems A. P. Schrier-Uijl et al. Title Page Abstract Introduction Conclusions References Tables Figures ◭ ◮ ◭ ◮ Back CloseFull Screen / Esc
Printer-friendly Version Interactive Discussion -40 -20 0 20 40 60 80 100 F ie ld -200 0 200 400 600 800 D it c h 200 400 600 800 1,000 Day -400 -200 0 200 400 600 E d g e 0 200 400 600 800 1,000 Day 2005 2006 2007 2005 2006 2007
Fig. 3. Temporal variability of mean methane fluxes (mg m−2hr−1) in the various landscape
ele-ments for the intensively (left) and less intensively managed (right) sites from day 0 (1 January 2005) to day 994 (21 September 2007). Error bars show standard error of the mean.
BGD
5, 1237–1261, 2008 Methane emissions in drained peat agro-ecosystems A. P. Schrier-Uijl et al. Title Page Abstract Introduction Conclusions References Tables Figures ◭ ◮ ◭ ◮ Back CloseFull Screen / Esc
Printer-friendly Version
Interactive Discussion
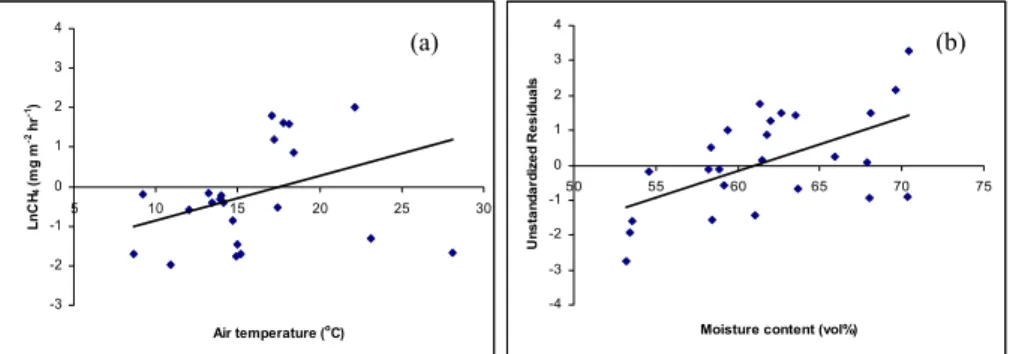
Figure 4. Relationship between ditch, edge and field LnCH4 fluxes and air -6 -4 -2 0 2 4 6 8 -5 0 5 10 15 20 25 30 L n C H4 f lu x ( m g m -2 h r -1) -6 -4 -2 0 2 4 6 8 -5 0 5 10 15 20 25 30 L n C H4 f lu x ( m g m -2 h r -1) -4 -2 0 2 4 6 -5 0 5 10 15 20 25 30 Air temperature (oC) L n C H4 f lu x ( m g m -2 h r -1) -4 -2 0 2 4 6 -5 0 5 10 15 20 25 30 Air temperature (oC) L n C H4 f lu x ( m g m -2 h r -1) -4 -2 0 2 4 6 8 0 10 20 30 L n C H4 f lu x e s ( m g m -2 h r -1) -3 -2 -1 0 1 2 3 4 5 6 7 8 0 10 20 30 L n C H4 f lu x e s ( m g m -2 h r -1) Ditch Ditch Edge Edge Field Field (a) (b)
Fig. 4. Relationship between ditch, edge and field LnCH4fluxes and air temperature; individual points and regression lines for (a) the intensively managed site and (b) the less intensively managed site.
BGD
5, 1237–1261, 2008 Methane emissions in drained peat agro-ecosystems A. P. Schrier-Uijl et al. Title Page Abstract Introduction Conclusions References Tables Figures ◭ ◮ ◭ ◮ Back CloseFull Screen / Esc
Printer-friendly Version Interactive Discussion -3 -2 -1 0 1 2 3 4 5 10 15 20 25 30 Air temperature (o C) L n C H 4 (m g m -2 h r -1) -4 -3 -2 -1 0 1 2 3 4 50 55 60 65 70 75
Moisture content (vol%)
U n s ta n d a rd iz e d R e s id u a ls
Figure 5. (A) The effect of temperature: the relation between natural logarithm-
(a) (b)
Fig. 5. (a) The effect of temperature: the relation between natural logarithm- transformed CH4 fluxes and air temperature in April and (b) the effect of moisture; the relation between unstandardized residuals after regression with temperature, and moisture content in April.
BGD
5, 1237–1261, 2008 Methane emissions in drained peat agro-ecosystems A. P. Schrier-Uijl et al. Title Page Abstract Introduction Conclusions References Tables Figures ◭ ◮ ◭ ◮ Back CloseFull Screen / Esc
Printer-friendly Version Interactive Discussion 0.000 5.000 10.000 15.000 20.000 25.000 30.000 0 2 4 6 8 10 12 14 16 18 20 22 0.000 0.050 0.100 0.150 0.200 0.250 0.300 0.350 Hour of day D itc h e m is si o n s ( m g m -2 d -1 ) D itc h e m is si o n s ( m g m -2 d -1 )
Fig. 6. Diurnal variation in regression-based estimated ditch emissions (mg m−2d−1) based on temperature during a day in winter (red squares, y-axis right), and a day in summer (blue circles, y-axis left).