HAL Id: hal-01252892
https://hal.archives-ouvertes.fr/hal-01252892
Submitted on 15 Nov 2016HAL is a multi-disciplinary open access
archive for the deposit and dissemination of sci-entific research documents, whether they are pub-lished or not. The documents may come from teaching and research institutions in France or abroad, or from public or private research centers.
L’archive ouverte pluridisciplinaire HAL, est destinée au dépôt et à la diffusion de documents scientifiques de niveau recherche, publiés ou non, émanant des établissements d’enseignement et de recherche français ou étrangers, des laboratoires publics ou privés.
High-resolution three-dimensional structural microscopy
by single-angle Bragg ptychography
S. O. Hruszkewycz, Marc Allain, M. V. Holt, C. E. Murray, J. R. Holt, P. H.
Fuoss, Virginie Chamard
To cite this version:
S. O. Hruszkewycz, Marc Allain, M. V. Holt, C. E. Murray, J. R. Holt, et al.. High-resolution three-dimensional structural microscopy by single-angle Bragg ptychography. Nature Materials, Nature Publishing Group, 2017, 16, pp.244-251. �10.1038/nmat4798�. �hal-01252892�
High resolution three dimensional structural microscopy by single angle
Bragg ptychography
S. O. Hruszkewycz,1 M. Allain,2 M. V. Holt,3 C. E.
Murray,4 J. R. Holt,5 P. H. Fuoss,1 and V. Chamard2
1Materials Science Division, Argonne National Laboratory, Argonne, Illinois 60439, USA
2Aix-Marseille University, CNRS, Centrale Marseille,
Institut Fresnel, UMR 7249, 13013 Marseille, France
3Center for Nanoscale Materials, Argonne National Laboratory, Argonne, Illinois 60439, USA
4IBM T.J. Watson Research Center, Yorktown Heights, New York 10598, USA
5IBM Semiconductor Research and Development Center,
Hopewell Junction, New York 12533, USA
(Dated: October 7, 2016)
Abstract
Coherent x-ray microscopy by phase retrieval of Bragg diffraction intensities enables lattice distortions within a crystal to be imaged at nanometer-scale spatial resolutions in three dimensions (3D). While this capability can be used to resolve structure-property relationships at the nanoscale under working conditions, strict data measurement requirements can limit the application of current approaches. Here, we introduce an efficient method of imaging 3D nanoscale lattice behavior and strain fields in crystalline materials with a new methodology: 3D Bragg projection ptychography (3DBPP). This method enables 3D image recon-struction of a crystal volume from a series of two dimensional x-ray Bragg coherent intensity diffraction patterns measured at a single incident beam angle. Structural information about the sample is encoded along two reciprocal space directions normal to the Bragg diffracted exit beam, and along the third dimen-sion in real space by the scanning beam. We present our approach with an analytical derivation, a numerical demonstration, and an experimental reconstruction of lattice distortions in a component of a nanoelectronic prototype device.
INTRODUCTION
Hard x-ray coherent diffraction microscopy methods based on inversion of Bragg diffraction intensities enable the sensitivity of x-rays to crystalline distortions in materials to be leveraged in order to reveal the interplay between structure and properties without disturbing environmental boundary conditions [1–5]. Such inversion-based approaches require that coherent diffraction pat-terns be numerically inverted into real space by determining the phase of the diffracted field, which is not measured experimentally. As was noted by Sayre [6] and experimentally demonstrated by Miao et al. [7], the phase and amplitude of x-ray scattering can be determined from redundant information contained in an oversampled diffraction intensity pattern. The resulting images con-tain quantitative information that encodes local physical parameters such as density and atomic displacement at sub-beam-size spatial resolutions. This principle has inspired the development of phase-retrieval-based coherent x-ray diffraction imaging approaches in recent decades that rely on iterative numerical methods to determine the sample structure [8].
The development of ptychography [9, 10] as a technique to determine the phase of scattering from an extended object has greatly expanded the range of samples that can be studied using coherent x-ray diffraction imaging. In ptychography, the structural information about the sample is encoded by measuring a series of diffraction patterns at a set of overlapping beam positions [11, 12]. The information obtained from the hundreds of overlapping diffraction patterns measured in a typical ptychography experiment greatly overdetermines the structure of the sample and leads to very robust reconstructions used to image a wide variety of samples [13, 14]. Moreover, the information redundancy is so large that additional parameters can simultaneously be retrieved, e.g., the initial probe and positions [15], mode structure [16], multiple sample planes [17]. Thus, identifying new ways of leveraging the overdetermined nature of a ptychographic measurement can enable additional, unexpected components of a scattering system to be determined.
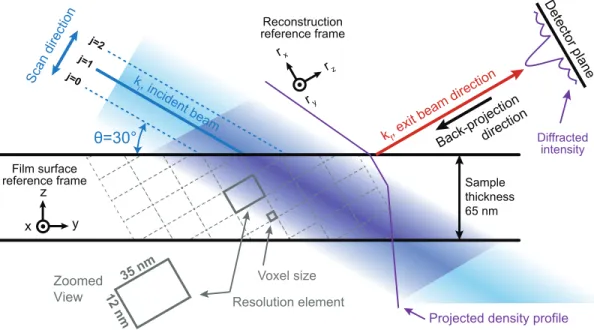
In this article, we exploit the information content of a set of 2D coherent diffraction patterns measured at a crystalline Bragg peak in order to reconstruct a 3D strain-sensitive image of an extended sample using a new technique, 3D Bragg Projection Ptychography (3DBPP). 3DBPP is a hybrid real / reciprocal space technique that uses the raster motion of a focused x-ray beam in combination with 2D Bragg diffraction intensity patterns measured at each position, eliminating the need to change the sample angle. The central concept underpinning our approach is shown in Figure 1. The projected structural profile within a column defined by the shape of the incident
x-ray beam can be determined from a Bragg diffraction intensity pattern, presuming the phases are known, via a Fourier transformation. At a given Bragg angle, translating the beam in two dimen-sions (into/out of the page and towards/away from the detector) results in diffraction patterns that yield structure profiles within different columns of the 3D crystal. With a set of structural profiles from overlapping beam positions, the known translational relationship of those profiles can be used to reconstruct the 3D morphology and strain of the crystal. In other words, each 2D diffrac-tion pattern contains informadiffrac-tion regarding a projecdiffrac-tion of the 3D sample structure illuminated by the beam. When two or more projections are considered from beam positions that overlap, the 3D sample structure that is simultaneously consistent with the observed diffraction is constrained. To first order, as the beam size decreases and (to a certain extent) overlap increases, the reconstructed 3D structure is increasingly constrained and necessarily approaches the true structure. This 3D reconstruction concept is unique in that two dimensions of the problem are encoded in reciprocal space by the diffraction in the detector, and the third dimension is encoded in real space by the displacement of the beam towards the detector. In this way, our approach exploits the high angle of separation between the incident and diffracted wave vectors, as has been demonstrated in other work for 3D imaging from a single view [18, 19].
In 3DBPP, the localized columnar illumination of the beam intersecting the sample at a given position in the Bragg geometry connects the real and reciprocal space information. In practice, the phases of each diffraction pattern must also be determined. In this work, we show that this is possible, by exploiting the large information redundancy contained in a Bragg ptychography data set. As such, 3DBPP introduces a new avenue by which to unlock the information contained in a set of far-field coherent x-ray diffraction patterns that will enable materials phenomena to be visualized in 3D in working environments with simplified experimental requirements.
BACKGROUND
3DBPP features concepts utilized in other reconstruction-based microscopy methods, specifi-cally, from Bragg coherent diffraction imaging, ptychography, and tomography. Bragg coherent diffraction imaging is based on the measurement of the far-field intensity distribution in the vicinity of a Bragg peak via the Bragg rocking curve (changing the sample angle relative to the incoming beam and combining successive 2D slices into a 3D Bragg intensity pattern) [20]. A 3D image of a diffracting crystal can then be numerically retrieved from the measured intensity distribution using
Sample thickness 65 nm y z x Film surface reference frame rz rx ry Reconstruction reference frame k i, incident beam θ=30° Scan direction
kf, exit beam direction
Projected density profile
Back-projectiondirection Detector plane Diffracted intensity Resolution element 35 nm 12 nm Zoomed View Voxel size j=0 j=1 j=2
FIG. 1. Encoding 3D structure at a single Bragg angle. The sample shown here is a film with a thickness of 65 nm, corresponding to the thickness of the SiGe filmed measured in the experimental demonstration (Figures 3-5). For simplicity, the geometry shown depicts the 2D scattering plane and is used as the basis of the analytical derivation. Here, the area detector contains the rx, ry direction vectors, and measures
reciprocal space coherent diffraction intensity patterns Ij(qx, qy)at each beam position (j = 0, 1, 2, ...).
The rz direction corresponds to the exit beam direction of the Bragg condition. The focused x-ray beam
scan consists of displacing the beam normal to its propagation direction. The essence of 3DBPP is that structural information about the sample along rx, ryis encoded in the coherent diffraction patterns measured
with the area detector (Ij(qx, qy)), and the structure along rz is probed directly by the scanning the beam
with component of displacement along that direction. The r reference frame sets the orientation of the voxels of the 3D reconstruction and of the resolution element. As shown, the edges of the voxels and the resolution elements do not line up with surface of the film. Thus, for convenience, we introduce a second reference frame (x, y, z) that is used to in our discussion of the structural features of the thin film. In the experimental demonstration, this reference frame corresponds to low-index crystallographic directions in the SiGe crystal: x||[110], y||[ 110], and z||[001].
iterative algorithms with a constraint based on the rough dimensions of the sample [21]. Similar imaging capabilities can be realized for extended crystals (e.g. thin films) via ptychography ap-plied to Bragg coherent diffraction patterns [14, 22–27]. However, for 3D Bragg ptychography, the requirement of full rocking curve measurements at each overlapping beam position results in long measurement times and uncertainties with regard to registration. 3DBPP avoids measuring the full angular rocking curve of the Bragg peak by exploiting the fact that a 2D far-field Bragg diffraction pattern is related to the Fourier transform of a 2D projection of the illuminated sample volume [28]. This relationship enables 3D imaging from 2D diffraction patterns by incorporating projection and back-projection operations utilized in computed tomography [29, Sec. 6.3.3] [30,
Sec. 6.2] into an iterative x-ray phase retrieval strategy. Thus, we relate a set of 2D high-angle Bragg coherent diffraction patterns measured at a fixed angle to a 3D real-space sample structure.
PRINCIPLES OF 3D BRAGG PROJECTION PTYCHOGRAPHY
Due to the geometry of a crystalline Bragg condition, the angular diversity central to other 3D imaging modalities can be replaced by translational diversity of a localized beam. At a Bragg condition, the incident and scattered wavevectors are not collinear but, in the hard x-ray regime, are typically separated by tens of degrees. As a result, the spatial information that is collapsed along the exit beam direction in any individual 2D projection can be encoded in the data set by
translating a localized x-ray beam in overlapping steps in the plane normal to ki, the propagation
direction of the incident beam (Figure 2(a, b)).
In 3DBPP, the inversion procedure is based on the description of the beam/crystal interaction in the Bragg geometry. At a given beam position, the intensity pattern recorded by the x-ray camera
in the far field is the squared amplitude of the diffracted wave field j:
hIji = | j|2, (1)
where Ij is the intensity pattern corresponding to the j-th beam position. The intensity pattern
recorded in the detector is subject to counting statistics, and so Equation 1 defines an expectation
value hIji. We adopt the convention [31] that in a coherent Bragg diffraction imaging experiment,
the origin of reciprocal space (qx = 0, qy = 0, qz = 0)corresponds to a Bragg condition denoted
by the reciprocal space vector GHKLfor a given HKL-index Bragg reflection. At a Bragg
condi-tion, the diffracted wave j is related to the 3D diffracting crystal ⇢ and the beam Pj (also referred
to as the probe) according to [28, 32]:
j =FRPj⇢, (2)
where F is the (bidimensional) Fourier transform, R is the (3D) x-ray projection operator along
the exit beam direction [30, Sec. II.2]. In this Equation, Pj and ⇢ are complex-valued three
dimensional quantities. The phase and amplitude of ⇢ are related to the Bragg structure factor [27], which is sensitive to atomic-scale structure in the material. Reconstructing ⇢ thereby enables local distortions of the crystal lattice to be imaged and quantified.
3DBPP reconstruction using far-field diffraction Cross section of numerical sample
Cross-section of 3DBPP reconstruction equivalent to a) X-ray area
detector
Bragg exit beam
wave vector, x-ray beamFocused
Extended crystal, Density voids Bragg projection vector j=1 Beam projection j=2 Beam projection Position 2 back-projection, Position 1 back-projection j=1 Beam projection j=2 Beam projection Support Incident beam wave vector, Far-field diffraction, Bragg back-projection vector b) c) d) e) f) a) g) Detector plane
Internal density voids
0 1 Beam translation directions ry rz rx qy qx rz rx rz rx Voxel orientation
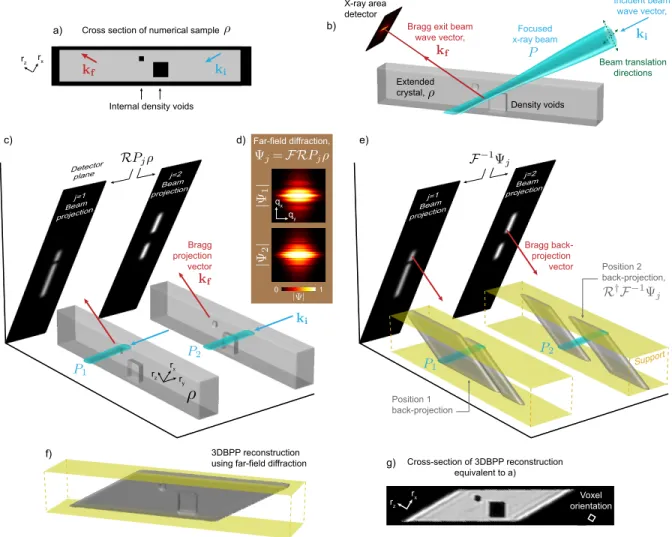
FIG. 2. The principles of 3DBPP: a) A 3D strain free crystal was generated (⇢) containing two internal voids, and a 3DBPP experimental geometry was simulated (b) using a focussed gaussian beam profile at a high angle Bragg condition defined by the kiand kf incident and exit beam vectors. We define real space
axes (rx, ry, rz) such that kf || rz and (rx, ry) lie in the detector plane, conjugate to (qx, qy) in the far
field. In order to calculate diffraction patterns, projections along kf of the illuminated crystal (RPj⇢) in the
(rx, ry)plane are determined (c) at beam positions that intersect the two voids in ⇢. The far-field diffraction
amplitudes | j| determined by Fourier transforming the projections are shown in d). The inverse process is
shown in e) where, starting from the far-field diffraction j, the inverse Fourier transform again yields the
2D projections of the illuminated crystal. The operator critical to 3DBPP is the backprojection (R†) of the
quantity F 1
j along the kf direction. The backprojection “stretches” the 2D projections along kf within
a 3D support. In this case, the support is made of a pair of planes that limit the extent of the reconstruction in the z direction. Here, the backprojection intersects the probe at an oblique angle, effectively localizing the scattering volume. With 3DBPP, ⇢ was reconstructed (f,g) using these operators from a set of 2D coherent Bragg diffraction intensity patterns (See Methods for details).
For 3DBPP phase retrieval, a ptychographic inversion algorithm is used to reconstruct ⇢ from a
set of J intensity patterns {Ij}J 1j=0. The numerical approaches that have successfully been used in
transmission geometry ptychography experiments (i.e., difference MAP [12, 33], ordered-subset (OS) / Ptychographic Iterative Engine algorithm (PIE) [11, 34, 35] or gradient-type iterations [35– 37]) can be adapted to accommodate 3DBPP by incorporating a new gradient based on the cost function Q(⇢): Q(⇢) = J 1 X j=0 Qj(⇢) with Qj(⇢) :=|| | j(⇢)| p Ij||2. (3)
In 3DBPP, this cost function yields the following gradient @j for each probe position:
@j = Pj⇤R†F 1 ✓ j p Ij j | j| ◆ , j = 0· · · J 1, (4)
where ’⇤’ is the conjugate operator and R† is the adjoint (i.e. backprojection) operator [30, Eq.
2.31] associated with the forward-projection operator R. In this work, we incorporated the gra-dient (Equation 4) into an iterative OS/PIE algorithm [38] that progressively lowered the cost function Q and reconstructed an image of the diffracting crystal ⇢ (see Methods).
Thus, a successful 3DBPP reconstruction must retrieve the three-dimensional spatial compo-nents encoded in a measured set of Bragg diffraction patterns. Conceptually, the 3D reconstruction is enabled by two factors. First, each individual intensity pattern, when phased, gives access to
the projected scattering volume for each beam position (the quantity F 1
j in Figure 2).
Sec-ond, the backprojection of this quantity is localized to a specific volume of the crystal because the relative probe positions are known and the angle between the incident and exit angle of the Bragg condition is non-zero. 3DBPP extracts this 3D information by utilizing overlapping probe positions in order to recover the relative phases of the diffraction patterns and a 3D reconstruction of ⇢. The thin film reconstructions featured in this work were further constrained with a support that confined the extent of the object along the surface-normal direction (as shown in Figure 2). For other samples, different position-referencing constraints may be implemented that serve the same function. We also note that probe reconstruction has not been implemented in this study due to the fact that as stated in Refs [23, 25], retrieving both a 3D probe and 3D crystal in a Bragg ptychography experiment has been seen to adversely affect the reconstruction quality due to the lack of constraints along the propagation direction. In this work, the wavefunction of the probe at
the sample is known or determined a-priori and is not further refined during image reconstruction. A numerical demonstration of 3DBPP is featured in Figure 2. We define a 3D thin-film object of uniform density, and introduce two cubic voids in the center of the film. A numerical set of 2D coherent diffraction patterns was generated using Equation 2 by scanning a purely real gaussian beam through the central region of the film in overlapping steps (probe profile shown in Sup. Figure S5). Using 3DBPP implemented with an OS/PIE inversion algorithm, the 3D internal structure of the film in the scanned field of view was successfully reconstructed from this set of 2D patterns (Figure 2(f, g)). (See Methods for more details on this numerical test, and Sup. Figure S12 for additional images of the reconstruction.)
We also emphasize that, as opposed to previous 3D Bragg ptychography approaches [23–25], this 3DBPP method is not one of pure Fourier synthesis in which the properties of the 3D recon-struction depend strictly on the measurement and sampling of a 3D volume of reciprocal space. 3DBPP is also distinct from multi-slice reconstruction methods [17], as it does not rely on higher order interactions between the beam and the sample. The following derivation highlights the means in which 3D spatial information is encoded in a scanning probe Bragg ptychography mea-surement at a single sample angle.
For the sake of simplicity, we assume that the scanning probe moves in the direction of the exit
beam (kf), with a regular step-size (Figure 1 and Supplemental Figure S1). In this case, the
complex-valued diffracted field j(qx, qy)at the j-th probe position illuminating a 3D sample can
be expressed as: j(qx, qy) = ZZ rx,ry g(rx, ry, rz = j )e i(rxqx+ryqy)drxdry⇥ 1 (2⇡)2 (5) where g(rx, ry, rz) := (⇢⌦rz P0)(rx, ry, rz).
In this expression, ⌦rz is a 1D convolution operator that acts solely along the backprojection
direction rz, and the probe is written as P0(rx, ry, rz) := P (rx, ry, rz). This expression (5) shows
that, as expected for an area detector measurement, j depends on two orthogonal reciprocal
space directions qx and qy that encode structure along rx and ry. However, Equation (5) also
clearly demonstrates that a series of Bragg diffraction patterns measured with a scanning beam
also encodes sample structure along rz — the direction to which any single diffraction pattern is
j on the sample structure along rz without requiring angular diversity.
Under appropriate conditions, our OS/PIE 3DBPP approach can in principle reach
sub-beam-size resolution along rx, ry, rz because the 3DBPP inversion algorithm inherently deconvolves the
object from the probe along the direction of backprojection. This deconvolution comes about
because diffracted intensities (| j|2) are measured, and a non-linear iterative phase retrieval
algo-rithm must be invoked that relates | j|2 directly to the sample estimate ⇢ (as opposed to g). This
approach provides a momentum-transfer-limited resolution limit in rx, ry (as is typical in 2D
pty-chography), and it “builds-in” a degree of probe deconvolution along the backprojection direction
rz. While sub-beam resolution is in principle obtainable, the extent to which the deconvolution in
rz is realized depends on spatial sampling and the signal to noise ratio of the data.
In the absence of noise, three conditions must be satisfied in order to enable a reconstruction with sub-beam-size resolution in three dimensions: 1) the sampling in the area detector is at least twice the Nyquist rate (as in typical coherent diffraction methods), 2) the spatial sampling rate
(the probe scan step size) along rz fulfills twice the Shannon-Nyquist condition with respect
to the spectral bandwidth of the probe in that direction, and 3) the probe spectrum is non-zero over a wide range of spatial frequencies (e.g., spectral tails that damp but do to extinguish high frequency terms). When noisy intensity patterns are considered, the maximum extent in q-space to which photons are detected from the central Bragg peak position limits the resolution along the
rxand ry directions. The resolution along the third direction, rz, depends on the ability to observe
differences between intensity patterns from two overlapping probe positions displaced by a small . Typically, these differences manifest themselves in the weakly scattering high-q regions of the
diffraction patterns. Thus, the resolution along rz also depends on the SNR of the measurement.
With simulated data, we demonstrated sub-beam-size resolution along rzwith noise-free and noisy
data (Figure 2, Sup Figure S2). However, under actual experimental conditions, we expect modest
gains in rzresolution beyond the probe size, as shown in our results in the next section. In addition,
we expect the uniqueness of the 3DBPP reconstruction to be similar to other CDI experiments that are appropriately oversampled [39]. We also note that the nature of 3DBPP is such that there are no fundamental restrictions on the morphology or shape of the sample so long as the kinematic scattering approximation holds.
SiGe stressors Buried oxide SOI a) Scan points Exit beam, Incident beam, Area detector b) x [110] y [-110] z [001] 25 µm 100 nm 100 nm b) c) Complex
color scale: 0 Brightness = amplitudeColor = phase 0 π π 2 3π 2 0 1 sqrt( intensity )
Positions featued in (d,e)
d) Experimental diffraction patterns
e) Simulated diffraction patterns from FEM model
1 2 3 4 5 6 7 Position 1 2 Position 1 2 3 3 4 4 5 6 7 5 6 7 ry rz || kf rx
FIG. 3.Experimental geometry. (a) A schematic of the device architecture is shown featuring the embed-ded SiGe stressor geometry. For 3DBPP, coherent diffraction patterns were measured at the specular 004 SiGe Bragg peak at a set of beam positions that effectively overlapped in a series of spiral patterns. The diffraction patterns from all 707 positions were phased simultaneously with 3DBPP. (b,c) Prior to diffracting from the eSiGe, the beam wavefront was reconstructed using Fresnel ptychography of a test pattern in the transmission geometry. (d-e) Examples of 004 coherent Bragg intensity patterns used for 3DBPP imaging are shown from different regions of the stressor indicated in (a). Patterns (d-e) correspond to the positions indicated with blue dots in (a) from left to right. See Methods and Ref [40] for more details.
EXPERIMENTAL DEMONSTRATION
To demonstrate 3DBPP, we imaged the internal lattice displacement field within a sub-micron-scale crystalline component of a semiconductor prototype device (Figure 3). The device struc-ture consisted of periodic embedded SiGe (eSiGe) crystals 460 nm in width that were epitaxially grown to a thickness of 65 nm interstitially between 60-nm-wide linear silicon-on-insulator (SOI) channels (shown in Figure 3(a)). This sample design and processing (see Methods) resulted in a complex internal stress state and an accompanying strain field that evolves within the eSiGe stres-sors in the x (in-plane) and z (out-of-plane) directions, and is self-similar along the other in-plane direction, y [40]. In particular, the variation of the eSiGe strain field as a function of depth – vari-ations to which 2D BPP is insensitive [40] – has a direct impact on the electron mobility within the SOI channels in this system and is a critical parameter for nanoscale device engineering.
Coherent nanodiffraction patterns were measured from several adjacent eSiGe stressor crystals with a zone-plate-focused hard x-ray beam at a symmetric 004 Bragg condition in which the angle
between kiand kf was about 60 (see Methods and Figure 3). We note here that the experimental
data collection methodology of 3DBPP is exactly the same as that of previously reported 2D BPP experiments [14, 26, 27, 40]. However, using our new imaging concept, 3D images can now be reconstructed from data that previously yielded 2D projection images [41]. Using these Bragg diffraction patterns, a 3DBPP reconstruction was generated using an iterative algorithm that incorporated the gradient in Equation 4 into an ordered subset / PIE framework [34, 35]. Because the coherent diffraction observed in the vicinity of the eSiGe 004 Bragg condition (denoted by
the reciprocal space vector G004) was well separated from scattering from the other components
of the device (i.e. SOI and substrate), the reconstruction represents only the stressor structures. To aid in the determination of the relative phase relationship of the intensity patterns, a 90-nm-thick support that confined the extent of the reconstruction along z was incorporated into the reconstruction. This support constrained the intersection of each backprojection and respective probe function to within a physically realistic pair of parallel planes surrounding the 65-nm-thick film (see Methods). To describe the reconstruction, we adopted a coordinate system (x, y, z) such that the top surface of the stressor lies in the x, y plane, and z is the out-of-plane direction. This
convention is distinct from the coordinate system of the reconstruction voxels (rx, ry, rz) that are
defined by the orientation of the area detector, as noted in the previous sections.
As expected for strained crystals, the resulting reconstructed 3D sample ⇢ is a complex-valued function, ⇢ = |⇢| exp i . The amplitude |⇢| is directly related to the electron density of the crystal
and the phase is sensitive to a component of the displacement field in the crystal given by
= G004 · u, where u is the crystalline displacement field relative to an arbitrary crystalline
reference [20].
The external shape of the reconstructed amplitude is shown in Figure 4b as an iso-surface cor-responding to 27% of the maximum amplitude value. The reconstructed shape shows the eSiGe features expected of this prototype device, including the two missing strips in amplitude corre-sponding to the positions of SOI channels. The internal structure of the reconstructed stressors is shown in Figure 4(c,d). The vertical cuts through the reconstruction show that the amplitude is mostly homogeneous with well defined in-plane edges where the eSiGe meets the SOI. For this
stressor, the displacement of the crystal lattice along the [001] direction, u001, was derived from
b) 3DBPP reconstruction 250 300 50 100 150 200 100.1 100.3 100.5 Iteration number 100.7 a) 3DBPP cost function eSiGe stressors
SOI Channel Locations
Scan points x [110] y [-110] z [001] (a.u.) 0 1 (Å) 0 -1 cut-plane A cut-plane B 3DBPP Amplitude [001] lattice displacement SOI Channel Locations
60 nm c) d) central stressor Amplitude isosurface 100 nm cut-plane A ry rz rx
FIG. 4.3D Bragg projection ptychography experimental results Coherent diffraction patterns measured at the 004 SiGe Bragg peak were phased using 300 iterations of the OS/PIE algorithm adapted for 3DBPP. (a) The cost function, Q(⇢), is shown as a function of iteration number. (b) The isosurface of the amplitude of the resulting reconstruction, showing gaps at the positions of the SOI channels. The internal structure of the SiGe material in the field of view is revealed by way of cuts through the isosurface depicting the amplitude of the reconstruction, which is closely related to the material density (c), as well as the crystal lattice displacement along the [001] direction (d) which is derived from the phase of the reconstruction.
architecture, u001 varies in the (x, z) plane. The key capability of 3DBPP is demonstrated by the
fact that out-of-plane lattice distortions in this cross-section that require a 3D reconstruction were resolved with a fixed-angle scanning probe diffraction measurement.
A crucial issue in this study is the quantification of the resolution obtained in the reconstruc-tion, as this will dictate the utility of 3DBPP in the measurement of lattice distortions in different nanoscale crystalline systems. We used the Fourier shell correlation (FSC) method as detailed in Refs [42, 43]. FSC is based on a spectral comparison of two independent reconstructions of ⇢
generated, in this case, by splitting the 3DBPP data into half-data sets that were phased seperately (see Methods). Because FSC uses two half-data sets, the resolution estimates tend to be
conser-vative. Using FSC, the spatial resolution along rx, ry, rz were estimated to be 12, 29, and 35 nm
respectively. In this experimental reconstruction, we achieved modest gains in spatial resolution
beyond the probe size in the rz direction (FWHMprobe = 46 nm). With a higher signal-to-noise
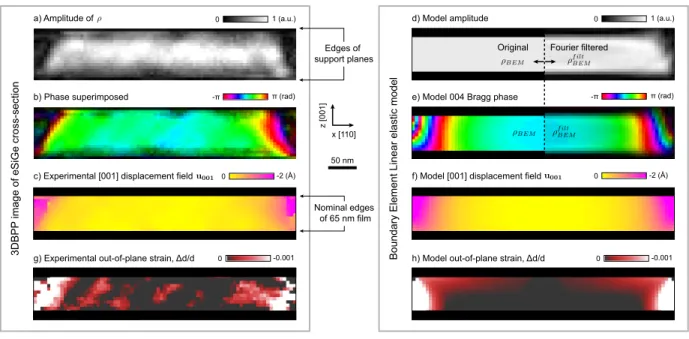
ratio and better knowledge of probe positions, we expect further gains (see Supplemental). The structural fidelity of the method was evaluated by comparing a cross-section of the recon-struction with a linear elastic boundary element method (BEM) model of the eSiGe stressor under the nominal mechanical boundary conditions of the device [44]. Figure 5 (a-c) shows the ampli-tude, phase, and displacement field maps from an (x, z) cross-section of the central reconstructed stressor (cut-plane A in Figure 4) alongside those of the corresponding BEM model. In Figure 5 (b,e), the phase of ⇢ is shown as a color map superimposed on the amplitude distributions shown
in (a,d). The BEM model shows that the out-of-plane component of the displacement field u001
evolves within the (x, z) plane, increasing at the top corners to a value of approximately 2.5 ˚A
relative to the center (Figure 5 (f)) and an out-of-plane strain value, ✏zz, of 0.0015 relative to the
center. This variation in u001is the result of an elastic response of the SiGe lattice due to a change
from a near-biaxially stressed state at the center of the stressor to a more uniaxially stressed state at the eSiGe / SOI interface. This BEM model was used to generate model diffraction patterns at a series of positions in the stressor corresponding to experimental observations (Figure 3(d,e)). This comparison is an alternative means by which to verify the sensitivity of Bragg coherent diffraction to both morphology and strain in a crystal. In addition, the uncertainty in the reconstructed dis-placement field under these experimental conditions can be estimated by considering the standard
deviation of displacement within a 115 ⇥ 17 ⇥ 24 nm3 volume consisting of 240 voxels in the
center of the reconstruction where the displacement field varies slowly. In this region we find an
uncertainty (one standard deviation) of u001 = 0.02 ˚A, and an uncertainty in out-of-plane strain
( d/d) of d/d = 0.0002.
To evaluate the impact of noise in our reconstruction, the model u001 displacement was
con-verted to a complex crystal density ⇢BEM calculated for the 004 Bragg diffraction condition, and a
Fourier filter consistent with our experimental signal level was applied (see Methods) to determine
phase and amplitude distributions (⇢f ilt
BEM). The calculated BEM cross-section (⇢BEM) is shown
in the left half of Figure 5(d,e), and ⇢f ilt
BEM is shown in the right half. As seen in Figure 5(d),
high-spatial-0 -2 (Å)
3DBPP
image of eSiGe cross-section
c) Experimental [001] displacement field 0 -2 (Å)
b) Phase superimposed -π π (rad)
0 1 (a.u.)
a) Amplitude of
Boundary Element Linear
elastic model
f) Model [001] displacement field d) Model amplitude
e) Model 004 Bragg phase -π π (rad)
0 1 (a.u.) Edges of support planes Nominal edges of 65 nm film Fourier filtered Original x [110] z [001] 50 nm 0 -0.001
g) Experimental out-of-plane strain, Δd/d h) Model out-of-plane strain, Δd/d 0 -0.001
FIG. 5. Comparison with linear elastic model: A cut through the eSiGe stressor reconstruction is shown as both amplitude (a) and phase (b), with the edges of the 90-nm-thick support planes indicated. The cross section shown corresponds to cut-plane A in Figure 4(c). In (c), the phases in (b) were converted to units of lattice displacement along the [001] direction (u001) confined within an envelope representing the nominal
edges of the 65-nm-thick film. For comparison, a boundary element method (BEM) linear elastic model of u001 in the stressor (f) was converted to the complex density expected for 004 Bragg diffraction, ⇢BEM.
The amplitude and phase of ⇢BEM and ⇢f iltBEM are shown in (a,b) before and after application of a
low-bandpass Fourier filter that replicates the experimental signal level. ⇢BEM and ⇢f iltBEM are shown on the left
and right halves respectively of (d,e). Panels (g,h) show the experimental and model displacement fields converted to units of out-of-plane strain ✏zz relative to center of the stressor.
frequency components not experimentally observed in our measurement were filtered out [35].
In the center of ⇢f ilt
BEM, the amplitude remains homogeneous, but the amplitude envelope falls off
near the top corners where the internal displacement field of the crystal is expected to vary more rapidly. As a result of this displacement field, the phase evolves by ⇠ 2⇡ in the top corners of the
stressor before the amplitude envelope drops off. These features in ⇢f ilt
BEM, which come about from
the predicted internal lattice behavior of the stressor as well as the limited dynamical range in the measured intensity, are all observed in the experimental 3DBPP reconstruction (Figure 5a,b).
DISCUSSION & CONCLUSION
Our experimental results demonstrate that 3D images of strained crystals can be reconstructed without angular diversity at resolutions appropriate for nanoscale imaging. However, certain fac-tors must be considered for a successful experiment. In particular, the effectiveness of localizing
sample structure along the beam propagation direction (via the Pjand R†operators) is maximized
when kf is perpendicular to ki(i.e. 2✓ = 90 ) and vanishes when kf is parallel to ki (i.e. 2✓ = 0
or 180 ). In addition, because the method involves successive backprojections, the reconstruction is susceptible to noise amplification that degrades the image at high iteration numbers in a manner analogous to computed tomography reconstructions with noisy data (see Supplemental).
Efficient three dimensional microscopy of strain fields in targeted regions of nanoscale crystals under balanced, undisturbed boundary conditions will enable powerful new studies of in-situ mate-rials behavior. By utilizing an inversion strategy that efficiently uses Bragg diffracted photons from a simpler experiment, 3DBPP is a significant step in the development of 3D x-ray microscopy, es-pecially in cases where sample rotation is prohibitive. As compared to Bragg ptychography with rocking curves, 3D images of crystals can be reconstructed using single-angle diffraction patterns measurements at a series of points. Furthermore, our approach simplifies the experimental require-ments such that 3DBPP can be implemented on a wide range of coherent synchrotron x-ray beam-lines, potentially using a variety of different focusing optics including pinholes and mirrors. In this capacity, the environmental compatibility and flexible field of view of 3DBPP is complemen-tary to 3D atomic-resolution electron tomography of extremely small volumes of material [45]. More broadly, the integration of projection and backprojection operations into a phase retrieval algorithm can potentially be applied to address challenges in transmission geometry computed tomography, including the alignment of radial projections with incoherent computed tomography and potentially enabling global 3D inversion of tomographic far-field coherent diffraction patterns.
[1] Clark, J. N., Ihli, J., Schenk, A. S., Kim, Y. -Y., Kulak, A. N., Campbell, J. M., Nisbet, G., Meldrum, F. C., Robinson, I. K., Three-dimensional imaging of dislocation propagation during crystal growth and dissolution. Nature Materials 14, 780 (2015).
[2] Ulvestad, A., Singer, A., Clark, J., Cho, H.-M., Kim, J. W., Harder, R., Maser, J., Meng, Y. S., Shpyrko, O. Topological defect dynamics in operando battery nanoparticles. Science 348, 1344 (2015). [3] Yang, W., Huang, X., Harder, R., Clark, J. N., Robinson, I. K., and Mao, H.-k. Coherent diffraction
imaging of nanoscale strain evolution in a single crystal under high pressure. Nature Communications 4, 1680 (2013).
Harder, R., and Robinson, I. K. Differential stress induced by thiol adsorption on facetted nanocrystals. Nature Materials 10, 862 (2011).
[5] Clark, J. N., Beitra, L., Xiong, G., Higginbotham, A., Fritz, D. M., Lemke, H. T., Zhu, D., Chollet, M., Williams, G. J., Messerschmidt, M., Abbey, B., Harder, R. J., Korsunsky, A. M., Wark, J. S., and Robinson, I. K. Ultrafast three-dimensional imaging of lattice dynamics in individual gold nanocrys-tals. Science 341, 56 (2013).
[6] Sayre, D. Some implications of a theorem due to Shannon. Acta Crystallographica 5, 843 (1952). [7] Miao, J., Charalambous, P., Kirz, J., and Sayre, D., Extending the methodology of x-ray
crystallogra-phy to allow imaging of micrometre-sized non-crystalline specimens. Nature, 400, 342 (1999). [8] Miao, J., Ishikawa, T., Robinson, I. K., and Murnane, M. M., Beyond crystallography: diffractive
imaging using coherent x-ray light sources. Science, 348, 530 (2015).
[9] Hoppe, W. Beugung im inhomogenen Prim¨arstrahlwellenfeld. I. Prinzip einer phasenmessung von elektronenbeungungsinterferenzen. Acta Crystallographica A, 25, 495 (1969).
[10] Rodenburg, J. M., Hurst, A. C., Cullis, A. G., Dobson, B. R., Pfeiffer, F., Bunk, O., David, C., Jefimovs, K. and Johnson, I. Hard-x-ray lensless imaging of extended objects. Physical Review Letters, 98, 034801 (2007).
[11] Rodenburg, J. M. and Faulkner, H. M. L. A phase retrieval algorithm for shifting illumination. Applied Physics Letters, 20, 4795 (2004).
[12] Thibault, P., Dierolf, M., Menzel, A., Bunk, O., David, C. and Pfeiffer, F. High resolution scanning X-ray diffraction microscopy. Science, 321 , 379 (2008).
[13] Dierolf, M., Menzel, A., Thibault, P., Schneider, P., Kewish, C. M., Wepf, R., Bunk, O. and Pfeiffer, F. Ptychographic x-ray computed tomography at the nanoscale. Nature, 467, 436 (2010).
[14] Takahashi, Y., Suzuki, A., Furutaku, S., Yamauchi, K., Kohmura, Y., and Ishikawa, T. Bragg x-ray ptychography of a silicon crystal: Visualization of the dislocation strain field and the production of a vortex beam. Physical Review B 87, 121201 (2013).
[15] Zhang, F., Peterson, I., Vila-Commamala, J., Diaz, A., Berenguer, F., Bean, R., Chen, B., Menzel, A., Robinson, I. K., and Rodenburg, J. M. Translation position determination in ptychographic coherent diffraction imaging. Optics Express 21, 13592 (2013).
[16] Thibault, P. and Menzel, A. Reconstructing state mixtures from diffraction measurements. Nature 494, 68 (2013).
three dimensions using a multi-slice approach. Journal of the Optical Society of America A, 29, 1606 (2012).
[18] Raines, K. S., Salha, S., Sandberg, R., Jiang, H., Rodriguez, J. A., Fahimian, B. P., Kepteyn, H. C., Du J., and Miao, J., Three-dimensional structure determination from a single view. Nature, 463, 214 (2010).
[19] Van Dyck, D., Jinschek, J. R., and Fu-Rong Chen ‘Big Bang’ tomography as a new route to atomic-resolution electron tomography. Nature, 486, 243 (2012).
[20] Pfeifer, M. A., Williams, G. J., Vartanyants, I. A., Harder, R., and Robinson, I. K. Three-dimensional mapping of a deformation field inside a nanocrystal. Nature 442, 63 (2006).
[21] Gerchberg R. W. and Saxton W. O. A practical algorithm for the determination of the phase from image and diffraction plane pictures. Optik (Jena) 35, 237 (1972).
[22] Godard P., Allain M., and Chamard V. Imaging of highly inhomogeneous strain field in nanocrystals using x-ray bragg ptychography: A numerical study. Physical Review B, 84, 144109 (2011).
[23] Godard, P., Carbone, G., Allain, M., Mastropietro, F., Chen, G., Capello, L., Diaz, A., Metzger, T. H., Stangl, J., and Chamard, V. Three-dimensional high-resolution quantitative microscopy of extended crystals. Nature Communications 2, 568–566 (2011).
[24] Berenguer, F., Godard, P., Allain, M., Belloir, J. M., Talneau, A., Ravy, S., and Chamard, V. X-ray lensless microscopy from undersampled diffraction intensities. Physical Review B, 88, 144101 (2013).
[25] Chamard, V., Allain, M., Godard, P., Talneau, A., Patriarche, G., and Burghammer, M., Strain in a silicon-on-insulator nanostructure revealed by 3D x-ray Bragg ptychography. Scientific Reports, 5, 9827 (2015).
[26] Hruszkewycz, S. O., Holt, M. V., Murray, C. E., Bruley, J., Holt, J., Tripathi, A., Shpyrko, O. G., Mcnulty, I., Highland, M. J., and Fuoss, P. H. Quantitative nanoscale imaging of lattice distortions in epitaxial semiconductor heterostructures using nanofocused x-ray Bragg projection ptychography. Nano Letters 12, 5148 (2012).
[27] Hruszkewycz, S. O., Highland, M. J., Holt, M. V., Kim, D., Folkman, C. M., Thompson, C., Tripathi, A., Stephenson, G. B., Hong, S., and Fuoss, P. H. Imaging local polarization in ferroelectric thin films by coherent x-ray Bragg projection ptychography. Physical Review Letters 110, 177601 (2013). [28] Hruszkewycz, S. O., Holt, M. V., Allain, M., Chamard, V., Polvino, S., Murray, C. E., and Fuoss,
(2015).
[29] Kak, A. C. and Slaney, M. Principles of Computerized Tomographic Imaging, IEEE Press (1988). [30] Natterer, F. and W¨ubbeling, F. Mathematical Methods in Image Reconstruction, SIAM, Philadelphia,
(2001).
[31] Vartanyants, I. A., and Robinson, I. K., Partial coherence effects on the imaging of small crystals using coherent x-ray diffraction. Journal of Physics – Condensed Matter, 13, 10593 (2001).
[32] Labat, S., Chamard, V., and Thomas, O. Local strain in a 3D nano-crystal revealed by 2D coherent X-ray diffraction imaging. Thin Solid Films 515 , 5557 (2007).
[33] Elser, V. Phase retrieval by iterated projections, Journal of the Optical Society of America A,20, 40 (2003).
[34] Maiden, A. M. and Rodenburg, J. M. An improved ptychographical phase retrieval algorithm for diffractive imaging. Ultramicroscopy, 109, 1256 (2009).
[35] Godard, P., Allain, M., Chamard, V., and Rodenburg, J. M. Noise models for low counting rate coherent diffraction imaging. Optics Express, 20 , 25915 (2012).
[36] Thibault, P., and Guizar-Sicairos, M., Maximum-likelihood refinement for coherent diffractive imag-ing. New Journal of Physics,14, 063004 (2012).
[37] Guizar-Sicairos, M. and Fienup, J. R. Phase retrieval with transverse translation diversity: a nonlinear optimization approach. Optics Express,10, 7264 (2008).
[38] The scaled conjugate gradient algorithm can also be used for 3DBPP imaging but was found to be more susceptible to noise [51, 52] (see Supplemental). Therefore, results shown here use the OS/PIE algorithm.
[39] Miao, J., Sayer, D., and Chapman, H. N. Phase retrieval from the magnitude of the Fourier transforms of nonperiodic objects. Journal of the Optical Society of America A, 15 , 1662 (1998).
[40] Holt, M.V., Hruszkewycz, S. O., Murray, C. E., Holt, J., Paskiewicz, D. M., Fuoss, P. H., Strain imag-ing of nanoscale semiconductor heterostructures with x-ray Bragg projection ptychography. Physical Review Letters, 112, 165502 (2014).
[41] Hruszkewycz, S. O., Zhang, Q., Holt, M. V., Highland, M. J., Evans, P. G., Fuoss, P. H., Structural sensitivity of x-ray Bragg projection ptychography to domain patterns in epitaxial thin films. Physical Review A, 94, 043803 (2016).
[42] van Heel, M., and Schatz, M. Fourier shell correlation threshold criteria. Journal of Structural Biology, 151, 250 (2005).
[43] Vila-Comamala, J., Diaz, A., Guizar-Sicairos, M., Mantion, A., Kewish, C. M., Menzel, A., Bunk, O., and David, C. Characterization of high-resolution diffractive x-ray optics by ptychographic coherent diffraction imaging. Optics Express, 19, 21333 (2011).
[44] Murray, C. E., Saenger, K. L., Kalenci, O., Polvino, S. M., Noyan, I. C., Lai, B., and Cai, Z. Submicron mapping of silicon-on-insulator strain distributions induced by stressed liner structures. Journal Of Applied Physics, 104, 013530 (2008).
[45] Xu, R., Chen, C-.C., Wu, L., Scott, M. C., Theis, W., Ophus, C., Bartels, M., Yang, Y., Ramezani-Dakhel, H., Sawaya, M. R., Heinz, H., Marks, L. D., Ercius, P., Miao, J. Three-dimensional coordi-nates of individual atoms in materials revealed by electron tomography. Nature Materials, 14, 1099 (2015).
[46] Holt, J. R., Madan, A., Harley, E. C. T., Stoker, M. W., Pinto, T., Schepis, D. J., Adam, T. N., Murray, C. E., Bedell, S. W., and Holt, M. Observation of semiconductor device channel strain using in-line high resolution X-ray diffraction. Journal Of Applied Physics, 114, 154502 (2013).
[47] The hard x-ray nanoprobe beam line is operated by the Center for Nanoscale Materials at the Advanced Photon Source.
[48] Winarski, R. P., Holt, M. V., Rose, V., Fuesz, P., Carbaugh, D., Benson, C., Shu, D., Kline, D., Stephenson, G. B., McNulty, I., and Maser, J. A hard X-ray nanoprobe beamline for nanoscale mi-croscopy. Journal of Synchrotron Radiation, 19, 1056 (2012).
[49] Hruszkewycz, S. O., Holt, M. V., Maser, J., Murray, C. E., Highland, M. J., Folkman, C. M., and Fuoss, P. H. Coherent Bragg nanodiffraction at the hard x-ray Nanoprobe beamline. Philosophical Transactions of the Royal Society A, 372, 20130118 (2014).
[50] Vine, D. J., Williams, G. J., Abbey, B., Pfeifer, M. A., Clark, J. N., De Jonge, M. D., Mcnulty, I., Peele, A. G., and Nugent, K. A. Ptychographic Fresnel coherent diffractive imaging. Physical Review A, 80, 063823 (2009).
[51] Nocedal, J. and Wright, S. J. Numerical Optimization. Springer, (2006).
[52] Bertero, M. and Boccacci, P. Introduction to inverse problems in imaging. IoP Publishing, Bristol, (1998).
METHODS
Numerical 3DBPP demonstration: A numerical sample in the shape of a rectangular cuboid (Figure 1) was generated that was 40 ⇥ 30 ⇥ 190 pixels in dimension with two cubic voids in the sample with respective edge lengths of 7 and 17 pixels. The numerical object (denoted as ⇢) was purely real and had a uniform density outside of the voids. Figure 1(a) shows a cross-section through the middle of ⇢, showing the two voids in density. The isosurfaces in Figure 1(b,c,f) all depict the density from one outside edge of the object to the central cross-sectional plane shown in (a). Though the entire numerical object is not depicted in the isosurfaces, this visualization helps emphasize and clarify the position and shape of the voids before and after 3DBPP reconstruction. The object is symmetric about the plane in (a).
The numerical probe used for this example was purely real with a gaussian amplitude profile with a full width at half max of 4 pixels. To simulate a high-angle Bragg condition similar to
the eSiGe experiment, the incident angle of the probe and the angle of the exit beam (ki and
kf) were both set to 30 with respect to the top surface of the object. In order to generate a
simulated data set, the position of the probe was scanned through the object in a 5 ⇥ 61 point grid with a two pixel step size. At each point j, coherent Bragg intensity patterns were calculated
according to hIji = |FRPj⇢|2. The resulting noise-free intensity patterns were phased using the
OS/PIE 3DBPP algorithm described in the text to generate a reconstruction. The support used in the reconstruction (yellow surfaces in Figure 1) consisted of parallel planes separated by 40 pixels, matching the dimension of the original object in the z direction. This support acted only to constrain the top and bottom surfaces of the object, as in the experimental eSiGe reconstruction. The final reconstruction in Figure 1(g) was generated after 200 iterations of the 3DBPP algorithm.
The resolution of this reconstruction along kf was found to be 2.6 pixels, demonstrating
sub-beam-size resolution of 3DBPP along the projection direction (see Supplemental).
Sample preparation: The sample was a lithographically prepared prototype device [46], con-sisting of a series of 460-nm wide trenches etched into a silicon-on-insulator (SOI) wafer. The
trenches were subsequently filled with epitaxial embedded Si0.8Ge0.2 (eSiGe) stressors that were
65 nm thick, as confirmed by transmission electron microscopy. The geometry and mechanical boundary conditions of these epitaxial device components are such that strain gradients are ex-pected to build up near the vertical interface between the eSiGe and SOI channel regions. The device SOI/eSiGE architecture shown in Figure 4(a) repeats for > 100 periods in the x direction,
and is invariant and self-similar in the y direction for tens of microns.
Data collection: The coherent diffraction measurements were done at the Hard X-ray Nanoprobe beamline [47–49]. A Fresnel zone plate was used to focus 9 keV energy x-rays with wavelength
= 0.137nm to a 46 nm diameter focal spot (FWHM intensity of the central focus peak). Prior to
collecting nanodiffraction patterns from the eSiGe stressors, the complex wavefront of the beam was determined in the focal plane with transmission-geometry Fresnel ptychography using a test object [50], (Figure 3(b-c)). Using wavefront propagation, the wave field of the beam about the fo-cus was calculated in order to determine the 3D probe function in the Bragg geometry. The depth of focus of this zone plate optic was ⇠ 30 µm, and the focal plane was determined experimentally within ± 5 µm. Thus, during 3DBPP phase retrieval, we assume that the eSiGe crystal lies in the focus of the lens and that the uncertainty of the focal plane can be neglected due to the long depth of focus. Similarly, we assume that changing the position of the beam along the y direction by < 2 µm does not significantly modify the probe profile at the sample.
For 3DBPP imaging, coherent nanodiffraction patterns were measured with an area detector at the 004 eSiGe Bragg condition with 10 second exposures. In this symmetric diffraction geometry
the incident and exit wave vectors, ki and kf, were separated by 59.5 . The beam was scanned
normal to ki in a series of spiral-like patterns with an effective step size of ⇠13 nm separating
adjacent points, defining an effective field of view of ⇠ 900 ⇥ 200 nm on the surface of the device. In total, 707 coherent Bragg diffraction patterns were phased, covering a sample area shown in Figure 3(a). Examples of coherent Bragg diffraction patterns from this data set measured at different positions of a single stressor are shown in Figure 3(d-f). Further details can be found in Ref [40], especially with regard to our implementation of the spiral patterns employed in order to mitigate beam damage.
Inversion procedure: In this work, we adapted the OS/PIE (Ordered-Subset / Ptychographic Iterative Engine) algorithm that was originally described in Ref [11] and further investigated in Ref [35]. Our 3DBPP phase-retrieval iteration is a variation of this algorithm that can be implemented by modifying the relationship between the probe, the object, and the sample exit wavefield. Thus, equations 2 and 6 in Ref [11] change from:
j = Pj⇢, and, ˆj =F 1 ✓p Ij j | j| ◆ , (6)
to, respectively: j =RPj⇢, and, ˆj =R†F 1 ✓p Ij j | j| ◆ . (7)
(Note that variables in the above equations were slightly changed from those in Rodenburg and Faulkner such that they correspond to the nomenclature of the current manuscript.) As described in
the manuscript, R and R†are projection and backprojection operators. These operators transform
dimensions from 3D to 2D and vice-versa, and they allow a phase retrieval approach originally designed for 2D imaging (such as the PIE) to be adapted for 3D imaging. In addition, a (real-space) support constraint consisting of two parallel planes separated by 90 nm was applied to each new update of ⇢ such that amplitude outside the volume between the planes was set to zero. A pseudo-code of the OS/PIE 3DBPP phasing algorithm is given in the Supplemental. The reconstruction from experimental data was obtained with a total of 300 iterations performed by this OS/PIE
3DBPP phasing algorithm, the iteration being started with a 3D estimate ⇢(0)consisting of random
real values. The beam wavefront reconstructed from test pattern data (Figure 3(b)) was used to
generate a 3D incident focused-beam probe P that is invariant apart from spatial shifts (Pj(r) =
P (r rj)with rj the j-th probe position). We note also that this probe estimate P was not further
refined during the OS/PIE 3DBPP phase retrieval. The constant step-size parameter was set to 0.8 during all the OS/PIE iterations [34], but an additional multiplicative scalar factor of the form
1/ max(|P |2)was used to aid in the convergence of the inversion [35].
Estimation of the spatial resolution. In order to estimate the spatial resolution of our experi-mental 3DBPP reconstruction, we follow a Fourier shell correlation (FSC) approach similar to that outlined by van Heel and Schatz for cryo-TEM tomography [42] and that has recently been uti-lized for small-angle ptychography [43]. In this approach, the spectra of two independent images of the same object are compared. The correlation of the spectra from the two images as a function of spatial frequency provides a means of estimating image resolution. One variant of FSC used in cryo-TEM requires that the data set be “split” into independent data sets. Both half-data sets are independently reconstructed and compared. Here, we split our data set into even and odd-indexed spiral positions. As shown in Supplemental Figure S6, two half-data sets were created consisting of alternating beam position indices along the spirals.
In 3DBPP reconstructions, spatial resolution varies directionally. To accommodate this, we modify the FSC approach to be sensitive to azimuthal direction. This is done by performing FSC on spatial frequencies filtered by a cylindrical mask that passes through the origin in Fourier space.
Changing the orientation of the cylindrical mask enables the spatial resolution along different azimuthal directions to be estimated. (Details of this analysis are given in the Supplemental.)
The results of our direction-sensitive FSC analysis are shown in Sup. Figure S9, applying a
1/2-bit resolution criterion as in [42, 43]. The resolution was estimated along the (rx, rz), (ry, rz),
and (rx, ry) planes through the SiGe reconstruction. The spatial resolution of the reconstruction
was found to depend on direction, and is highest along the surface normal of the film. From this
analysis, we estimate that along the rx, ry, rz directions, the spatial resolution is 12, 29, and 35 nm
respectively.
Fourier filtered BEM model: At an exposure time of 10 seconds, the experimental Bragg coherent diffraction signal from the eSiGe stressors fell below the noise level of the detector at a signal level of ⇠0.25% of the maximum observed intensity, below which diffracted signal was not detected. This effectively removed high-frequency components of the diffracted Bragg peak mea-surement at each position. Because of the finite measured signal, our experimental reconstruction can be thought of as a low-bandpass filtered version of the reconstruction that would have been obtained with noise-free high-dynamic-range data.
In order to compare the results of the linear elastic model with our experimental reconstruction,
a comparable low-bandpass filter was utilized. The BEM model, when converted to ⇢BEM for
the 004 Bragg condition (Figure 4(d,e)), contains high spatial frequency features (sharp edges, rapidly varying phase ramps) that would not all be detected at the signal level corresponding to
our experiment. To represent ⇢BEM in a manner that was consistent with the finite experimental
signal, frequency components of the Fourier transform of ⇢BEM that fell below 0.25% of the
maximum intensity of the FT were zeroed. The inverse Fourier transform of this quantity yielded ⇢f iltBEM, which is an estimate of a 3DBPP reconstruction of the BEM model that is consistent with the signal-to-noise ratio of our experiment. In thresholding to zero at high spatial frequencies, Poisson noise effects were neglected. However, thresholding served as a first-order approximation of the low-bandpass filtering effect of low signal at high q.
Data availability The experimental data that supports the plots within this paper and other findings of this study are hosted at Argonne National Laboratory and can be accessed by contacting the corresponding author.
Code availability Matlab routines for implementing 3DBPP image reconstruction from an example numerical data set are available for download by visiting: http://XXX
ACKNOWLEDGEMENTS
3DBPP simulations and experimental measurements were supported by the U.S. Department of Energy, Office of Science, Basic Energy Sciences, Materials Science and Engineering Division. Design of the 3DBPP phase retrieval algorithm was partially funded by the French ANR under project number ANR-11-BS10-0005 and the French OPTITEC cluster. Use of the Center for Nanoscale Materials and the Advanced Photon Source was supported by the U. S. Department of Energy, Office of Science, Office of Basic Energy Sciences, under Contract No. DE-AC02-06CH11357. Sample manufacturing was performed by the Research Alliance Teams at various IBM Research and Development facilities. The authors also acknowledge Anastasios Pateras for fruitful discussion and Ana Diaz for comments on the manuscript.
AUTHOR CONTRIBUTIONS
The 3DBPP method was established by SH, MA and VC following the original idea of SH. Samples were prepared by CM and JH. Experimental measurements were performed by SH, MH, CM, and PF. All authors contributed to the writing of the manuscript.
ADDITIONAL INFORMATION