Society
OPEN ACCESS
Editors’ Choice—The Effect of Anchor Group and Alkyl Backbone Chain
on Performance of Organic Compounds as Corrosion Inhibitors for
Aluminum Investigated Using an Integrative Experimental-Modeling
Approach
To cite this article: I. Milošev et al 2020 J. Electrochem. Soc. 167 061509
View the article online for updates and enhancements.
Editors
’ Choice—The Effect of Anchor Group and Alkyl Backbone
Chain on Performance of Organic Compounds as Corrosion
Inhibitors for Aluminum Investigated Using an Integrative
Experimental-Modeling Approach
I. Milo
šev,
1,*
,zD. Zimerl,
1Ch. Carriére,
2S. Zanna,
2A. Seyeux,
2J. Iskra,
1,aS. Stavber,
1F. Chiter,
2M. Pober
žnik,
1D. Costa,
2A. Kokalj,
1,zand P. Marcus
2,**
,z1
Jožef Stefan Institute, Department of Physical and Organic Chemistry, SI-1000 Ljubljana, Slovenia
2PSL Research University, CNRS—Chimie ParisTech, Institut de Recherche de Chimie Paris (IRCP), Physical Chemistry of Surfaces Group, 75005 Paris, France
An alkaline etched, superhydrophilic aluminum surface was modified using functionalized alkyl compounds selected to study the effect of their properties on adsorption on the metal surface. The thirteen organic compounds differed in alkyl chain length (eight and eighteen carbon atoms) and anchor group (azide, imidazole, thiocyanate, amino, disulfide, thiol, phosphonic, carboxylic, and benzoic). The methodology of the study integrated a complete chain of steps incorporating synthesis, electrochemical and surface analyses, and computational modeling. The corrosion resistant and superhydrophobic properties depend on the anchor group, which governs adhesion to the surface, and backbone, which is responsible for lateral cohesive interactions. The morphology and chemical composition of modified layers were studied using scanning electron microscopy, X-ray photoelectron spectroscopy and time-of-flight secondary ion mass spectrometry. Electrochemical and long-term immersion properties were investigated in 0.5 M NaCl. Calculations based on density functional theory were performed as to model the adsorption of selected anchor groups on the hydroxylated oxidized aluminum surface. Integrated results allowed the identification of the anchor groups that are able to form inhibitive adsorbed layers on Al surface regardless the alkyl chain length, and those that are not able to form adsorbed layers at all and are thus not efficient corrosion inhibitors.
© 2020 The Author(s). Published on behalf of The Electrochemical Society by IOP Publishing Limited. This is an open access article distributed under the terms of the Creative Commons Attribution 4.0 License (CC BY,http://creativecommons.org/licenses/ by/4.0/), which permits unrestricted reuse of the work in any medium, provided the original work is properly cited. [DOI:10.1149/ 1945-7111/ab829d]
Manuscript submitted January 28, 2020; revised manuscript received March 19, 2020. Published April 14, 2020. Supplementary material for this article is availableonline
This is the second part of a three-part series of articles about the organic molecules as corrosion inhibitors for aluminum prepared in such a way as to enable the study of the effect of anchor group (adsorbed on the metal surface) and backbone (responsible for lateral interactions between the adsorbed organic molecules). The metho-dology is the same in each article of the series and integrates a complete chain of steps, from planning, synthesis, electrochemical and surface analyses to modeling. The integration of versatile methodological approaches enabled us to target the decisive proper-ties of organic molecules that are responsible for adsorption and formation of condensed layers, which show barrier corrosion resistance and superhydrophobicity. The alkaline etched, super-hydrophilic aluminum surface was taken as a starting point for further modification of the surface by immersion in an ethanol solution of selected organic compounds. The ground aluminum surface does not allow the study of adsorption of organic molecules due to the naturally formed oxidized layer, which does not have a large tendency for adsorption of organic molecules.1In thefirst part of the study we investigated the effect of chain length for a single carboxylic anchor group.1 Seven carboxylic acids (CAs) ranging from hexanoic to octadecanoic were investigated.1 At constant immersion time (30 min) and CA concentration (5 mM), short CAs (CA-6 and CA-7) act as corrosion activators, longer CAs (CA-8, CA-9 and CA-10) act as weak corrosion inhibitors, but only long chain acids (CA-14 and, especially, CA-18) are efficient corrosion inhibitors that also provide barrier protection of Al and show superhydrophobic properties. X-ray photoelectron spectroscopy (XPS) and time-of-flight secondary ion mass spectrometry (ToF-SIMS) analyses corroborated that short and long carboxylic acid
(CA-8 and CA-18) form an adsorbed organic layer. Experimental data obtained on the formation of a carboxylate layer on Al surface were the basis for density functional theory (DFT) modeling. It is proposed that the adsorption proceeds via the condensation me-chanism. The magnitude of adsorption energy increases with length of alkyl chains and additionally leads to increased cohesive lateral forces resulting in a more stable molecularfilm on the surface. Only molecules with a long alkyl chain, like octadecanoic acid, comple-tely cover the surface due to molecular tilting.1In the current study, which is the second part of this series, we proceeded to study the effect of various anchor groups and alkyl chain length aiming to bring new insight into the mechanism of formation of protective inhibitor layers on the Al surface and to contribute to a better understanding of surface-organic molecule interactions. This would consequently enable better utilization of predictive capacity of inhibitor performance.
The need for development of environmentally safe and efficient corrosion inhibitors, which would be applicable on different metals, is constantly growing due to legislation which restricts the use of chemical compounds that are proven to have, or may potentially have, a negative impact on the environment and human health. There are several possible routes we can follow to meet these needs: (i) introduce new chemical compounds which are equally or even more efficient than currently used inhibitors,2 and (ii) use a combination of existing inhibitors whose synergistic action would increase their individual efficiency.3When introducing new inhibi-tors screening, synthesis, up-scaling and rigorous testing is required which must be in accordance with the REACH directive.4Screening itself is demanding and requires a large number of trial-and-error experiments. Automated, high-throughput methods of screening accelerate the discovery of new inhibitors and generate large data sets suitable as a basis for further analysis and development of predictive models using machine learning modeling or statistical methods, the so called quantitative structure-activity relationships (QSAR) or quantitative structure-property relationship (QSPR).2 Descriptors that are usually utilized are structural and physicochemical
zE-mail: ingrid.milosev@ijs.si;tone.kokalj@ijs.si;
philippe.marcus@chimie-paris-tech.fr
*Electrochemical Society Member. **Electrochemical Society Fellow.
aPresent address: University of Ljubljana, Faculty of Chemistry and Chemical Technology, Večna pot 113, SI-1000 ljubljana, Slovenia.
properties as well as molecular electronic parameters such as chemical hardness, electronegativity, energy of the highest occupied (HOMO) and lowest unoccupied (LUMO) molecular orbitals, and the HOMO–LUMO energy gap (ELUMO – EHOMO). Such electronic
parameters can be routinely calculated with DFT (density-functional-theory) calculations. Furthermore, DFT modeling can also bring information about the molecule−surface interactions as well as the equilibrium adsorption and electronic structures. DFT can also describe bond-breaking and bond-making.5Dynamic effects can be addressed with the aid of molecular dynamics (MD) simulations (force-field or DFT-based), which simulate atomic motion at finite temperatures.6–8 However, it is usually very difficult, or almost impossible, to postulate the correlations for large number of different types of inhibitors.9Recently a robust, predictive, quantitative compu-tational model was built which can generate useful predictions.10The study pointed out the need for further examination of metal surface-organic inhibitor interactions which would enable more pertinent descriptors at the DFT level and then combine computational modeling with high-throughput experiments.
The organic inhibitors used for aluminum in chloride solutions are numerous, the most commonly used molecules being various azole, mercapto, quinoline and carboxylic derivatives.11,12 A clear correlation between descriptors and inhibition efficiency is difficult to establish for a large number of different compounds. In the present study we utilized the approach where the inhibitor structure is divided into an anchor group and a backbone. This division allows us to study the effect of the anchor group and the effect of backbone separately. Nine anchor groups were selected either based on our previous studies on different metals5,9,13–15 or based on literature studies.11,16–19 It was shown recently that the lateral interactions between the alkyl tails of corrosion inhibitor molecules are important for the formation of adsorbed self-assembled layers on the metal surface, and that the morphology of the adsorbed layers is strongly influenced by molecular geometry.1,6,20
It was shown in our previous study that the preparation of the substrate is important, as the ground Al surface covered by native formed oxide film is not suitable for adsorption of organic layers. Instead, the aluminum surface was made superhydrophylic by alkaline etching, resulting in the formation of aluminum hydroxide.1,21A series of chemical compounds was chosen in the present work to allow the study of the effect of anchor group on corrosion inhibition performance (Fig.1). Each chemical compound consists of an alkyl chain with eight (designated as C8) or eighteen carbon atoms (C18) and an anchor group. Nine anchor groups, bonded to the C8 alkyl chain, were investigated: azide, imidazole, thiocyanate, amino, disulfide, thiol, phosphonic, carboxylic and benzoic. Four of these (thiol, imidazole, phosphonic, and carboxylic) were also investigated for the C18 alkyl chain. Scanning electron microscopy combined with energy dispersive X-ray spectrometry (SEM/EDS) were used to analyze the morphology of surfaces. XPS and ToF-SIMS were used for chemical surface analysis following the approach used previously for analysis of conversion coatings on Al alloys.22,23In addition to experimental techniques, DFT calcula-tions were used to investigate the adsorption affinity of anchor groups, utilizing the approach from our previous studies.1,20,24,25 Based on these results it was determined whether a particular organic molecule was bonded to the surface. Protection properties of adsorbed organic layers were studied by electrochemical measure-ments in NaCl solution. Protection ability was correlated to surface analysis results, i.e. adsorbed molecules enabled a certain degree of inhibition, whilst those which were not adsorbed failed as inhibitors. In addition to electrochemical analysis, the bare etched Al sample and Al samples modified by organic layers were immersed in NaCl solution up to six months and then analyzed.
Experimental
Substrate material.—Aluminum (>99.0%) 1 mm thick flat sheet, distributed by GoodFellow, England, was used as substrate. Samples
were cut out in a form of 1 mm thickflat discs with a diameter of 15 mm.
Organic compounds.—Organic compounds used for the forma-tion of adsorbed layers on aluminum were either purchased from commercial suppliers or synthesized in-house.
The following chemicals were purchased: octanoic acid (Alfa Aesar, 98%), nonanoic acid (95%, Fluorochem), 1-octanethiol, (99%, Fluorochem), octylamine (99%, Sigma Aldrich), octylpho-sphonic acid (98%, Ark Pharm), 4-octylbenzoic acid (98%, Ark Pharm), octadecanoic acid (97%, ACROS organic), 1-octadeca-nethiol (95%, Fluorochem) and octadecylphosphonic acid (95%, Fluorochem). Octylphosphonic acid, 4-octylbenzoic acid, octadecyl-phosphonic acid, octadecanoic acid and 1-octadecanethiol are in solid form. All other purchased compounds (octanoic acid, nonanoic acid, 1-octanethiol, and octylamine) are in liquid form.
The following chemicals were used for the in-house synthesis: H2O2(30%, Carlo Erba), ethanol (anhydrous, Carlo Erba),
acetoni-trile (99.9%, Sigma Aldrich), tetrahydrofuran (99.9%, Sigma Aldrich), dimethyl formamide (99.7%, Merck), imidazole (99.5%, Sigma Aldrich), 1-iodooctane (98%+, Alfa Aesar), 1-iodooctade-cane (98%, Fluorochem), KI (99.5%, Merck), diethyl ether (99.8%, Sigma Aldrich), anhydrous Na2SO4 (99.5%, Fisher Chemicals),
NaN3 (99%, Riedel-de Haën), KSCN (99%, Sigma Aldrich),
NaOH (p.a., Labochem International), dichloromethane (99.5%, J.T. Baker), Na2S2O3(99.5%, Merck).
Synthesis and characterization.—Octyl azide (C8-N3) was
synthesized from NaN3 (2.76 g, 42 mmol) and 1-iodooctane
(1.71 g, 7 mmol) stirred at 60 °C in dimethylformamide (35 ml).26 The reaction mixture was followed by thin liquid chromatography (TLC); silica gel on TLC foils was used withfluorescence indicator 254 nm and pore size 60 Å. After 20 h, the substrate peak disappeared and water was added to the reaction mixture and extracted with diethyl ether (3× 50 ml). The combined organic phase was washed with water (3× 50 ml) to remove remaining dimethylformamide, dried over anhydrous Na2SO4and evaporated
under reduced pressure to give octyl azide (1.02 g, 6.6 mmol, 94% yield) as a colorless oil.
N-octylimidazole (C8-ImiH) was synthesized according to the following modified procedure27: to a solution of imidazole (0.816 g, 12 mmol) in 10 ml acetonitrile (MeCN), NaOH (2 g, 50 mmol) was added, and stirred for 30 min. After that time, 1-iodooctane (1.48 g, 6 mmol) in 10 ml acetonitrile was added and the reaction mixture was heated to 80 °C. The progress of the reaction was followed by TLC. After 12 h the substrate peak disappeared and the solvent evaporated, the crude reaction mixture was dissolved in dichlor-omethane and washed with water (3× 50 ml), dried over anhydrous Na2SO4 and evaporated under reduced pressure. The evaporated
extract was purified by column chromatography (ethyl acetate: ethanol 7:3) and the combined fractions were evaporated under reduced pressure to give N-octylimidazole (0.811 g, 4.5 mmol, 75% yield) as a yellow oily liquid.
Octyl thiocyanate (C8-SCN) was synthesized from 1-iodooctane (1.71 g, 7 mmol) and KSCN (2.06 g, 21 mmol) refluxed in tetrahydrofuran (20 ml).28,29 The reaction was followed by TLC. After 20 h, peak for substrate disappeared and water was added to the reaction mixture and extracted with dichloromethane (3 × 15 ml). The combined organic phase was dried over anhydrous Na2SO4 and evaporated under reduced pressure to give octyl
thiocyanate (1.17 g, 6.85 mmol, 98% yield) as a yellow oil. For the synthesis of dioctyl disulphide (C8-SS-C8), KI (0.013 g, 0.08 mmol) and 30% hydrogen peroxide (0.907 ml, 8.8 mmol) were added to a solution of octane thiol (1.39 ml, 8 mmol) in ethanol (10 ml).30,31 The progress of the reaction was followed by TLC. After 2 h, the substrate peak disappeared and sat. aq. Na2S2O3(15
ml) was added to use the remaining hydrogen peroxide. The reaction mixture was extracted with dichloromethane (3 × 20 ml). The combined organic phase was washed with water (1 × 25 ml) and
dried over anhydrous Na2SO4 solvent evaporated under reduced
pressure to give dioctyl disulphide (1.14 g, 3.9 mmol, 98% yield) as a yellow oil.
For the synthesis of N-octadecylimidazole (C18–ImiH), NaOH (2 g, 25 mmol) was added to a solution of imidazole (0.408 g, 6 mmol) in 10 ml acetonitrile, and stirred for 30 min.27,32After that time, 1-iodooctadecane (1.16 g, 3 mmol) in 15 ml acetonitrile was added and the reaction mixture was heated to 80 °C. The progress of the reaction mixture was followed by TLC. After 12 h, the substrate peak disappeared and the solvent was evaporated, the crude reaction mixture was dissolved in dichloromethane and washed with water (3 × 50 ml), dried over anhydrous Na2SO4 and evaporated under
reduced pressure. The evaporated extract was purified by column chromatography (ethyl acetate: ethanol 7:3), the combined fractions were evaporated under reduced pressure to give N-octadecylimida-zole (0.682 g, 2.1 mmol, 71% yield) as yellow waxy crystals.
Liquid-state 1H and 13C nuclear magnetic resonance (NMR) spectra were recorded to evaluate the conversion of substrate tofinal product and purity of synthesized compounds after selected puri fica-tion method. NMR spectra were recorded on Bruker Avance III 500 instrument at 25 °C. Chemical shifts (δ) are shown in ppm using CDCl3as internal standard for
1
H (δH 7.27 ppm) and for13C (δC 77.00) spectra. Samples were dissolved in CDCl3, tetramethyl silane
(TMS) was added for internal reference. Conversion of substrate to final product was calculated as quotient between the integrals of selected peaks for substrate andfinished product. For peak integra-tion, MestReNova 11.0.0 was used. Thefinal yield of synthesis was calculated as a ratio between practical yield and theoretical yield (based on stoichiometry of reaction) expressed as percentage.
Substrate pre-treatment and preparation of adsorbed organic layers.—Aluminum samples were first ground under water using SiC papers up to 2400-grit (LaboPol, Struers) and etched in alkaline NaOH solution (p.a., Labochem International).1,21 Briefly, 20 ml 0.1 M NaOH was heated in aflat-bottomed flask (volume 250 ml)
using an ISOPAD®heater up to 90 °C. The aluminum samples were then immersed in NaOH solution and heated for 20 min at 90 °C. The samples were then cooled down for 45 min in the same solution to room temperature and rinsed by ethanol. This procedure was used in our previous study.1
Organic layers were prepared by immersion of etched Al samples in ethanol solution (absolute for analysis EMSURE®) of organic chemicals at room temperature. The concentration of organic compounds was 5 mM and time of immersion was 30 min. The samples were hung in a glass vessel containing ethanol solution using a Teflon thread. After 30 min immersion, the sample was taken out, rinsed by distilled water, dried in a stream of N2and used for
further measurements.
Samples prepared by etching in NaOH and coated by immersion in ethanol solution of organic chemical are referred to as“Cx-R,” where Cx denotes an n-alkyl chain consisting of x carbon atoms and R is the abbreviation of the anchor group (Fig. 1): carboxylic (COOH), azide (N3), imidazole (ImiH), disulphide (SS), thiol (SH),
amino (NH2), thiocyanate (SCN), phosphonic (PO(OH)2) and
benzoic (Bn-COOH).
Characterization methods.— Electrochemical measurements.— To record potentiodynamic polarization curves, a three-electrode cell (K0235 Flat Cell Kit, volume 250 ml Ametek, Berwyn, PA, USA) was used. Electrochemical measurements were performed in 0.5 M NaCl, pH= 5.8 (Honeywell Fluka, 99.5%) at room temperature.
A specimen (“Al” or “Cx-R”) embedded in a Teflon holder leaving an area of 1.0 cm2 exposed to the solution served as the working electrode. A silver/silver chloride (Ag/AgCl, 0.205 V vs standard hydrogen electrode) was used as the reference electrode and a platinum mesh as the counter electrode. Potentials in the text refer to the Ag/ AgCl scale. Measurements were conducted using an Autolab potentio-stat/galvanostat Model 204 (Utrecht, The Netherlands). Prior to measurements, the sample was allowed to rest under open circuit conditions for approximately 1 h, to reach a stable, quasi-steady state
Figure 1. Skeletal and chemical formulae of octyl and octadecyl organic compounds with different anchor groups used as potential corrosion inhibitors for etched aluminum. Compounds were either synthesized in our laboratory (denoted orange) or purchased (denoted green). Synthetic routes are described in Experimental and presented in Fig.2. Anchor groups are color labeled: green for carbon containing compounds (carboxylic COOH and benzoic Bn-COOH), blue for nitrogen containing (azide N3, amino NH2, and imidazole ImiH), red for sulfur containing (thiol SH, disulfide SS, and thiocyanate SCN), and violet for phosphorus containing (phosphonic PO(OH)2).
open circuit potential (Eoc) at the end of the stabilization period.
Following stabilization, the potentiodynamic polarization curves were recorded using a 1 mV s−1potential scan rate, starting 250 mV more negative with respect to Eoc, and then increased in the anodic direction.
For each sample, measurements were performed at least in triplicate. Mean values with standard deviations are given in tables and representative measurement was chosen to be presented in graphs. The corrosion potential (Ecorr) and the corrosion current density (jcorr)
were obtained from an intercept between cathodic and anodic curves, or by extrapolation of linear portion of the cathodic Tafel curve and the intersect with line passing through Ecorr.
Immersion test.—Immersion tests were carried out in 250 ml glass vials at room temperature (25 ± 2 °C). Samples were hung in the vial using a teflon thread. The test lasted either one or six months. After the denoted immersion time, the sample was taken out, rinsed by distilled water, dried in a stream of N2and used for
further measurements.
Water drop contact angle.—Contact angles (θ) were determined using a tensiometer Krüss DSA 20 (Krüss GmbH, Hamburg, Germany). Theθ values were measured based on the image of the deionized water drop with a volume of 8–10 μl on the sample surface, using drop-shape-analysis software which enables thefitting of the water drop shape and a precise determination of the contact angle. Each value is the average of at least three measurements made at different locations on the same sample. Mean values with standard deviations are given. In general, θ ⩽ 10° are regarded as super-hydrophilic, 10°〈θ〉 90° hydrophilic, 90° 〈θ〉 150° hydrophobic and θ ⩾ 150° superhydrophobic.33
Surface morphology and composition.—The morphology and composition of modified samples were characterized using the (i) field-emission SEM (FE-SEM), JSM 7600F, JEOL, Japan, equipped with EDS (Inca Oxford 350 EDS SDD); images were recorded at an energy of 5 kV in LEI (low secondary electron image) mode and (ii) FE-SEM Helios Nanolab 650 microscope; images were recorded at an energy of 2 kV in secondary electron mode (SE). Prior to analysis, the samples were sputter-coated with a thin Au layer.
Time-of-flight secondary ion mass spectrometry measurements were performed using a dual beam ToF-SIMS V spectrometer (ION-TOF GmbH, Muenster, Germany). The base pressure in the analysis chamber is maintained at less than 5.0 · 10−9 mbar in normal operating conditions. The total primary ion flux was less than 1012ions cm−2ensuring static conditions. A Bi+primary ion source with a 1.2 pA current, scanned over a 100× 100 μm2area was used as the analysis beam. 2D spectra of negatively charged ions were recorded. Each sample was analyzed at least twice on different areas of the sample. Data acquisition and processing were performed using the IonSpec software. The exact mass values of at leastfive known species were used for calibration of the data.
X-ray Photoelectron Spectroscopy analysis was performed using Thermo Electron Escalab 250 spectrometer. A monochromated Al Kα X-ray source (hν 1486.6 eV) was used. The base pressure in the analytical chamber was maintained at 10−9mbar. The spectrometer was calibrated using Au 4f7/2at 84.1 eV. The take-off angle was 90°
and the analyzed area was a 500μm diameter disk. Survey spectra were recorded with a pass energy of 100 eV at a step size of 1 eV and high resolution spectra of the C 1s, P 2p, N 1s and S 2p core level regions were recorded with a pass energy of 20 eV at a step size of 0.1 eV. The values of the photoionization cross-sections (sX)
at 1486.6 eV were taken from Scofield,34and the inelastic mean free paths (lYX) were calculated by the TPP2M formula.
35
Computational details.—Calculations were performed with the PWscf code from the Quantum ESPRESSO distribution,36,37using the generalized gradient approximation (GGA) of Perdew–Burke– Ernzerhof (PBE).38 We used the pseudopotential method with
ultrasoft pseudopotentials.39,40 To better describe lateral intermole-cular interactions within the adsorbed layer, the D2 dispersion correction of Grimme was used.41Since Al ions in the oxide film are practically devoid of electrons (they are in a+3 oxidation state), the C6parameter of Al was set to zero. This reparametrization will be
denoted as PBE-D0, where the subscript“0” is used as mnemonic to
recall that C6of Al is zero. Kohn–Sham orbitals were expanded in a
plane-wave basis set up to a kinetic energy cutoff of 35 Ry (280 Ry for the charge density). Brillouin zone integrations were performed with the special point technique using a Methfessel–Paxton smearing of 0.03 Ry.42 Molecular graphics were produced by the XCRYSDEN graphical package.43
Two models of the hydroxylated oxidized aluminum surface are taken from our previous publications and are described in greater detail therein.1,20,25,44The majority of calculations were performed with thefirst model, designated as OH/AlxO/Al(111), which is based
on oxidizing the Al(111) surface with the equivalent of 2 monolayer (ML) of oxygen atoms as proposed by Lanthony et al.45The topmost layer of the film is then fully hydroxylated; the corresponding density of surface hydroxyls is 7.1 OH nm−2. The model employed in this study is built from a 6 layer slab of Al(111). Calculations were performed in a (4× 4) supercell of Al(111) and a 3 × 3 × 1 k-point grid with the previously obtained bulk lattice parameter of 4.04 Å. For the second model the (010) surface of gibbsite Al(OH)3
was taken. The utilized Al(OH)3(010) surface model consists of two
discrete Al(OH)3multilayers interlinked with H bonds.
44
It has the surface hydroxyl density of 13.4 OH nm−2. Adsorption was modeled with a (2× 1) supercell of Al(OH)3(010) using a shifted 2× 2 ×
1 k-mesh.
The reaction energy (ΔE), was calculated as:
å
å
D =E E -E = E - E , 1 i i j j products reactants products reactants [ ]where the energies were calculated at 0 K, without the zero point energy correction. The Gibbs free energies (G) were calculated at a finite temperature of 298 K (with zero-point energy (ZPE) included) following the approach described in our previous publication.25To make the vibrational calculations of surface models feasible with our computational resources, the calculations were performed with a single k-point. Furthermore, the OH/AlxO/Al(111) model was
simplified by reducing the thickness of the Al support to two Al (111) layers. According to our convergence tests these simpli fica-tions are acceptable.44 All degrees of freedom were relaxed and vibrational frequencies were evaluated at theΓ q-point, by using the PHonon code46from the Quantum ESPRESSO distribution.36,37To correct for the breakdown of the harmonic oscillator model at low-frequencies, the quasi harmonic approximation of Cramer–Truhlar47 was applied such that the frequencies below 100 cm−1were raised to 100 cm−1. In the case of standalone molecules, the contributions arising from translation and rotation were taken into account by means of the ideal-gas approximation and the rigid rotor model, respectively. The free energy was therefore calculated as:
= + +
-G T p( , ) E0 Etrv( )T pV TStrv(T p, ), [ ]2
where E0is the Kohn–Sham total energy at 0 K, without the
zero-point correction, whereas Etrv(T) and Strv(T, p) are the
translational-rotational-vibrational thermal energy (with ZPE included) and entropy, respectively. For surfaces and adsorbates only the vibra-tional contributions were taken into account whereas the pV term was neglected, i.e.:
» +
-G T( ) E0full Evibred( )T TSvibred( )T , [ ]3
where E0fullis the total energy at 0 K of the full slab model, whereas
Evibred and S
vibredare the vibrational thermal energy (with ZPE included)
and entropy calculated with the computationally-reduced slab model, respectively. The reactionΔG is then calculated analogously to Eq.1.
Results and Discussion
Synthesis of organic compounds.—The basic idea of this study was to investigate the effect of various anchor groups at a constant alkyl chain length on the affinity of adsorption on the Al surface. Nine anchor groups were selected: carboxylic (COOH), benzoic (Bn–COOH), thiocyanate (SCN), azide (N3), amino (NH2),
imida-zole (ImiH), thiol (SH), disulfide (SS) and phosphonic (PO(OH)2).
Two lengths of carbon chains were selected, octyl (C8) and octadecyl (C18). Altogether thirteen compounds were investigated. Their skeletal formulae, chemical names and abbreviations are depicted in Fig. 1. Anchor groups are color labelled: blue for nitrogen containing (N3, NH2, and ImiH), red for sulfur containing
(SH, SS, and SCN), violet for phosphorus containing (PO(OH)2) and
green for carbon containing (COOH and Bn-COOH) groups. Please note that there are two exceptions from the described labelling: (i) XPS and ToF–SIMS analyses were carried out on octanoic acid (C7-COOH) instead of nonanoic acid (C8-(C7-COOH); electrochemical data were obtained from C8-COOH, and (ii) octadecanoic acid (C17-COOH) was regarded in the C18 group (and not nonadecanoic acid (C18-COOH) as would be required following the postulated label-ling) and both surface analysis and electrochemical data refer to this compound.
For the shorter C8-chain, all nine groups were investigated: six compounds were purchased from commercial suppliers (C8-PO(OH)2, C8-SH, C7-COOH/C8-COOH, C8-NH2and
C8-Bn-COOH), and four were synthesized (C8-N3, C8-SCN, C8-SS-C8 and
C8-ImiH). The synthesis of these compounds is described in the Experimental section and schematically shown in Fig. 2. Briefly, octyl azide and octyl thiocyanate were synthesized from octyl iodide using NaN3and KSCN as reagents, respectively. Dioctyl disulfide
was synthesized from octane thiol and H2O2and N-octylimidazole
from imidazole and 1-iodooctane. All synthesized compounds are in liquid form. Their NMR spectra are presented in the Supplement material (Figs. S1–S4 is available online atstacks.iop.org/JES/167/ 061509/mmedia) and are in accordance with literature data for organic azide,26disulfide,31,48imidazole27and thiocyanate.29,49
For the longer C18-chain, four anchor groups (COOH, PO(OH)2,
SH and ImiH) were selected, based on the results obtained for the shorter C8-chain (Fig.1). Three compounds were purchased from commercial suppliers (C18-PO(OH)2, C18-SH, C17-COOH),
whereas C18-ImiH was synthesized from imidazole and 1-iodoocta-decane, following a similar procedure as for C8-ImiH. The NMR spectrum for these yellow waxy crystals is presented in Fig. S5 and is consistent with literature data.50
Morphology and composition of etched aluminum modified with alkyl compounds with various anchor groups.—The etched Al surface shows a micro- and nanoscopically rough surface covered with aluminum hydroxide as proved by EDS, XPS and ToF–SIMS.1 The surface roughness is ca. 8 μm.1 Two main morphologies of aluminum hydroxide are observed: platelet-like, nanometer-sized bottom layer and micrometer-sized oblong cones consisting of micro and sub-micrometer sized terraced, pyramidal-like structure (Fig.3a). Such a surface is superhydrophilic.
After immersion in ethanol solution of alkyl compounds of nine anchor groups, the hierarchical morphology was not disturbed and the surface remained virtually unchanged. An example is given in Fig.3b for etched Al immersed in C8-PO(OH)2. It is noteworthy that
in repetitive samples the surface morphology of alkaline etched Al was never completely the same as the growth of the cones occurs during the cooling phase in NaOH.1 This will be shown by some examples below. The presence of an organic layer could not be detected using SEM/EDS as the thickness of organic layers was in the nanometer region unsuitable for EDS analysis.
Additionally, the surface wettability of various samples was measured. The as-prepared bare etched Al surface was super-hydrophilic. After immersion in ethanol solution, the surface wettability remained superhydrophilic for most of the investigated compounds (TableI). The wettability changed to hydrophobic for C8-Bn-COOH and to superhydrophobic for C18-COOH, C8-PO(OH)2and C18-PO(OH)2. The change in wettability due to
the elongation of the alkyl chain from 8 to 18 was therefore the most
extreme for the carboxylic group, going from superhydrophilic to superhydrophobic. Regardless the chain length the surface was superhydrophobic for the phosphonic group and superhydrophilic for thiol and imidazole anchor groups.
XPS analysis was performed on Al after etching in 0.1 M NaOH and immersion for 30 min in 5 mM ethanol solution of C8-R (Fig.4). High resolution N 1s XPS spectra recorded on the Al etched surface exposed to anchor groups containing nitrogen, C8-SCN, C8-NH2, C8-N3and C8-ImiH, are shown in Fig.4a. No peak was
observed on the spectra meaning that no nitrogen was detected on the etched Al surface. Similarly, high resolution S 2p XPS spectra
recorded on the Al etched surface exposed to different anchor groups containing sulfur, C8-SCN, C8-SH, C8-SS-C8, C18-SH, are shown in Fig.4b. No peak was observed meaning that these molecules were not present on the surface to a sufficient extent taking into account the sensitivity of XPS analysis of 1 at%.51 In contrast, a peak at 134.8 eV was detected in the P 2p high resolution spectra recorded for the C8-PO(OH)2sample (Fig.5a) associated with the presence of
phosphonate groups on the Al etched surface. As for the C7-COOH sample, two peaks were observed in the high resolution C 1s core level: one peak at 285 eV associated to C–C, C–H bonds and the second one at 289.3 eV characteristic for the COOH group,
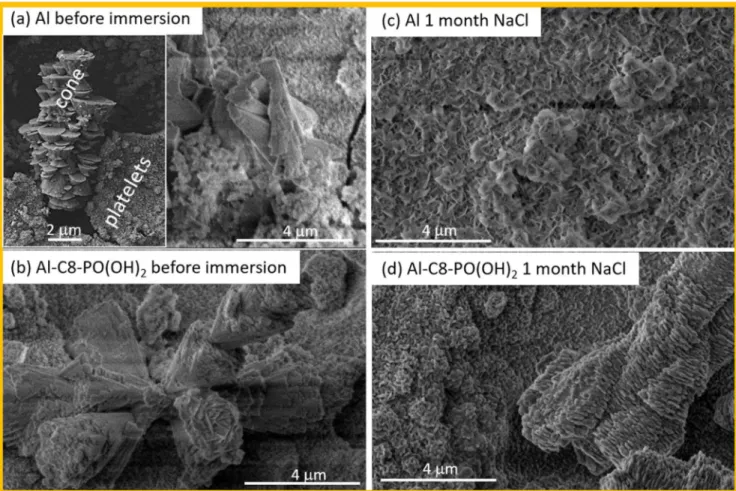
Figure 3. SEM images recorded at the surface of (a), (c) bare etched Al and (b), (d) etched Al sample modified by C8-PO(OH)2(a), (b) before and (c), (d) after immersion in 0.5 M NaCl for 1 month. After preparation, the sample was cut in half; one half was then immersed in 0.5 M NaCl; therefore, the same sample was imaged before and after immersion in NaCl. The bare Al surface was superhydrophilic before and after immersion; C8-PO(OH)2-modified surface was superhydrophobic before immersion and hydrophobic (a mean contact angle of 105°) after immersion. SE images were recorded at 5 kV and magnification 5,000×.
Table I. Wettability of the surface of bare alkaline etched aluminum (labelled as Al) and etched aluminum covered by an organic layer (labelled as Cx–R) where x is the number of carbon atoms in the alkyl chain (x = 8 or 18) and R is the anchor group as defined in Fig.1. Al was etched for 20 min in 0.1 M NaOH at 90 °C, cooled down in the same solution, and then immersed in 5 mM ethanol solution of the organic chemical.
Sample Wettability Sample Wettability
Al superhydrophilic
C8-N3 superhydrophilic
C8-SS-C8 superhydrophilic
C8-COOH superhydrophilic C17-COOH superhydrophobic
C8-Bn-COOH hydrophobic
C8-SCN superhydrophilic
C8-SH superhydrophilic C18-SH superhydrophilic
C8-NH2 superhydrophilic
C8-ImiH superhydrophilic C18-ImiH superhydrophilic
confirming the presence of the C7-COOH molecule on the Al etched surface (Fig.5b), as already reported in our previous study (in which it was also shown that the layer coverage was incomplete for this molecule).1
It is interesting to note that elongating the alkyl chain from C8 to C18 does not change the result for Cx-COOH and Cx-PO(OH)2. In
particular, XPS peaks characteristic of molecules are observed, meaning that molecules are bonded to the surface. Indeed, a peak at 134.8 eV associated with the phosphonate group is observed on the P
2p core level spectra for both Cx-PO(OH)2samples. Additionally, a
peak at 289.3 eV, associated with the COOH group, is detected on the C1s core level of Cx-COOH and C8-Bn-COOH samples (Fig.5). It can be concluded that COOH and PO(OH)2anchor groups are
bonded to the Al etched surface, whereas the other tested anchor groups, containing nitrogen or sulfur, are not present on the surface in a sufficient amount.
Long-term stability of organic layers on etched Al modified with alkyl compounds with different anchor groups was investigated
Figure 4. XPS high energy resolution spectra of (a) N 1s and (b) S 2p obtained on alkaline etched Al immersed for 30 min in 5 mM ethanol solution of C8-SCN, C8-NH2, C8-N3, C8-ImiH, C8-SH, C8-SS-C8 and C18-SH.
Figure 5. XPS high energy resolution spectra of (a) P 2p and (b) C 1s obtained on alkaline etched Al immersed for 30 min in 5 mM ethanol solution of C7-COOH, C17-C7-COOH, C8-Bn-C7-COOH, C8-PO(OH)2, C18-PO(OH)2before and after immersion in 0.5 M NaCl (denoted NaCl) for 6 months for all samples except C18-PO(OH)2which was immersed for 1 month.
through long-term (1 or 6 months) immersion in 0.5 M NaCl. Firstly, bare alkaline etched Al and Al modified with C8-PO(OH)2 were
compared before (i.e. as-prepared samples) and after immersion in 0.5 M NaCl. Alkaline etched Al exhibits a hierarchical micro- and nanostructure of Al hydroxide (Fig. 3a). This superhydrophilic structure changed after long-term immersion in NaCl with cones progressively transformed into platelets (Fig. 3c). The surface remained superhydrophilic. SEM images of the surface of C8-PO(OH)2 modified alkaline etched Al sample before and after
immersion in NaCl for 1 month are given in Figs. 3b and3d. In contrast to bare etched Al, the hierarchical pattern was preserved even after 1 month immersion. XPS P 2p spectra confirmed the presence of the phosphonic group indicating that organic molecules were still bonded on the Al surface (Fig. 5a). The surface of C8-PO(OH)2sample was initially superhydrophobic, while after 1
month immersion it became hydrophobic with a mean contact angle of 123°.
It is noteworthy that alkaline etching in NaOH always produced a hierarchical structure but not necessarily displaying the same mor-phology. Figure 6 presents an example of surface morphology of alkaline etched Al samples modified with octyl and octadecyl compounds with different anchor groups after six months immersion in 0.5 M NaCl. Upon immersion, the morphology remained hierarch-ical; for several samples the shape of surface features changed indicating the formation of a thicker layer similar to the phosphonic layer in Fig.3d. The following surfaces were superhydrophilic before and after the test: C8-N3, C8-ImiH, C8-SS-C8, C8-SCN, C8-SH and C7-COOH. The surface of C8-Bn-COOH was hydrophobic, and that of C17-COOH and C8-PO(OH)2superhydrophobic before the test and
hydrophobic after six months (mean contact angle of 113° and 106° for C17-COOH and C8-PO(OH)2, respectively). XPS analyses were
performed on immersed C8-PO(OH)2, C18-PO(OH)2, C7-COOH,
C17-COOH, C8-Bn-COOH after long term immersion in NaCl (6 months for all samples except C18-PO(OH)2which was immersed
for 1 month). Figure5presents the high resolution C 1s core level on C7-COOH, C17-COOH and C8-Bn-COOH samples and the high resolution P 2p core level recorded on C8-PO(OH)2 and
C18-PO(OH)2 samples. The peak at 134.8 eV associated with
phosphonates on C8-PO(OH)2 and C18-PO(OH)2 samples is still
present, meaning that molecules are still bonded to the surface even after the six months immersion in NaCl. For C7-COOH, C17-COOH, and C8-Bn-COOH, the peak at 289.3 eV on the C 1s core level, characteristic of the COOH group, is still present for all immersed samples. It can be concluded that C8-PO(OH)2, C18-PO(OH)2,
C7-COOH, C17-COOH and C8-Bn-COOH molecules are still bonded to the Al etched surface even after immersion in NaCl. For example, the quantity of phosphonic-based inhibitor at the surface can be estimated from the intensity ratio of P 2p and Al 2p peaks. This ratio is 0.078 before the as-prepared (prior to NaCl immersion) for C8-PO(OH)2and
0.035 after 6 months immersion in NaCl, i.e. 45% of the inhibitor is still present on the surface after immersion. For C18-PO(OH)2, the
ratio is 0.342 before and 0.215 after 1 month immersion, i.e., 63% of the inhibitor is still bonded.
These results point out that the surface morphology and topography are necessary but not decisive factors in the strength of adsorption of organic molecules. The hierarchical surface was not necessarily related to wettability, because wettability also depends on the chemical composition of the adsorbed layer. It is noteworthy that a rough etched surface is required for organic molecules to adsorb, because none of the molecules adsorbed on the ground Al surface.1This implies that proper surface preparation is essential for effective molecular adsorption. Our results further indicate that the anchor group plays a more decisive role in the formation of a stable adsorbed layer than the alkyl chain length. Molecules which were able to adsorb strongly on the Al surface were detected by XPS and acted as strong inhibitors (phosphonic group for C8 and C18 chains and carboxylic group for C17 chain). These molecules remained adsorbed for a prolonged period of time, indicating strong adsorp-tion. Others (N3, ImiH, NH2, SS, SCN, SH) were not detected by
XPS and therefore desorbed prior to measurements or were not adsorbed at all. This will be further corroborated in the electro-chemical measurements presented below.
ToF-SIMS spectra were recorded on the same Al samples with inhibitors bonded to the surface, as proved by XPS, i.e., R-COOH and R-PO(OH)2. One reference sample (prepared by following the
same procedure without any inhibitor) and the five organic com-pounds, C7-COOH, C17-COOH, C8-Bn-COOH, C8-PO(OH)2and
C18-PO(OH)2 have been tested in this study. The comparison
between the ToF-SIMS mass spectra obtained on the reference sample and on the samples exposed to organic inhibitors (Fig. 7) evidences the presence of each compound on the Al surface. In fact, specific and intense fragments, C8H15O2−(m/z= 143), C18H35O2−
(m/z= 283), C15H21O2−(m/z= 233), C8H18PO3−(m/z= 193) and
C18H38PO3− (m/z = 333), that are assigned to C7-COOH (144
g.mol−1), C17-COOH (284 g.mol−1), C8-Bn-COOH (234 g.mol−1), C8-PO(OH)2 (194 g.mol−1) and C18-PO(OH)2 (334 g.mol−1)
respectively, were observed. The detected fragments correspond to the mass of the inhibitor molecule minus one hydrogen, as commonly observed in negative polarity ToF-SIMS.52 Note that C8H15O2− and C18H35O2−, indicated with grey background in
Fig. 7, had previously been detected by ToF-SIMS and associated with the presence of C7-COOH and C17-COOH, respectively, on the Al surface.1
Focusing on C7-COOH and C17-COOH inhibitors, the mass spectra exhibit the characteristic fragments of the inhibitors them-selves (C8H15O2−(m/z= 143) and C18H35O2−(m/z= 283) (Fig.7),
respectively) but some other characteristic fragments are also identified in Fig. 8. They are C6H4O2Al− (m/z = 135) and
C6H5O2Al2− (m/z = 163) for both C7-COOH and C17-COOH.
These fragments, not observed on the reference sample, correspond to a fragment of the molecule bonded to one or two Al. A fragment bonded with a single Al can be associated with a monodentate complex on the Al surface, whereas a fragment bonded with two Al can correspond to either a μ2-bonded monodentate or a bidentate
complex. Due to substrate preparation, these inhibitors are probably bonded by the carboxylate group to the hydroxylated Al surface, through inner-sphere adsorption.53Condensation is the mechanism invoked for the monodentate bond, by recombination of hydroxyl surface group with the COOH acidic proton and release of a water molecule.54Conversely, protonation of a surface OH group and the release of a second water molecule is necessary before the carbonyl group can react with Al and form the bidentate bonding mode.54 Note that the ions correspond only to a fraction of the inhibitor molecule linked with Al. This may be due to the ToF–SIMS process itself, which reduces the probability of big ions emission. Thus, only fragments of the molecule linked with Al are observed.
Figure9displays specific fragments corresponding to the C8-Bn-COOH inhibitor linked with an Al, i.e. C7H3O2Al− (m/z= 146),
C7H4O2Al− (m/z = 147), C7H3O2Al2− (m/z = 173) and
C7H4O2Al2− (m/z= 174). They correspond to an aromatic cycle
(that may lack one H atom)+ carboxylate functional group bonded to one or two Al, respectively. This evidences the formation of carboxylate complexes when the hydroxylated surface is exposed to the C8-Bn-COOH inhibitor, with the same mechanism as explained for R-COOH.
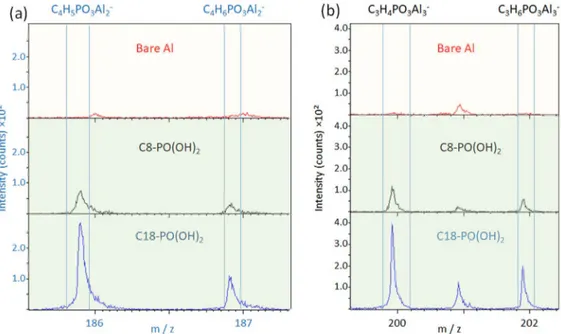
Concerning the C8-PO(OH)2 and C18-PO(OH)2 inhibitors, the
mass spectra (Fig.10) also evidence fragments, i.e. C4H5PO3Al2−
(m/z = 186), C4H6PO3Al2− (m/z = 187), C3H4PO3Al3− (m/z=
200) and C3H6PO3Al3− (m/z = 202), which correspond to a
fragment of molecule bonded to two Al or three Al. It is noteworthy that no fragment bonded to only one Al is observed. This indicates that these inhibitors are bonded to the surface via the phosphonate group. The adsorption mechanism (chemisorption) suggested in the literature consists of a covalent bond formed by a condensation reaction between the PO(OH)2 group of the inhibitor and surface
hydroxyl groups.53,55Two condensation reactions lead to two strong PO–Al bonds (bidentate complex). To form a tridentate complex, the formation of the third PO–Al bond is required.56,57 According to
Figure 6. SEM images recorded at the surface alkaline etched Al samples modified by octyl and octadecyl alkyl chain with various anchor groups after immersion in 0.5 M NaCl for 6 months. LEI images were recorded at 5 kV and 5,000× magnification. The following surfaces were superhydrophilic before and after the test: C8-N3, C8-ImiH, C8-SS-C8, C8-SCN, C8-SH, and C7-COOH. The C8-Bn-COOH surface was hydrophobic and that of C17-COOH and C8-PO(OH)2superhydrophobic before the test and hydrophobic after the test.
Figure 7. ToF-SIMS negative ion spectra obtained on (upper panel, yellow background) alkaline etched Al and (lower panel, green background) alkaline etched Al immersed for 30 min in 5 mM ethanol solution of (a) C7-COOH, (b) C17-COOH, (c) C8-Bn-COOH, (d) C8-PO(OH)2and (e) C18-PO(OH)2. Spectra with a grey background, shown in (a, b), were published previously.1
Figure 8. ToF-SIMS negative ion spectra showing C7-COOH and C17-COOH (a) monodentate and (b) bidentate carboxylate complex bonded to the alkaline etched Al surface.
Figure 9. ToF-SIMS negative ion spectra showing C8-Bn-COOH (a) monodentate and (b) bidentate carboxylate complex bonded to the alkaline etched Al surface.
Ramsier et al.,58for such a bond to form the P=O group needs to react with an unsaturated Al atom on the surface. Luschtinetz et al.59 explained that in acidic medium a protonation of an OH group of the Al surface could release a water molecule, permitting a free Al site and so the third bond resulting from the coordination of the phosphoryl oxygen to the metal can form.60
ToF–SIMS/XPS analyses revealed the presence of all the tested compounds (three carboxylic acids and two phosphonic acids) on Al substrates exposed to their solutions. As schematically depicted in Fig.11, carboxylic acids are bonded with the carboxylate group to the Al surface by one (monodentate) and two (μ2-monodentate or
bidentate) Al, while phosphonic acids are bonded by two (μ2-monodentate or bidentate) and three Al (μ1 + μ2-bidentate or
bidentate). In contrast, compounds with thiol, amine, imidazole, thiocyanate and azide functional groups are not present on the surface in sufficient amount to be detected by XPS; this implies that these compounds are not good candidates for corrosion inhibitors for Al.
Computational modeling.—In order to provide additional infor-mation on the adsorption affinity of various anchor groups on the oxidized aluminum surface, we performed the corresponding PBE–D0
calculations. To this end, we divided the structure of the inhibitor molecules into two structural components: (i) an anchor group, which governs adhesion to the surface, and (ii) a backbone, responsible for lateral cohesive interactions within the adsorbed layer. A schematic representation of this structural division is shown in Fig.12. To better disentangle anchor−surface adhesion from lateral cohesive effects of the backbone, a methyl group was used as a minimal backbone representation and calculations were performed at low molecular coverage (i.e. one molecule per (4× 4) surface supercell).
We modeled the adsorption of a subset of the selected anchor groups (listed in Fig. 13) on the OH/AlxO/Al(111) model of the
hydroxylated oxidized aluminum surface, described in the Computational details section and shown in Fig. 13. XPS and ToF–SIMS results (shown in Figs.4, 5, 7–10) indicate that some among the investigated molecules remain on the surface for an extended period of time (at least six months), which implies that these molecules are strongly chemisorbed. Hydrogen bonds between a molecule and a surface together with dative X→Al bonds (X = N, O, S) cannot provide so strong chemisorption, because, according to our calculations, the resulting magnitudes of adsorption energy are at most about 1 eV.61Thus a chemical reaction is required in order to
Figure 10. ToF-SIMS negative ion spectra showing C8-PO(OH)2and C18-PO(OH)2(a) bidentate and (b) tridentate phosphonate complex bonded to the alkaline etched Al surface.
Figure 11. According to the ToF-SIMS fragment analysis, carboxylic acids bond to either one or two Al, whereas phosphonic acids bond to either two or three Al. Several potential bonding modes corresponding to thesefindings are schematically depicted (only the more probable modes as inferred from our DFT calculations are shown). Gray crosses indicate that the particular bonding mode is not compatible with the ToF-SIMS fragment analysis.
Figure 12. Schematic representation of the structural division of the inhibitor into an anchor group and a backbone (left). The anchor group governs adhesion to the surface (indicated by red arrows), whereas the backbone is responsible for cohesive interactions within the monolayer (brown arrows). In order to better disentangle the effects of the two structural components, a standalone adsorbed molecule with a methyl (Me) group as a minimal backbone (right) was used when investigating the effect of the anchor group.
Figure 13. A scheme of the condensation reaction mechanism (top), where MolH is used as a generic label for the considered anchor groups. Below the scheme on the left-hand side the top- and side-view of the employed OH/AlxO/Al(111) model of the hydroxylated oxidized aluminum surface are shown, whereas the different considered anchor groups are depicted on the right-hand side with methyl group used as a minimal representation of the backbone.
form stronger ionocovalent X–Al bonds (X = C, N, O, or S), with bond strengths up to 5 eV. We have previously shown that on the hydroxylated oxidized aluminum surface such bonds can form via the condensation mechanism,1,20,24,25which can be described by the
reaction:
+ * *+
MolH OH Mol H O,2 [ ]4
where the label MolH stands for the intact standalone molecule in the gas phase, Mol* represents the dissociated molecule adsorbed on the surface, and OH* is a surface hydroxyl group. The condensation reaction involves the dissociative adsorption of a molecule by replacing a surface OH group and forming a water molecule as a side product. This reaction is schematically shown in Fig.13, along with the top- and side-view of the OH/AlxO/Al(111) model of the
hydroxylated oxidized aluminum surface and the considered anchor groups with a methyl group as a minimal backbone.
The results of our calculations are shown in Fig.14. Only COOH and PO(OH)2 anchor groups display exothermicΔE values, being
about−0.3 eV for C1-COOH and C1-Bn-COOH and −1.2 eV for C1-PO(OH)2, whereas all others anchor groups display significantly
endothermic reaction energies. It should be noted that although the magnitudes of ΔE values are moderate, below about 1 eV, the corresponding molecules–surface bonds are strong (from 3.8 eV for
S–Al to 5 eV for O–Al). The reason is that ΔE value does not reflect the chemisorption bond strength, because it is the cumulative effect of bond-breaking and bond-making.
To further corroborate the feasibility of the condensation adsorption reaction, we also calculated the corresponding reaction Gibbs free energies,ΔG at 298 K and 1 atm. It should be noted that allΔG values, reported in Fig.14, are less exergonic thanΔE values are exothermic. This is mainly due to the loss of roto-translational degrees of freedom upon adsorption, even though a water molecule is released during the reaction. However, the water molecule is less massive than all considered anchor groups (note that roto-transla-tional entropic contributions are roughly proporroto-transla-tional to the loga-rithm of the molecular mass).bOf the considered anchor groups, the
Figure 14. Schematic skeletal representation of the anchor–surface bonding as deduced from DFT calculations along with the corresponding snapshots of the optimized structures on the OH/AlxO/Al(111) model. The calculated reaction energies (ΔE) and reaction free energies (ΔG) are also given for the condensation reaction of the considered anchor groups on the oxidized aluminum surface.
bThe ideal-gas translational partition function is =
p
qtr 2mkT2 V ,
3 2
( )
where m is themass of the molecule, k is the Boltzmann constant, T is the temperature, and V is the volume per ideal-gas particle. For a non-linear molecule, the rotational partition
function is =s p qrot kT IAIBIC, 1 rot 8 3 3 ( )
whereσrotis the rotational symmetry number, and IA, IB, and ICare the three eigenvalues of the moment of inertia tensor, which depends on the mass distribution within the molecule. The corresponding entropies are Str= k ln(qtr+ 5/2) and Srot= k ln(qrot+ 3/2), which implies that roto-translational entropic contributions are roughly proportional to the logarithm of the molecular mass (for an example that this is indeed the case see Fig.16b of our parallel publication20).
most exergonic reaction free energy is found for C1-PO(OH)2, with
aΔG of −0.98 eV. Both anchor groups containing the carboxylic functional group, C1–COOH and C1-Bn-COOH, display an only slightly exergonicΔG of −0.19 eV and −0.11 eV, respectively, due to the mentioned unfavorable entropic effects. This indicates that additional stabilization is required for the formation of a stable carboxylate layer on the surface, which can be provided by cohesive lateral interactions between alkyl backbones within the adsorbed monolayer.1,20The remaining anchor groups all display considerably endergonic reaction free energies. The respective ΔG values for C1-SH, C1-NH2, and C1-ImiH, are 0.52, 0.55, and 1.11 eV, which
indicate that these molecules will not chemisorb via the condensa-tion mechanism on the hydroxylated oxidized aluminum surface.
Let us also remark that these results agree remarkably well with XPS and ToF–SIMS measurements presented in Figs.4, 5, 7–10, where molecules containing PO(OH)2 and COOH anchor groups
were identified on the surface, whereas the other anchor groups were not found. The modeling results are also in line with electrochemical measurements (vide infra, Figs.18–19), where inhibitors containing the PO(OH)2anchor group were found to be efficient regardless the
alkyl chain length. Additionally, the shorter-chain C8-COOH did not show inhibition characteristics, whereas the longer-chain C17-COOH was an efficient inhibitor, as already discussed in our previous publication.1
Our calculations also demonstrate that it is more appropriate to classify the benzene group of Bn-COOH as a backbone rather than an anchor group. From Fig.14it is evident that the chemisorption bonding of both standalone C1-COO* and standalone C1-Bn-COO* is similar, with condensation reaction energies of−0.3 eV. On the other hand, theΔE values for the full monolayer of C1-COO* and C1-Bn-COO* are considerably different, being −0.15 and −0.64 eV molecule−1, respectively (see Fig.15). Thus theΔE value
for the full monolayer of C1-Bn-COO* is closer to that of C8-COO*, which has a value of−0.61 eV molecule−1. The difference between theΔE values of C1-COO* and C1-Bn-COO* monolayers also provides a rationale for the observed difference in inhibition efficiency of C8-Bn-COO* and C8-COO*, which will be discussed in the following section. Namely, in the light of considering the benzene group of Bn-COOH as a backbone, the C8-Bn-COOH would correspond to Cn-COOH with n being larger than 8. This reasoning is supported by the wettability measurements which show that C8-COOH is superhydrophilic, whereas C8-Bn-COOH is hydrophobic (Table I), in accordance with the increasing number of C atoms in the backbone.1
The above computational results refer exclusively to the forma-tion of a monodentate bonding mode on the OH/AlxO/Al(111) model
via the condensation mechanism. However, the fragment analysis of the ToF–SIMS spectra indicates that inhibitors containing the COOH anchor group can bond also to two Al, which corresponds, according to Fig.11, either toμ2-monodentate or bidentate bonding
modes. While according to DFT calculations standalone μ1-monodentate is more stable than standalone μ2-monodentate, a
full monolayer consists of both types of monodentates.20As for the PO(OH)2anchor group, the ToF–SIMS analysis reveals that it bonds
with either two or three Al. The fragment with two Al corresponds, according to Fig.11, either toμ2-monodentate or bidentate, whereas
the fragment with three Al corresponds to μ1 + μ2-bidentate or
tridentate. With DFT calculations we identified μ2-monodentate, but
it is by 0.15 eV less stable than the μ1-monodentate, shown in
Fig.14. In contrast to ToF–SIMS, DFT calculations did not identify any structure, where the PO(OH)2anchor group bonds with three Al
on a fully hydroxylated surface. For this reason, we investigated bidentate bonding of COOH and PO(OH)2headgroups and tridentate
bonding of PO(OH)2on surface models that contain OH vacancies;
vacancy containing models were treated as spin-polarized. These calculations indicate that bidentate configurations are viable near OH vacancies. In particular, on the OH/AlxO/Al(111) model,
mono-dentate bonded carboxylate and phosphonate stabilize by 0.66 and 0.90 eV, respectively, if they transform to the bidentate
configuration by bonding with the O atom of the C=O or P=O group to the Al ion that lacks the hydroxyl group (see Fig.16). These results were obtained analogously to those of Fig.14, i.e., calcula-tions were performed at low molecular coverage with a methyl group used as a minimal backbone representation.
It should be noted that for the PO(OH)2headgroup the
mono-dentate to bimono-dentate transformation can proceed via two different routes. The first route is the one just considered, which can be written as:
+
* * **
R‐PO OH2( ) R‐PO OH2( ) , [ ]5
where a standalone * indicates a free adsorption site (in this case an OH vacancy), whereas the suffix * and ** designate monodentate and bidentate bonding, that is, bonding to one and two Al ions, respectively. The number of suffix asterisks also indicates the number of PO−Al bonds. The second route proceeds via the condensation mechanism:
+ +
* * **
R‐PO OH2( ) OH R‐PO3 H O.2 [ ]6
This implies that the phosphonate headgroup can, in principle, form two stoichiometrically different bidentates with the surface, R-PO2(OH)** and R-PO3**. These two bidentates can then
trans-form to tridentates via the following reactions:
+ + ** * *** R‐PO OH2( ) OH R‐PO3 H O2 [ ]7 and + ** * *** R‐PO3 R‐PO3 , [ ]8
where *** indicates tridentate bonding with the surface or, alter-natively, three PO−Al bonds. Note that a water molecule is liberated in reactions 6 and 7, hence for their proper thermodynamic characterization, calculations of reaction free energies are required, given that the roto-translational contribution of a released water molecule to the Helmholtz free energy is −0.51 eV (calculated value) at room temperature and 1 atm. In contrast, reactions5and8
can be approximately described by reaction energies, because no new species is immobilized or liberated.
Reactions5to8were modeled on two different surface models, OH/AlxO/Al(111) and Al(OH)3(010), and both contain one OH
vacancy per supercell. The corresponding results, obtained at low molecular coverage with a methyl group used as a minimal back-bone, are presented in Fig.17. Thisfigure schematically presents the reactions5to8along with reaction (free) energies and the snapshots of identified bidentate and tridentate structures. Two surface models were used in order to diminish model induced biases. The results indicate that transformation of phosphonate monodentate to biden-tate is viable only near an OH vacancy via reaction 5 with the reaction energies (ΔEmono→bi) of −0.90 and 0.02 eV on OH/AlxO/Al(111) and Al(OH)3(010) models, respectively. In
con-trast, the transformation from monodentate to R–PO3** bidentate via
the condensation mechanism, reaction 6, is found considerably endothermic on both surface models; also the corresponding reaction free energies are endergonic, the values being 0.68 and 0.37 eV on OH/AlxO/Al(111) and Al(OH)3(010), respectively.
As for the transformation of bidentate to tridentate, the two surface models differ greatly. While this transformation is en-dothermic and endergonic on the OH/AlxO/Al(111) model, it is
exergonic on Al(OH)3(010), irrespectively of the path taken.
Cumulatively, reaction free energies of monodentate to tridentate transformation are+0.88 and −0.39 eV on OH/AlxO/Al(111) and
Al(OH)3(010) models with an OH vacancy, respectively. This
implies that, according to DFT calculations, formations of bidentates and tridentates are viable, but only near OH vacancies. In particular, the formation of tridentate is viable on the Al(OH)3(010) model with
the OH vacancy, whereas the OH/AlxO/Al(111) model supports
Electrochemical properties of etched aluminum modified with alkyl compounds with various anchor groups.—Potentiodynamic polarization curves in 0.5 M NaCl were recorded for bare etched Al and etched Al samples immersed for 30 min in 5 mM ethanol solution of different organic chemicals with C8 alkyl chain and various anchor groups (N3, ImiH, NH2, SS, SH, SCN, COOH,
Bn-COOH and PO(OH)2) (Fig.18). The polarization curve of alkaline
etched Al, recorded in 0.5 M NaCl after 1 h under open circuit condition, shows the cathodic curve related to the reduction of oxygen and the anodic curve to dissolution of Al.62The corrosion potential (Ecorr) was located at −0.78 V, and corrosion current
density (jcorr) was 3.05μA cm−2(TableII).
All samples pre-immersed in ethanol solution of C8-R or C18-R compounds show different curves than the etched sample, indicating that the presence of adsorbed organic layer affects the electroche-mical response of Al samples. Electrocheelectroche-mical parameters deduced from polarization curves are presented in TableII. C8-SS-C8 and, especially, C8-N3are the only compounds which act as corrosion
activators with jcorr larger than that of bare etched Al. All other
compounds act as mixed corrosion inhibitors as they caused the reduction of current density in both cathodic and anodic regions leading to overall reduction in corrosion current density compared to that of bare etched Al (3.05μA cm−2). Among C8–R compounds, roughly three groups could be distinguished according to the current density and shape of the curve: (i) COOH, SCN and SH with jcorr
above 1μA cm−2but being up to two times smaller than for the bare etched Al, (ii) NH2, Bn-COOH and ImiH with jcorrreduced by about
one order of magnitude (jcorr< 0.5 μA cm−2), and (iii) PO(OH)2
with jcorr ≈ 0.1 μA cm−2 and a pseudo-passive range, which is
defined as a plateau region in which the current density remains constant or increases very slowly with increasing potential; it is limited by the breakdown potential at which current density increases abruptly, i.e. ΔEpassive = ∣Ebreak − Ecorr∣c. For Figure 16. A scheme showing the transformation of monodentate bonded C1-COO* (left) and C1-PO2(OH)* (right) into C1-COO** and C1-PO2(OH)** bidentates on the OH/AlxO/Al(111) model with an OH vacancy defect; the number of the suffix * indicates the number of CO−Al or PO−Al bonds. The snapshots of the resulting bidentates are also shown on the far left and right. Monodentate to bidentate transformation reaction energies (ΔEmono→bi), calculated with spin-polarized calculations, are also given.
Figure 15. The dependence ofΔE of a full monolayer of Cn-COO* on alkyl chain length n (purple squares) and the ΔE for the full monolayer of C1-Bn-COO* (orange square). TheΔE of C1-Bn-COO* monolayer is closer to that of C8-COO* than to C1-COO*, which indicates that the benzene group of Bn-COO* acts more as a backbone than an anchor group; note that C1-Bn contains 7 C atoms. The snapshots of the C1-COO* and C1-Bn-COO* monolayers are shown on the left and right, respectively. TheΔE values for the monolayers of Cn-COO* are taken from our parallel publication and correspond to the OH/AlxO/Al(111) model.20
cPlease note that the
ΔEpassiveis taken arbitrarily as a passive range since it denotes the range between breakdown potential and corrosion potential, and not between breakdown potential and potential of passivation.
Figure 17. Reaction schemes for monodentate to tridentate transformations of the phosphonate headgroup on OH/AlxO/Al(111) (left) and Al(OH)3(010) (right) surface models containing one OH vacancy per supercell. Two different reaction paths (via two different bidentates) are considered: the upper path proceedsfirst with the condensation reaction step and then with the plain transformation and vice-versa for the bottom path. The corresponding reaction energies (at 0 K) and reaction free energies (at 298 K and 1 atm), calculated with spin-polarized calculations, are also given.ΔE and ΔG correspond to condensation reaction steps, whereasΔXmono→biandΔXbi→tri(X≡ E or G) correspond to plain monodentate to bidentate and plain bidentate to tridentate transformations, respectively. Snapshots of the most stable identified bidentates and tridentates are shown in the bottom row panels.
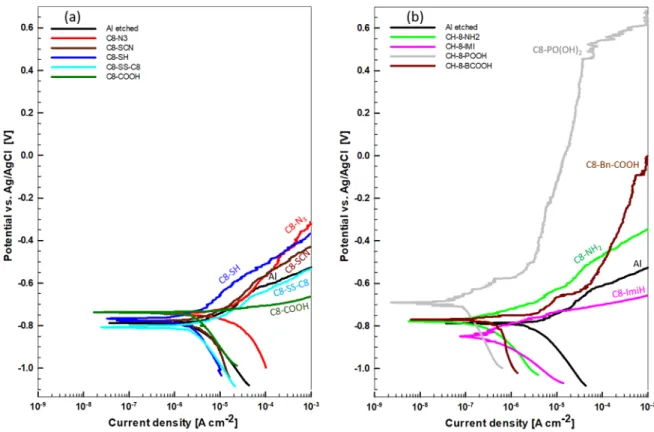
Figure 18. Potentiodynamic polarization curves recorded in 0.5 M NaCl or alkaline etched Al with and without prior immersion for 30 min in 5 mM ethanol solution of organic compounds with octyl alkyl chain and various anchor groups: (a) azide N3, thiocyanate SCN, thiol SH, disulphide SS, and carboxylic COOH, and (b) amino NH2, imidazole ImiH, phosphonic PO(OH)2and benzoic Bn-COOH. The rest time under open circuit conditions was 1 h. The scan rate was 1 mV s−1. Electrochemical parameters are presented in TableII.
C8-PO(OH)2 the value of ΔEpassive is about 1.2 eV; the benzoic
group also showed some tendency for pseudo-passivity. The reduc-tion of current density is similar on both more noble (cathodic) and less noble (anodic) sides. Ecorrwas either up to 50 mV more cathodic
(Bn-COOH, SCN, NH2, SH, SS and ImiH), or up to 140 mV more
anodic (N3, COOH and PO(OH)2) compared to the bare sample.
Based on these results it can be stated that compounds with the C8 chain and COOH, SCN, SH, NH2, Bn-COOH and ImiH anchor
groups act as weak to moderate mixed inhibitors. C8-PO(OH)2acts
as a mixed barrier inhibitor with a strong effect on the anodic side showing barrier properties.
For four anchor groups—COOH, SH, ImiH and PO(OH)2—the
effect of chain length on corrosion current density was investigated. Polarization curves recorded for bare etched Al and etched Al samples immersed in organic chemicals with the C18 alkyl chain and four anchor groups are presented in Fig. 19. The deduced
electrochemical parameters are presented in TableII. For the sake of comparison, curves recorded for Al modified with C8 chain with same anchor groups are repeated herein. Elongation of the alkyl chain with the SH group from C8 to C18 did not contribute to increased protectiveness of the surface, and jcorrwas even larger than
for the octyl chain and bare etched Al. A similar situation is encountered for the imidazole group with the difference that in the anodic range the increase in current density was lower. When the C18 chain is bonded to COOH and PO(OH)2groups the elongation
of the alkyl chain is beneficial and results in the establishment of a broad pseudo-passivity region withΔEpassiveof 1.17 V and 1.98 V,
respectively. In both cases jcorrwas below 0.1μA cm−2(TableII).
Based on these results it can be stated that thiol and imidazole groups were not protective regardless the length of alkyl chain, the carboxylic group was protective for the longer (C18) chain, and the phosphonic group was protective regardless of the length of alkyl chain. These experimental electrochemical results confirm the sur-face-analytical results (Figs. 4,5, 7–10) and computational results presented in Figs.13–17.
Conclusions
1. Thirteen alkyl-based organic compounds were purposely pre-pared to study the effect of anchor group and alkyl chain length on adsorption on a superhydrophylic, hydroxylated aluminum surface. The study was tackled on four levels: (i) synthesis or purchase of appropriate organic compounds, (ii) fabrication of adsorbed organic layers on Al etched in alkaline NaOH solution; (iii) their experimental characterization using electrochemical and surface-analytical (SEM/EDS, XPS, and ToF–SIMS) tech-niques; and (iv) DFT modeling of adhesion and self-assembly of organic layers on oxidized Al substrates.
2. Based on electrochemical results, nine anchor groups—azide, imidazole, thiocyanate, amino, disulfide, thiol, phosphonic, carboxylic and benzoic—bonded to an octyl alkyl chain (C8-R) can be divided into three groups: (i) corrosion activators (azide and disulfide), (ii) not inhibitors or weak to moderate inhibitors (carboxylic, thiocyanate, thiol, amino, benzoic and imidazole) and (iii) strong inhibitors (phosphonic). When bonded to a longer, octadecyl alkyl chain (C18-R), imidazole and thiol groups remained weak inhibitors, the phosphonic group remained a strong inhibitor, and the carboxylic acid became a strong inhibitor. In other words, thiol and imidazole
Table II. Electrochemical parameters (corrosion current density (jcorr), corrosion potential (Ecorr), breakdown potential (Ebreak) andΔEpassive= ∣Ebreak− Ecorr∣) deduced from potentiodynamic polarization curves (Figs.18and19) recorded for etched Al (labelled as Al) or etched Al samples covered by organic layer (labelled as Cx-R) where x is the number of carbon atoms in the alkyl chain (x = 8 or 18) and R is the anchor group as defined in Fig.1. Al was etched for 20 min in 0.1 M NaOH at 90 °C, cooled down in the same solution, and then immersed in 5 mM ethanol solution of organic chemical. Results are presented as mean ± standard deviation.
Sample/Type of organic chemical jcorr/μA cm−2 Ecorrvs Ag/AgCl/V Ebreakvs Ag/AgCl/V ΔEpassive/V
Al 3.05 ± 0.21 −0.74 ± 0.01 — — C = 8 C8-N3 15.05 ± 3.61 −0.75 ± 0.01 — — C8-SS-C8 4.35 ± 2.61 −0.80 ± 0.003 — — C8-COOH 2.24 ± 0.53 −0.75 ± 0.01 — — C8-SCN 2.10 ± 1.13 −0.78 ± 0.008 — — C8-SH 1.37 ± 1.17 −0.80 ± 0.04 — — C8-NH2 0.45 ± 0.11 −0.77 ± 0.005 — — C8-Bn-COOH 0.29 ± 0.18 −0.77 ± 0.004 — — C8-ImiH 0.22 ± 0.02 −0.83 ± 0.02 — — C8-PO(OH)2 0.11 ± 0.003 −0.66 ± 0.05 0.36 ± 0.13 1.20 C = 18 C18-SH 3.82 ± 2.00 −0.79 ± 0.001 — — C17-COOH 0.07 ± 0.01 −0.63 ± 0.05 0.54 ± 0.13 1.17 C18-PO(OH)2 0.08 ± 0.00 −0.69 ± 0.08 1.29 ± 0.24 1.98 C18-ImiH 3.75 ± 0.28 −0.77 ± 0.006 — —
Figure 19. Potentiodynamic polarization curves recorded in 0.5 M NaCl for alkaline etched Al without and with subsequent immersion for 30 min in 5 mM ethanol solution of organic compounds with octyl (solid) and octadecyl (dotted) alkyl chains and various anchor groups: thiol SH, imidazole ImiH, carboxylic COOH and phosphonic PO(OH)2. The resttime under open circuit conditions was 1 h. The scan rate was 1 mV s−1. Electrochemical parameters are presented in TableII.