The MIT Faculty has made this article openly available.
Please share
how this access benefits you. Your story matters.
Citation
Pfau, Sarah J. et al. “Aneuploidy Impairs Hematopoietic Stem Cell
Fitness and Is Selected against in Regenerating Tissues in Vivo.”
Genes & Development 30.12 (2016): 1395–1408.
As Published
http://dx.doi.org/10.1101/gad.278820.116
Publisher
Cold Spring Harbor Laboratory Press
Version
Final published version
Citable link
http://hdl.handle.net/1721.1/108393
Terms of Use
Creative Commons Attribution-NonCommercial 4.0 International
Detailed Terms
http://creativecommons.org/licenses/by-nc/4.0/
Aneuploidy impairs hematopoietic stem
cell fitness and is selected against
in regenerating tissues in vivo
Sarah J. Pfau,
1,2,3Rebecca E. Silberman,
1,2,3Kristin A. Knouse,
1,2,3,4and Angelika Amon
1,2,3 1David H. Koch Institute for Integrative Cancer Research, Massachusetts Institute of Technology, Cambridge, Massachusetts 02139, USA;2Howard Hughes Medical Institute, Massachusetts Institute of Technology, Cambridge, Massachusetts 02139, USA;
3
Department of Biology, Massachusetts Institute of Technology, Cambridge, Massachusetts 02139, USA;4Division of Health Sciences and Technology, Harvard Medical School, Boston, Massachusetts 02115, USA
Aneuploidy, an imbalanced karyotype, is a widely observed feature of cancer cells that has long been hypothesized to promote tumorigenesis. Here we evaluate the fitness of cells with constitutional trisomy or chromosomal instability (CIN) in vivo using hematopoietic reconstitution experiments. We did not observe cancer but instead found that aneuploid hematopoietic stem cells (HSCs) exhibit decreased fitness. This reduced fitness is due at least in part to the decreased proliferative potential of aneuploid hematopoietic cells. Analyses of mice with CIN caused by a hypo-morphic mutation in the geneBub1b further support the finding that aneuploidy impairs cell proliferation in vivo. Whereas nonregenerating adult tissues are highly aneuploid in these mice, HSCs and other regenerative adult tissues are largely euploid. These findings indicate that, in vivo, mechanisms exist to select against aneuploid cells.
[Keywords: aneuploidy; chromosomal instability; hematopoiesis; single-cell sequencing; population flush hypothesis] Supplemental material is available for this article.
Received February 1, 2016; accepted in revised form May 27, 2016.
More than 90% of human solid tumors are aneuploid (Rajagopalan and Lengauer 2004). It was initially hypothe-sized in 1914 that aneuploidy may play a causal role in tumorigenesis (Boveri 1914), and recent analyses of tumor genomes support this idea, finding that aneuploidies observed in cancer can be explained in part by loss of tumor suppressor genes and gain of oncogenes (Davoli et al. 2013). Despite the prevalence of imbalanced karyo-types in cancer, in vitro studies of aneuploid cells have not provided decisive evidence that aneuploidy alone can promote tumorigenesis. Trisomic human (Segal and McCoy 1974; Stingele et al. 2012) and mouse (Williams et al. 2008) cells exhibit decreased proliferation, and cells harboring mutations that promote chromosomal instabil-ity (CIN) proliferate either normally (Babu et al. 2003; Jeganathan et al. 2007; Weaver et al. 2007) or more slowly, indicating that aneuploidy is, at best, fitness-neutral. Fur-thermore, studies in mouse models of CIN and Down syn-drome (DS) have demonstrated that these conditions can both promote and inhibit tumorigenesis in vivo (Pfau and Amon 2012). These observations make clear the need for additional experimental systems to assess the effects of aneuploidy per se on cell proliferation in vivo. However, systematic evaluation of aneuploid cell fitness
in vivo is difficult because most autosomal aneuploidies are embryonic-lethal in mammals.
To bypass the embryonic lethality of aneuploidy in mice, we performed transplantation experiments with hematopoietic stem cells (HSCs) isolated from mouse embryos. HSCs provide a cellular system that is amenable for systematic study of the effects of aneuploidy in vivo because HSCs give rise to all differentiated blood cell types (Kondo et al. 2003). Whereas HSCs reside in the bone marrow of adult mice, they can be found in the fetal liver between embryonic day 12.5 (E12.5) and E15.5 (Orkin and Zon 2008), allowing the isolation of HSCs from fetal livers of aneuploid embryos that survive to this embryonic age.
High doses of irradiation ablate the hematopoietic func-tion of HSCs; however, transplantafunc-tion of HSCs from a nonirradiated donor can reconstitute the hematopoietic system of an irradiated recipient. Thus, aneuploid fetal liver HSCs (FL-HSCs) can be used to reconstitute the blood of a lethally irradiated wild-type recipient, giving rise to an otherwise wild-type mouse with aneuploid blood. Hematopoietic reconstitutions performed with
Corresponding author: angelika@mit.edu
Article published online ahead of print. Article and publication date are online at http://www.genesdev.org/cgi/doi/10.1101/gad.278820.116.
© 2016 Pfau et al. This article is distributed exclusively by Cold Spring Harbor Laboratory Press for the first six months after the full-issue publi-cation date (see http://genesdev.cshlp.org/site/misc/terms.xhtml). After six months, it is available under a Creative Commons License (At-tribution-NonCommercial 4.0 International), as described at http://creati-vecommons.org/licenses/by-nc/4.0/.
FL-HSCs derived from euploid wild-type littermates allow for direct comparison of aneuploid and euploid HSC fit-ness. Thus, the hematopoietic compartment represents an ideal in vivo system to assess the fitness of aneuploid karyotypes that cause embryonic lethality. Analyzing HSC fitness in vivo not only permits evaluation of aneu-ploid cell proliferative capacity but also provides insight into how aneuploidy affects stem cell potential, as pre-vious studies have demonstrated that aneuploidy can per-turb stem cell viability and differentiation (Adorno et al. 2013; Gogendeau et al. 2015). Finally, this system also offers a unique model for studying aneuploid cells in the context of an otherwise euploid environment, a setting typical of tumorigenesis in vivo.
We chose three mouse models of aneuploidy to evaluate the fitness of aneuploid HSCs: constitutional trisomy 16, constitutional trisomy 19, and mice harboring a hypomor-phic allele of the gene Bub1b, which encodes the spindle assembly checkpoint protein BUBR1 (Bub1bH/H) (Baker
et al. 2004). Mouse chromosome 16 is the closest whole-chromosome homolog to human whole-chromosome 21 and thus a model of DS. This model is of particular interest because individuals with DS often show perturbations in the hematopoietic lineage (Henry et al. 2007; Choi 2008) and have a greatly increased risk of developing childhood leukemia (Satge et al. 1998). Mouse chromosome 19 is the smallest mouse autosome, with homology mainly with human chromosomes 9, 10, and 11. While mouse chromo-some 19 is not known to harbor genes typically associated with acute myeloid leukemia (AML), activating muta-tions in JAK2 (encoded by mouse chromosome 19) are fre-quently associated with myeloproliferative neoplasms (Kiladjian 2012). The Bub1bH/H CIN model produces
aneuploid cells with mostly single-chromosome gains or losses, thus representing a variety of aneuploid chromo-somes due to random missegregation events (Baker et al. 2004). Bub1bH/Hmice survive to adulthood, permitting
comparison of both fetal liver and adult bone marrow Bub1bH/HHSCs with constitutional trisomic FL-HSCs. Bub1bH/H mice develop progeria-like symptoms and
have a decreased life span but do not develop cancer (Baker et al. 2004).
A comparison of HSCs from these three models has revealed a range of responses to aneuploidy in the blood and permitted differentiation between chromosome-spe-cific and general effects of aneuploidy in vivo. We found that while some aneuploidies can be well tolerated in the hematopoietic lineage, aneuploidy generally causes a decrease in HSC fitness. This decreased fitness is at least partially due to the decreased proliferative potential of aneuploid hematopoietic cells. Additional analyses of Bub1bH/HCIN mice show that aneuploidy is tolerated
in this strain during periods of rapid hematopoietic population expansion. However, single-cell sequencing of tissues from adult Bub1bH/Hmice revealed that
aneu-ploidy is not uniformly tolerated across different adult tis-sue types. While tistis-sues that are largely nonproliferative in the adult display high levels of aneuploidy, regenerative tissues harbor few, if any, aneuploid cells. These data pro-vide epro-vidence that aneuploidy-selective mechanisms
eliminate aneuploid cells during adult hematopoiesis and likely in other tissues that regenerate during adulthood.
Results
Aneuploidy decreases HSC competitive fitness in vivo To determine the effect of aneuploidy on cell fitness in vivo, we first used competitive reconstitution assays to evaluate the fitness of aneuploid FL-HSCs. In this assay, two populations of HSCs were coinjected into a lethally irradiated recipient, and the relative contributions of each population to the hematopoietic compartment were evaluated over time by analysis of the peripheral blood. To ensure that equal numbers of cells were being competed, we first measured HSC levels. Quantification by flow cytometry revealed no significant differences in the HSC levels in trisomy 16 or trisomy 19 fetal livers (Fig. 1A). Because Bub1bH/Hanimals are viable, we
quan-tified HSC levels in the adult and found them to be similar to those of their wild-type littermates (Supplemental Fig. S5I). Thus, we concluded that HSC levels are similar in aneuploid and euploid donors.
To assess the fitness of aneuploid HSCs, we injected equal numbers of live aneuploid or euploid littermate con-trol fetal liver cells into a lethally irradiated euploid recip-ient together with the same number of live fetal liver cells from a common euploid competitor of the same embry-onic age (referred to here as common wild type) (Fig. 1B). To distinguish between experimental HSCs and the com-mon wild-type competitor, each donor was tracked using a different isoform of the pan-leukocyte cell surface marker CD45, which can be distinguished by isoform-specific antibodies (CD45.1 and CD45.2). Aneuploid donors and their wild-type littermates expressed the CD45.2 isoform, whereas the common wild-type competitor expressed the CD45.1 isoform. We chose to use a CD45.1 common donor because previous studies had shown that CD45.1 HSCs exhibit decreased fitness when compared with CD45.2 HSCs in competition assays (Waterstrat et al. 2010), thus giving the CD45.2 aneuploid donors a slight advantage in these experiments. Additionally, we used CD45.1 recipi-ents to unambiguously quantify the contribution from aneuploid and euploid wild-type littermate donors. We further note that, in this experimental setup, a small pop-ulation of recipient-derived memory T cells remains in the recipient peripheral blood after reconstitution despite lethal irradiation (Frasca et al. 2000). This recipient-derived memory cell population is evident in our data 3 wk after transfer (Fig. 1C–E). In these samples, an increased proportion of the blood is comprised of CD45.1-positive cells because donor-derived peripheral blood cells are present at low levels at this early stage of reconstitution, making the contribution from recipient-derived memory cells more prominent.
Evaluation of competitive reconstitution assays over time revealed a range of aneuploid cell fitness pheno-types. Trisomy 16 FL-HSCs were much less fit than FL-HSCs from their wild-type littermates and were nearly
completely outcompeted by the common wild-type donor (Fig. 1C,F). Trisomy 19 FL-HSCs exhibited slightly reduced relative fitness (Fig. 1D,F). Bub1bH/HFL-HSCs showed no relative fitness defects in this assay (Fig. 1E,F). Because we did not observe decreased fitness in Bub1bH/Hcompetitive reconstitutions, we assessed the level of aneuploidy in these CIN cells. We isolated periph-eral white blood cells derived from Bub1bH/H FL-HSC
donor cells from a recipient mouse 16 wk after transfer. Bub1bH/HCD45.2 cells were collected by FACS, and their karyotype was determined by single-cell sequencing. Analysis of 18 cells revealed seven to be aneuploid (∼38.9%) (Fig. 1G;Supplemental Fig. S7A). This level of
aneuploidy is on par with previously reported levels of aneuploidy for the brain (38.1%) and the liver (18.8%) (Knouse et al. 2014) as well as for stimulated splenocytes (3%–33%) in adult Bub1bH/H mice (Baker et al. 2004).
Therefore, Bub1bH/H FL-HSCs show fitness similar to that of euploid wild-type controls in this assay despite the prevalence of aneuploid cells in the peripheral blood. In summary, when compared with the average fitness of euploid wild-type littermates after 18 wk, the average rel-ative fitness of trisomy 16, trisomy 19, and Bub1bH/H
FL-HSCs was 0.08, 0.84, and 1.06, respectively (Fig. 1F). Thus, in this assay, some aneuploidies confer decreased HSC fitness, whereas others are fitness-neutral. These
Figure 1. Aneuploidy decreases HSC competitive fit-ness in vivo. (A) The percentage of HSCs (CD150+
CD48−Sca-1+lin−cells) found in trisomy 16 and
tris-omy 19 fetal livers was quantified by flow cytometry. Data are shown as mean ± standard deviation. (B) Sche-matic of competitive reconstitution experiments. (C– E) CD45.2 fetal liver cells from wild-type or aneuploid E14.5 littermates were coinjected into a lethally irradi-ated CD45.1 recipient with an equal number of fetal liver cells from a CD45.1 common wild-type donor of the same age derived from a separate mating. Peripheral blood was sampled at the indicated times. The percent-age of the white blood cell population contributed by each donor was quantified by flow cytometry with iso-form-specific antibodies against CD45.1 and CD45.2 for recipients of common wild-type cells and trisomy 16 fetal liver cells (C, left graph) (n = 17), trisomy 19 fetal liver cells (D, left graph) (n = 10), and Bub1bH/H fetal
liver cells (E, left graph) (n = 10). (C–E, right graphs) The contribution of wild-type littermates when com-peted to the common wild type for all aneuploidies was quantified at the same time in C (right graph) (n = 20), D (right graph) (n = 8), and E (right graph) (n = 6). Data are represented as mean ± standard devia-tion for each time point. (F ) Ratios of the average per-centage of the peripheral blood reconstituted by the aneuploid fetal liver cells to the average percentage of the peripheral blood reconstituted by wild-type litter-mate fetal liver cells at the indicated times are shown. (G) Single-cell sequencing of white blood cells from a mouse competitively reconstituted with CD45.2 Bub1bH/Hand CD45.1 euploid FL-HSCs at 16 wk after
transplantation (Fig. 1E) revealed that seven of 18 CD45.2 Bub1bH/H cells analyzed (∼39%) were
aneu-ploid. Karyotypes of the seven aneuploid cells are shown with chromosome gains in red, chromosome losses in blue, and euploidy in black. Segmentation plots of all sequenced cells are shown inSupplemental Figure S7A.
findings suggest either that the observed fitness decreases are due to chromosome-specific effects or that a certain level of aneuploidy is tolerated in the blood.
Decreased fitness of aneuploid HSCs is due to decreased proliferation
To determine why trisomy 16 and trisomy 19 FL-HSCs exhibited decreased relative fitness in competitive recon-stitution assays, we first evaluated the ability of hemato-poietic cells from each aneuploid donor to home to the bone marrow niche, a property that is essential to restore hematopoiesis during HSC transplantation (Lapidot 2005). Fetal liver cells were labeled with a fluorescent cell surface dye and injected into irradiated recipients. The number of labeled cells in the bone marrow was quan-tified after 24 h. We observed no significant decrease in the homing efficiency of trisomy 16, trisomy 19, and Bub1bH/Hfetal liver cells (Student’s t-test) (Fig. 2A),
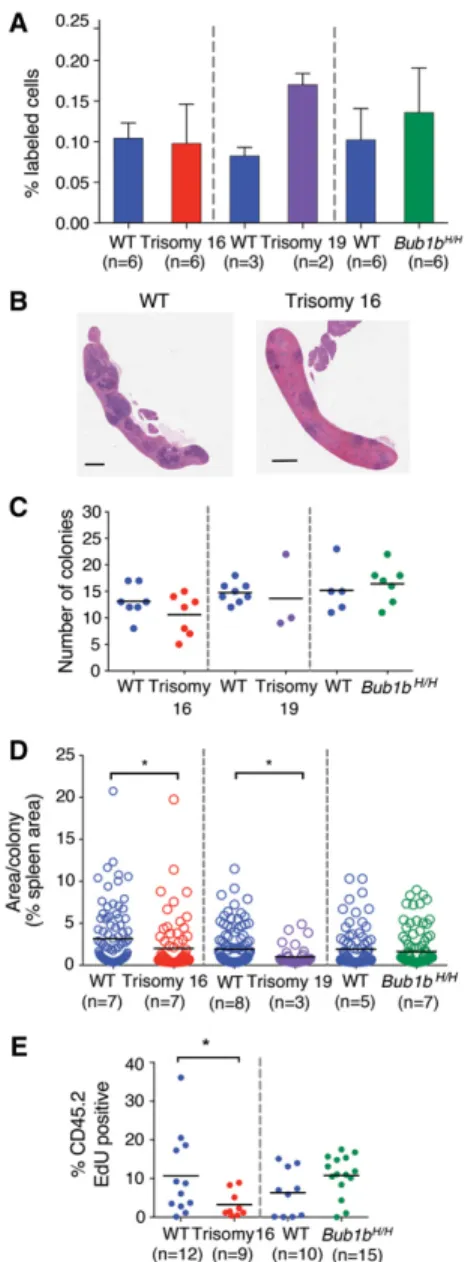
sug-gesting that a defect in homing is not responsible for the decreased ability of aneuploid FL-HSCs to reconstitute the hematopoietic system of lethally irradiated recipients. We next performed colony-forming unit spleen (CFU-S) assays to determine whether the proliferation of aneu-ploid FL-HSC-derived progenitor cells was impaired dur-ing early stages of hematopoietic reconstitution (Purton and Scadden 2007). Irradiated mice were injected with fetal liver cells, and spleens were analyzed 7 or 8 d later (Fig. 2B; Till and McCulloch 1961). Aneuploid and euploid fetal liver cells formed similar numbers of colonies in the spleen (Fig. 2C). However, quantification of the area of each CFU-S colony revealed that the average size of the colonies produced by trisomy 16 and trisomy 19 donor cells was reduced compared with colonies formed by cells from their wild-type littermates (Fig. 2D). The average size of Bub1bH/H CFU-S colonies was similar to those
formed by wild-type littermate fetal liver cells (Fig. 2D). To further evaluate the proliferative potential of aneu-ploid FL-HSCs, we measured EdU incorporation in the bone marrow of irradiated recipient mice reconstituted with trisomy 16 FL-HSCs. The number of EdU-positive donor-derived cells was significantly reduced compared with wild-type controls 6 d after reconstitution (Fig. 2E), indicating that trisomy 16 interferes with proliferation of FL-HSCs and progenitor cells. Consistent with this finding is the observation that trisomy 16 and trisomy 19 fetal livers were significantly smaller than fetal livers of their wild-type littermates (Supplemental Fig. S1). Interestingly, Bub1bH/Hfetal liver-derived cells did not
exhibit decreased proliferation as evaluated by EdU incor-poration 6 d after reconstitution; rather, there appeared to be a (not statistically significant) trend toward increased proliferation in these cells compared with wild-type con-trol cells (Fig. 2E). The analyses of aneuploidy levels in Bub1bH/H tissues described below provide a potential
explanation for this observation. Taken together, our data demonstrate that aneuploid FL-HSCs can home effec-tively but, in the cases of trisomies 16 and 19, show impaired proliferative potential.
Figure 2. Proliferation but not homing ability is reduced in tris-omy 16 and tristris-omy 19 reconstitutions. (A) DiI-labeled fetal liver cells were injected into irradiated recipient mice. The percentage of DiI-positive cells in the bone marrow of recipient mice was measured 24 h after injection. Data are shown as mean ± standard deviation. (B) Representative images of sections of spleens iso-lated from mice transferred with wild-type or trisomy 16 fetal liver cells 8 d after reconstitution. Bar, 1 mm. (C ) Quantification of col-ony-forming unit spleen (CFU-S) colonies from spleen sections of recipient mice of trisomy 16 or wild-type littermate fetal liver cells 8 d after injection and trisomy 19, Bub1bH/H, or wild-type
lit-termate fetal liver cells 7 d after injection. The bar represents the mean value for each condition. (D) Quantification of the mean size of each colony in C as determined by the percent of total spleen area. Measurements from all individuals for each condition were pooled. The bar represents the mean value for each population. Populations were compared by Student’s t-test. (∗) P < 0.05. (E)
Trisomy 16 or Bub1bH/Hfetal liver cells or cells from their
wild-type littermates were injected into lethally irradiated recipients. Mice were injected with EdU 6 d later, and the level of EdU incor-poration in CD45.2-positive donor-derived bone marrow cells was evaluated by flow cytometry 24 h later. The bar represents the mean value for each population. (∗) P < 0.05 by Student’s t-test.
Trisomy 16 recipients exhibit peripheral blood defects and decreased survival
Whereas trisomy 16 FL-HSCs exhibited a severe fitness defect in competitive reconstitution experiments, the fit-ness decrease was more subtle for trisomy 19 FL-HSCs and not evident for Bub1bH/H FL-HSCs. This suggests either that low levels of aneuploidy do not strongly impair HSC fitness or that HSCs were not challenged sufficiently in these assays to reveal decreased cellular fitness. To address the latter possibility, we evaluated the long-term fitness of HSCs from each aneuploid strain individually by serially transferring HSCs from primary to secondary and, in some cases, to tertiary and quaternary recipients (Fig. 3A). Serial transfer poses a significant challenge to the replicative potential of HSCs and their progeny, caus-ing the eventual exhaustion of even wild-type HSCs (Harrison and Astle 1982). Trisomy 16 and trisomy 19 FL-HSCs have been evaluated previously in primary trans-plantation (Herbst and Winking 1991); however, these studies were not performed on an isogenic background, and it is therefore difficult to determine whether the observed phenotypes were due to aneuploidy or factors such as graft rejection (Gropp et al. 1983).
We transferred either CD45.2 trisomy 16 or CD45.2 euploid wild-type littermate fetal liver cells into lethally irradiated CD45.1 primary recipient mice (Fig. 3A). Peripheral blood analyses of primary recipients performed periodically between 4 and 16 wk after transfer revealed that trisomy 16 FL-HSCs harbor significant fitness defects when transferred individually (Fig. 3;Supplemental Fig. S2). These defects are consistent with decreased prolifera-tion in the hematopoietic lineage. For example, trisomy 16 FL-HSCs contributed relatively fewer peripheral white blood cells than wild-type HSCs (Fig. 3B). Trisomy 16 pri-mary recipients also exhibited leukopenia (reduced white blood cell counts) when compared with primary recipi-ents reconstituted with cells from their euploid litter-mates (Fig. 3C). This seemed to be largely due to low numbers of B cells (Supplemental Fig. S2A,B,I). Further-more, complete blood cell counts showed that trisomy 16 primary recipients have comparatively fewer red blood cells and macrocytic anemia, a reduced red blood cell count accompanied by increased red blood cell volume and decreased blood hemoglobin concentration (Fig. 3D;
Supplemental Fig. S2C–G,J). These results are in line with previous in vivo characterizations of trisomy 16 FL-HSCs (Herbst and Winking 1991). In addition to
Transfer 106 fetal liver cells CD45.1 Primary Recipient CD45.1 Secondary Recipient Transfer 106 bone marrow cells WT Aneuploid or CD45.2 Donor CD45.1 Tertiary Recipient Transfer 106 bone marrow cells A E 0 20 40 60 80 100 120 140 160 0 20 40 60 80 10 0 time (days) Percent survival Wild Type (n = 9) Trisomy 16 (n = 7) 0 20 40 60 80 100 120 140 160 0 20 40 60 80 10 0 time (days) Percent s urvival Wild Type 1 (n=5) Wild Type 2 (n=5) Wild Type 3 (n=5) Trisomy 16 1 (n=5) Trisomy 16 2 (n=5) F B Hematocrit 4 6 8 12 16 4 6 8 12 16 0 20 40 60 80 %p a ck ed cell v ol um e Wild Type Trisomy 16 time (weeks)
White blood cell count
4 6 8 12 16 4 6 8 12 16 0 5 10 15 20 25 30 35 K/ µ L Wild Type Trisomy 16 time (weeks)
Frequency of donor-type cells
4 6 8 12 16 4 6 8 12 16 0 20 40 60 80 100 % CD45.2 Wild Type Trisomy 16 time (weeks) Primary Recipients Primary Recipients Primary Recipients
Survival Primary Recipients Survival Secondary Recipients
C D
* * * *
* * * *
* * *
Figure 3. Trisomy 16 causes peripheral blood defects and decreases HSC reconstitution potential. (A) Schematic of serial reconstitution experiments. (B–D) For primary reconstitutions, fetal liver cells from a CD45.2 trisomic embryo or its wild-type littermate were injected into lethally irradiated CD45.1 recipients. Bone marrow cells from primary recipients were injected into secondary CD45.1 recipients to assess serial reconstitution capacity. Peripheral blood of primary recipients of trisomic fetal liver cells or their wild-type littermates was sampled at the indicated times. The percentage of CD45.2-positive cells in the blood of trisomy 16 or wild-type primary recipients was determined by flow cytometry (B), and white blood cell count (C) and hematocrit (D) were determined by complete blood cell counts. The bar represents the mean, and asterisks indicate that the trisomy 16 values are significantly different from the values of wild-type lit-termates at the indicated time by Student’s t-test. P < 0.05. (E) Survival of recipients of trisomy 16 or wild-type fetal liver cells after trans-fer. (F ) Survival of secondary recipients of trisomy 16 or wild-type bone marrow cells from primary recipients.
peripheral blood defects, trisomy 16 primary recipients exhibited decreased survival compared with primary recipient mice reconstituted with HSCs from their euploid wild-type littermates (Fig. 3E).
As the ultimate test of HSC potential, secondary trans-fers were performed with bone marrow cells from trisomy 16 primary recipients that survived to 16 wk. Although long-term reconstituted primary recipients had compara-ble HSC levels in the bone marrow (Supplemental Fig. S2K), transfer of wild-type primary recipient bone marrow cells efficiently reconstituted secondary recipients, while trisomy 16 primary recipient HSCs failed to reconstitute secondary recipients (Fig. 3F). We conclude that trisomy 16 FL-HSCs have a substantial fitness defect that is at least in part due to decreased proliferative potential, lead-ing to HSC exhaustion upon secondary transfer.
Trisomy 19 is better tolerated in the blood than trisomy 16
In contrast to trisomy 16 FL-HSCs, trisomy 19 FL-HSCs contributed effectively to the white blood cell lineages in primary recipients (Fig. 4A;Supplemental Fig. S3A–J). Recipients reconstituted with trisomy 19 FL-HSCs showed normal white blood cell counts when compared with recipients reconstituted with wild-type littermate FL-HSCs (Fig. 4B), exhibited normal hematocrit levels (Fig. 4C), and did not show either red blood cell defects (Supplemental Fig. S3C–G) or macrocytic anemia ( Supple-mental Fig. S3J). However, trisomy 19 primary recipients harbored fewer platelets compared with wild-type pri-mary recipients at early time points (Supplemental Fig. S3H). Furthermore, the proportion of the blood comprised of each white blood cell type in trisomy 19 primary recip-ients was not significantly perturbed (Supplemental Fig.
S3A,B,I). Consistent with trisomy 19 having little or no effect on HSC fitness in primary reconstitutions, we found that all mice transplanted with trisomy 19 HSCs survived both primary transfer of fetal liver cells and secondary transfer of bone marrow cells isolated from pri-mary recipients (data not shown). Furthermore, secondary recipient mice showed no obvious peripheral blood defects (Supplemental Fig. S3K–U) except for a slightly weaker initial engraftment after 4 wk. However, this delay did not persist. In fact, the engraftment at 8 wk was stron-ger in the trisomy 19 HSC secondary recipients than in wild-type recipients (Student’s two-tailed t-test, P < 0.05) (Fig. 4D). Upon tertiary transfer, however, we began to see evidence of decreased fitness in some recipients of tris-omy 19 bone marrow cells (Fig. 4E) even though HSC lev-els were similar in the bone marrow of trisomy 19 and wild-type long-term reconstituted secondary recipients (Supplemental Fig. S3V). While there were no obvious peripheral blood defects when compared with wild-type tertiary recipients (Supplemental Fig. S4A–K), weaker engraftment of trisomy 19 cells was evident in some terti-ary recipients (Fig. 4E), and long-term survival of tertiterti-ary recipients was slightly decreased (Supplemental Fig. S4L). Trisomy 19 fitness defects became even more pro-nounced in quaternary transfers (Fig. 4F). This defect was not due to fewer HSCs being transferred. Trisomy 19 and wild-type long-term reconstituted tertiary recipi-ents had comparable levels of HSCs (Supplemental Fig. S4M), but the majority of trisomy 19 quaternary recipient mice showed very low levels of engraftment compared with wild-type quaternary recipients (Fig. 4F). Lethality was high in both wild-type and trisomy 19 quaternary recipients (Supplemental Fig. S4O). Sequencing of the CD45.2 cells in two trisomy 19 quaternary recipients 14 wk after transfer confirmed that the trisomic
A White Blood Cell Count
4 6 8 12 16 4 6 8 12 16 0 5 10 15 20 25 30 35 K/µ L time (weeks) Hematocrit 4 6 8 12 16 4 6 8 12 16 0 20 40 60 80
% packed cell volume
time (weeks) Primary Recipients
Frequency of donor-type cells
4 6 8 12 16 4 6 8 12 16 0 20 40 60 80 100 % CD45.2 Wild Type Trisomy 19 time (weeks) Primary Recipients Primary Recipients
D Frequency of donor-type cells
4 8 12 16 4 8 12 16 0 20 40 60 80 100 time (weeks) Secondary Recipients B C E F Tertiary Recipients
Frequency of donor-type cells
4 9 12 16 4 9 12 16 0 20 40 60 80 100 time (weeks)
* *
Quarternary RecipientsFrequency of donor-type cells
4 8 12 17 4 8 12 17 0 20 40 60 80 100 % CD45.2 Trisomy 19 time (weeks) Wild Type Trisomy 19 Wild Type Trisomy 19 Wild Type Trisomy 19 Wild Type Trisomy 19 % CD45.2 % CD45.2 Wild Type
Figure 4. Trisomy 19 HSC reconstitution potential is reduced upon serial reconstitution. (A–E) For trisomy 19 or wild-type primary recipients, the percentage of CD45.2-positive cells in the peripheral blood (A), white blood cell count (B), and hematocrit (C) was deter-mined. The percentage of CD45.2-positive cells in the blood of trisomy 19 or wild-type secondary recipients (D), tertiary recipients (E), and quaternary recipients (F ) was also evaluated. The bar represents the mean value for each condition, and asterisks indicate that the trisomy 19 values are significantly different from the values of wild-type littermates at the indicated time by Student’s t-test. P < 0.05.
chromosome was retained through all serial transfers (Supplemental Fig. S4N). We conclude that trisomy 19 is better tolerated in the hematopoietic lineage than trisomy 16, with no difference in survival and little difference in peripheral blood cell counts in both primary and secon-dary recipient mice. However, decreased reconstitution potential in tertiary and quaternary recipients indicates that aneuploidy of even the smallest mouse autosome will eventually lead to reduced fitness.
Bub1bH/HHSCs undergo stem cell exhaustion upon serial transplantation
We next sought to evaluate the fitness of the Bub1bH/H
CIN model, a model in which random combinations of whole chromosomal aneuploidies can be continuously generated by chromosome missegregation. To evaluate the long-term regenerative potential of Bub1bH/HHSCs,
we used bone marrow HSCs (BM-HSCs) (Fig. 5A) because Bub1bH/Hmice survive to adulthood (Baker et al. 2004)
and show no obvious peripheral blood defects ( Supple-mental Fig. S5A–H). Like Bub1bH/HFL-HSCs, Bub1bH/H
BM-HSCs showed no fitness defects in competitive recon-stitution assays and were found at levels similar to their wild-type littermates (Supplemental Fig. S5I–L). As BM-HSCs have already migrated from the fetal liver to popu-late the bone marrow of an adult mouse, we considered bone marrow transfer a more significant proliferative challenge than transfer of fetal liver cells. Also, FL-HSCs have been shown to reconstitute irradiated recipi-ents more effectively than BM-HSCs (Morrison et al. 1995; Harrison et al. 1997; Ema and Nakauchi 2000). However, Bub1bH/H BM-HSCs contributed most of the peripheral white blood cells in primary recipient mice (Fig. 5B). The animals were mildly leukopenic but exhib-ited no other obvious blood defects (Supplemental Fig. S6A–I).
To further challenge Bub1bH/H HSCs, we performed
serial bone marrow transfers (Fig. 5A). Despite similar total HSC levels in the bone marrow of long-term recon-stituted Bub1bH/Hand wild-type primary recipients ( Sup-plemental Fig. S6J), bone marrow cells from primary Bub1bH/Hrecipients repopulated the hematopoietic
com-partment of secondary recipients less efficiently than wild-type primary recipient bone marrow cells (Fig. 5C). While the donor contributed most of the peripheral white blood cells in mice transferred with wild-type cells (on average, 87.3% at 12 wk; n = 10), variable contribution was observed in Bub1bH/H secondary recipients. Although complete blood cell counts of Bub1bH/H
dary recipients were similar to those of wild-type secon-dary recipients (Supplemental Fig. S6K–S), some Bub1bH/Hsecondary recipient mice had strong donor con-tribution (∼88% at 12 wk; n = 6), one recipient mouse had weak donor contribution (18.2% at 12 wk), and some recipient mice had an intermediate level of donor contri-bution (∼70% at 12 wk; n = 3). Peripheral blood analyses revealed that the blood of the animal with a weak contri-bution of Bub1bH/H HSCs was largely comprised of
CD45.1 cells, presumably descendants from rare recipient HSCs that survived irradiation (Fig. 5C). These data indi-cate that Bub1bH/H BM-HSCs lose their regenerative
potential with serial transfer. To test this further, we per-formed a tertiary transfer with bone marrow cells derived from secondary recipients with high, intermediate, and low peripheral blood contribution from Bub1bH/HHSCs.
Despite similar total HSC levels in the bone marrow of long-term reconstituted Bub1bH/Hand wild-type
secon-dary recipients (Supplemental Fig. S6T), mice that received bone marrow from secondary recipient donors with high Bub1bH/H peripheral blood contribution did
not survive the tertiary transfer (0% survival after 4 wk; n= 10). Mice that received bone marrow from donors with intermediate or low Bub1bH/H peripheral blood
A
B Primary Recipients C Secondary Recipients D Tertiary Recipients
Adult Bub1bH/H orWT CD45.2 Donor Transfer 106 bone marrow cells CD45.1 Primary Recipient CD45.1 Secondary Recipient CD45.1 Tertiary Recipient Transfer 106 bone marrow cells Transfer 106 bone marrow cells 4 8 12 16 4 8 12 16 0 20 40 60 80 100 % C D 4 5 .2 time (weeks) Wild Type Bub1bH/H 4 8 12 16 4 8 12 16 0 20 40 60 80 100 % CD4 5 .2 Wild Type Bub1bH/H time (weeks) 4 6 8 12 16 4 6 8 12 16 0 20 40 60 80 100 % C D 4 5 .2 Wild Type Bub1bH/H time (weeks)
Figure 5. Bub1bH/HBM-HSCs undergo stem cell exhaustion upon serial reconstitution. (A) Schematic of serial reconstitution
experi-ments. (B–D) CD45.2 adult Bub1bH/Hbone marrow cells were serially transplanted into lethally irradiated CD45.1 recipients. The
per-centage of the peripheral blood that is CD45.2-positive was determined in primary (B), secondary (C ), and tertiary (D) recipients at the indicated times. The bar represents the mean value for each condition.
contribution showed increased survival (60% and 80%, respectively, after 16 wk; n = 5 for each condition). How-ever, peripheral blood analyses of all mice that survived tertiary transfer revealed that virtually no cells originated from the original CD45.2 Bub1bH/Hdonor; rather, cells
were derived from some surviving CD45.1 HSCs from the recipients (Fig. 5D). This is in contrast to the tertiary recipients that received bone marrow from secondary recipients reconstituted with wild-type bone marrow, which, on average, had a 71.6% contribution from the wild-type donor after 16 wk (n = 7) (Fig. 5D). Thus, Bub1bH/H BM-HSCs lose the potential to reconstitute hematopoiesis upon serial transfer.
Bub1bH/Hblood cells become progressively less aneuploid during hematopoietic reconstitution
Initial characterization of the Bub1bH/H mouse model
hypothesized that the aging-associated phenotypes ob-served in this mouse were due to progressive accumulation of aneuploid cells in adult tissues (Baker et al. 2004). Thus, Bub1bH/H BM-HSCs could be losing the potential to
reconstitute the hematopoietic system upon serial trans-fer because the Bub1bH/H HSC pool becomes
progres-sively more aneuploid with each successive proliferative challenge such that the level of aneuploidy in Bub1bH/H
HSCs is too high to support effective proliferation. To test this possibility, we determined the karyotype of donor-derived peripheral white blood cells from one Bub1bH/Hsecondary recipient by single-cell sequencing
(57 wk after transfer; 72% CD45.2 at time of sequencing). Surprisingly, all 17 cells sequenced were euploid (Fig. 6A, black triangle;Supplemental Fig. S7B). Thus, the failure of Bub1bH/HBM-HSCs to reconstitute a tertiary recipient
was not simply due to increased aneuploidy in blood cells derived from Bub1bH/H HSCs. Rather, the absence of
aneuploid descendants of Bub1bH/HBM-HSCs suggests
that aneuploid cells derived from these HSCs cannot effec-tively contribute to the peripheral blood of secondary recipients and that aneuploid cells are selected against. This inability of Bub1bH/Haneuploid BM-HSCs to con-tribute to the peripheral blood makes them unable to reconstitute tertiary recipients.
The lack of aneuploidy observed in the peripheral blood of a secondary recipient mouse of Bub1bH/H BM-HSCs is in contrast to what we observed when we sequenced peripheral blood cells of a recipient mouse from a competitive reconstitution assay in which 38.9% of Bub1bH/H FL-HSC-derived peripheral blood cells or 19.45% of the total peripheral blood was aneu-ploid (Figs. 1G, 6A;Supplemental Fig. S7A, gray triangle). We hypothesized that differences in either the source of the HSCs (fetal liver or adult bone marrow) or the time of sampling could be responsible for the different levels of aneuploidy observed in the two analyses. Single-cell sequencing of Bub1bH/HFL-HSCs and BM-HSCs revealed
that both of these cell types do not harbor any aneuploi-dies (n = 19 cells each) (Supplemental Fig. S7C,D), sug-gesting that the latter possibility was more likely responsible for the differences in aneuploidy observed.
The sample from the competitive reconstitution assay that revealed high levels of aneuploidy was obtained 16 wk after transfer of fetal liver donor cells, at a time during the reconstitution process when long-term hematopoie-sis is just being established after a period a rapid expan-sion (Purton and Scadden 2007). In contrast, the sample from the secondary bone marrow recipient mouse that harbored euploid peripheral blood was obtained about a year after transfer of donor cells, when the bone marrow more closely resembled the steady state observed in an adult mouse.
The hypothesis that time after HSC transplantation can affect the degree of aneuploidy in the peripheral blood of recipient mice was informed by an evolutionary principle known as the “population flush” effect (Carson 1968). This principle states that, in rapidly expanding popula-tions (as occurs immediately following transfer of donor HSCs to a lethally irradiated recipient), purifying selec-tion is relaxed such that less-fit individuals can survive and significantly contribute to the population. A predic-tion of this hypothesis is that aneuploid Bub1bH/H
periph-eral blood cells would be more readily observed earlier during hematopoietic reconstitution, when the donor HSCs are rapidly proliferating to establish stable, long-term hematopoiesis, and less-fit cells—such as those gen-erated by random chromosome missegregation in the Bub1bH/H adult mouse—would be tolerated. However,
when populations reach steady state once long-term hem-atopoiesis has been established (as at 57 wk after secon-dary transplantation), purifying selection forces become relatively stronger, selecting against less-fit aneuploid cells. The observation that BM-HSCs are not aneuploid (0% aneuploidy) is consistent with this principle. BM-HSCs divide rarely, relying more on the division of pro-genitor cells to produce blood cells (Busch et al. 2015; Sun et al. 2015). Thus, in steady state, BM-HSCs likely experience strong purifying selection. FL-HSCs proliferate at E14.5, but this cell population remains relatively small even after expansion (Morrison et al. 1995; Ema and Nakauchi 2000). Additionally, FL-HSCs must still home to their niches before adult hematopoiesis commences (Orkin and Zon 2008), making it likely that this stem cell population is also under relatively strong purifying selection.
To directly test whether the population flush hypotsis can explain the degrees of aneuploidy observed in he-matopoietic reconstitutions, we performed a time course, transferring Bub1bH/H fetal liver or bone marrow cells into lethally irradiated recipient mice and performing sin-gle-cell sequencing of peripheral blood cells 3, 6, 13, and 36 wk after transfer to determine the levels of autosomal aneuploidy at these times. Single-cell sequencing of Bub1bH/HFL-HSCs and BM-HSCs, where no aneuploidy was observed, was used as the baseline level of aneuploidy in each population (0 time point in Fig. 6A;Supplemental Fig. S7C,D). In Bub1bH/HFL-HSC recipients, we found
8.3% of peripheral blood cells to be aneuploid 3 wk after transplantation (n = 12 cells) (Fig. 6A;Supplemental Fig. S8A). This percentage increased to 24% aneuploid cells 6 wk after transplantation (n = 25 cells) (Fig. 6A;
Supplemental Fig. S8B). At 13 wk, 25% of peripheral blood cells were aneuploid (n = 16 cells) (Fig. 6A;Supplemental Fig. S8C). However, 36 wk after transplantation, the pro-portion of aneuploid peripheral blood cells dropped to 8.3% (n = 12 cells) (Fig. 6A;Supplemental Fig. S8D). Sim-ilar results were obtained in Bub1bH/HBM-HSC recipi-ents. We found 5.6% of peripheral blood cells to be aneuploid 3 wk after transplantation (n = 18 cells) (Fig. 6A;Supplemental Fig. S8E). At 6 wk, 24% of peripheral blood cells were aneuploid (n = 25 cells) (Fig. 6A; Supple-mental Fig. S8F), and, at 13 wk, 18.8% of peripheral blood cells were aneuploid (n = 16 cells) (Fig. 6A;Supplemental
Fig. S8G). However, 34 wk after transplantation, the pro-portion of aneuploid peripheral blood cells dropped to 15.4% (n = 13) (Fig. 6A;Supplemental Fig. S8H).
Taken together, our findings indicate that a higher level of aneuploidy is tolerated in the peripheral blood of Bub1bH/H recipient mice when the HSC pool is still expanding to establish long-term hematopoiesis after irra-diation; however, these aneuploid cells are depleted from the peripheral blood of recipients once the HSC popula-tion is no longer rapidly expanding and the hematopoietic compartment reaches a steady state. Furthermore, we conclude that HSC source, either fetal liver or adult
A B C D E F 0 6 12 18 24 30 36 54 57 60 0 5 10 15 20 25 30 time (weeks) % aneuploid primary FL HSC recipient primary BM HSC recipient FL HSC recipient competition assay secondary BM reconstitution adult HSCs (n=19) adult PB (n=23) adult keratinocytes (n=23) adult intestines (n=21) adult hepatocytes (n=21) adult brain (n=25) 0 20 40 60 80 100 % euploid adult non-proliferative (n=46) adult proliferative (n=86) transplantation PB (n=155) 0 2 4 6 8 10 12 14 16 # of aneuploid chromosomes/cell * * * * * * transplantation PB neurons and hepatocytes 0 10 20 30 40 50 60 70 80 90 100 % of aneupl o id c e lls single gain multiple gains both loss and gain
single loss multiple losses 1 2 3 4 5 6 7 8 9 10111213141516171819 -0.10 -0.05 0.00 0.05 0.10 Chromosome F requenc y of c h ro m o s om e los s or
gain All Transplantation PB cells (n=155)
Gained Lost (negative) 1 2 3 4 5 6 7 8 9 10111213141516171819 -0.10 -0.05 0.00 0.05 0.10 Chromosome F requenc y of c h ro m o s o m e los s or gain
Neurons and Hepatocytes (n=46)
Gained Lost (negative)
Figure 6. Bub1bH/Hadult regenerative tissues show evidence of selection against aneuploid cells. (A) The percent aneuploidy over time
during hematopoietic reconstitution with Bub1bH/HHSCs was determined by single-cell sequencing of peripheral blood cells derived
from primary recipient mice of Bub1bH/Hbone marrow (open circles) or Bub1bH/Hfetal liver (closed circles) cells at the indicated times
after transfer. Peripheral blood cells from a mouse reconstituted with Bub1bH/HFL-HSCs 16 wk after competitive reconstitution (shown
as the percent of total peripheral blood; gray triangle) (Fig. 1G) and from a Bub1bH/Hsecondary bone marrow recipient mouse (black
tri-angle) (Fig. 5C) were also sequenced. Baseline aneuploidy was determined by single-cell sequencing of FL-HSCs and BM-HSCs. Segmen-tation plots of all sequenced cells are shown inSupplemental Figures S7andS8. (B) Percentage of euploid cells found in different adult Bub1bH/Hcell types. BM-HSCs, peripheral blood cells (PB), keratinocytes, and intestines (in blue) are from∼4-mo-old Bub1bH/Hmice.
Data from hepatocytes and brains (in red) are from Knouse et al. (2014) and∼6-mo-old Bub1bH/Hmice. Segmentation plots of all newly
sequenced cells are shown inSupplemental Figure S9. (C ) The number of aneuploid chromosomes per cell in all adult cells analyzed in A and B. The bar represents the mean value for each population. t-tests were performed for significance. (∗∗∗) P < 0.001. (D) Summary of chro-mosome gain and loss events observed in each cell from transplantation peripheral blood cells and adult nonproliferative neurons and hep-atocytes.“Multiple gains” and “multiple losses” describe cells that have gained or lost two or more chromosomes. “Both loss and gain” describes cells that have gained at least one chromosome and lost at least one chromosome. (E,F ) Frequency of chromosome gain (red) or chromosome loss (green) by chromosome observed in all peripheral blood cells after transplantation (E) and in all adult neurons and hep-atocytes (F ).
bone marrow, does not affect the degree of aneuploidy observed in the peripheral blood.
Aneuploidy is selected against inBub1bH/H
regenerating tissues
The idea that rapidly expanding cell populations are more tolerant of aneuploidy than tissues that have reached a proliferative steady state further predicts that the preva-lence of aneuploidy in adult Bub1bH/H tissues should
depend on the proliferative capacity of tissues. Tissues that form during embryogenesis (when cells are rapidly proliferating) and are largely nonproliferative in the adult should harbor higher levels of aneuploidy. In contrast, tissues that undergo self-renewal and are thus under more stringent purifying selection in the adult should har-bor lower levels of aneuploidy. To test this prediction, we sequenced single cells from tissues that self-renew in adult Bub1bH/H mice (peripheral blood cells,
keratino-cytes, and intestinal crypt cells) and compared the observed degree of autosomal aneuploidy with that of tis-sues that divide primarily during embryogenesis (the liver and brain). The liver and brain are formed during embryo-genesis, and hepatocytes and neurons are largely nonpro-liferative in the adult (Zimmermann 2004; Campisi and d’Adda di Fagagna 2007). Our previous studies showed that aneuploid cells were prevalent in the livers (18.8%) and brains (38.1%) of 8- and 12-wk-old Bub1bH/Hanimals,
respectively (Knouse et al. 2014). Sequencing four addi-tional hepatocytes from a 30-wk-old Bub1bH/H mouse
and four additional neurons from a 28-wk-old Bub1bH/H
mouse estimated the levels of aneuploidy to be 14.3% and 40%, respectively (Fig. 6B;Supplemental Fig. S9D,E). Both BM-HSCs and peripheral white blood cells obtained from the same 19-wk-old Bub1bH/H mouse
exhibited 0% and 4.3% aneuploidy, respectively (n = 19 and 23 cells sequenced) (Fig. 6B; Supplemental Figs. S7D, S9A). A previous study reported higher levels of aneuploidy in splenocytes of 3- and 5-mo-old Bub1bH/H
animals (9% and 15%) (Baker et al. 2004). However, meta-phase spreads, which tend to overestimate aneuploidy (Knouse et al. 2014), were used to evaluate cell karyotype in this study. It is also possible that aneuploid blood cells have a higher survival rate in the spleen than in the bone marrow or peripheral blood. Keratinocytes and intestinal cells enriched for crypts also showed low levels of aneu-ploidy: 4.3% of keratinocytes isolated from a 15-wk-old Bub1bH/Hmouse were aneuploid (n = 23 cells sequenced)
(Fig. 6B;Supplemental Fig. S9B), and 4.8% aneuploidy was observed in intestinal crypt cells from an 18-wk-old mouse and a 30-wk-old Bub1bH/Hmouse (n = 18 and 3 cells sequenced, respectively) (Fig. 6B;Supplemental Fig. S9C). We conclude that tissues that regenerate during adulthood harbor lower levels of aneuploidy than tissues that proliferate predominantly during embryogenesis.
A direct comparison of the degree of aneuploidy between adult tissues further revealed that adult nonpro-liferative tissues (the brain and the liver) are more tolerant of aneuploidy than self-renewing adult tissues (peripheral blood, BM-HSCs, skin, and intestines) and blood cells
derived from fetal liver or bone marrow transfers (Fig. 6C). Further analyses of specific chromosome gains and losses revealed that nonproliferative tissues (the brain and the liver) harbored cells with more complex aneuploi-dies than cells from Bub1bH/HHSC recipients (Fig. 6D–F; Supplemental Fig. S10). Of the three aneuploid cells observed in tissues that regenerate in the adult, two har-bored a single chromosome gain, and one harhar-bored a single chromosome loss (Supplemental Fig. S9). Thus, we con-clude that aneuploidy is selected against in tissues that regenerate in the adult.
Discussion
Here we describe a system that has permitted direct com-parison of aneuploid mammalian cell fitness with the fitness of isogenic euploid cells in vivo. We found that constitutional trisomy and aneuploidy resulting from CIN negatively affect HSC fitness. Furthermore, we obtained evidence that aneuploidy is selected against in adult regenerating tissues. These findings greatly inform our understanding of the role of aneuploidy in cancer and aging.
The effects of aneuploidy and CIN on HSC fitness and hematopoiesis
The hematopoietic reconstitution system that we devel-oped here has allowed us to investigate whether aneu-ploidy provides a proliferative advantage to cells. Our findings demonstrate that both constitutional trisomy and aneuploidy generated by CIN adversely affect the fit-ness of HSCs in vivo. Defects specific to certain aneuploi-dies as well as defects observed in all aneuploid strains analyzed were evident in our aneuploid HSCs. The line-age-specific defects such as reduced B-cell number observed in trisomy 16 FL-HSC reconstitutions are likely due to chromosome-specific effects, as B-cell differentia-tion defects have also been observed in DS (Roy et al. 2012; Lane et al. 2014). Furthermore, we observed decreased proliferative potential in all aneuploidy models that we examined. Trisomy 16 FL-HSCs are much less fit than euploid HSCs and show phenotypes characteristic of proliferation defects when challenged to reconstitute irra-diated euploid recipients. Trisomy 19 and Bub1bH/H
HSCs exhibit less severe fitness defects, indicating that lower levels of aneuploidy are better tolerated in the hem-atopoietic lineage. Recent studies have shown that mur-ine HSCs divide very infrequently and use numerous, more differentiated progenitor cells to sustain long-term hematopoiesis (Busch et al. 2015; Sun et al. 2015). This provides a potential explanation of why repeated chal-lenges are needed to reveal the fitness defects of aneu-ploidy in Bub1bH/HHSCs. In the Bub1bH/HHSC pool,
only a subpopulation of cells is likely aneuploid, and selec-tion for euploid cells likely occurs given that we did not observe aneuploidy in Bub1bH/H HSCs. In the same
vein, a proliferative defect in trisomy 19 HSCs began to emerge after tertiary bone marrow transfer and was
obvious only after quaternary transfer. Thus, in vivo anal-yses of primary aneuploid cells demonstrate that aneu-ploidy in the hematopoietic lineage reduces cellular fitness and proliferative capacity. While some aneuploi-dies, such as trisomy 19, are better tolerated than others, such as trisomy 16, reconstitutions with the Bub1bH/H
CIN model reveal that when euploid cells can be gener-ated, aneuploidy is selected against in the hematopoietic lineage.
How aneuploidy leads to reduced fitness in HSCs remains to be determined. Cell culture studies of yeast and mammalian cells have shown that the proteomic imbalances caused by aneuploidy lead to proteotoxic stress, metabolic alterations, increased reactive oxygen species (ROS) production, and cell cycle delays (Santa-guida and Amon 2015). These general characteristics of aneuploid cells likely contribute to the decreased prolifer-ative potential and eventual exhaustion of aneuploid HSCs that are observed.
While increased proliferation was not observed in trans-plantation of aneuploid HSCs alone, it will be interesting to determine whether particular aneuploidies can contrib-ute to tumorigenesis in specific oncogenic contexts or in conjunction with aneuploidy-tolerating mutations. For example, aneuploidy has been shown to increase tumor burden and decrease survival in animals lacking the tumor suppressor p53 (Li et al. 2010). Loss of p53 could permit the survival of cells with abnormal karyotypes and/or DNA damage that ensues when chromosomes are missegregated (Crasta et al. 2012), allowing for the selection of malignant karyotypes. Particular aneuploi-dies in conjunction with other specific genomic altera-tions could also facilitate the development of specific cancers. For example, analyses of individuals with DS demonstrate that trisomy 21 is sufficient to bias differen-tiation in the human fetal liver, leading to a relative expansion of myeloid cells (Chou et al. 2008; Tunstall-Pedoe et al. 2008). This bias can progress to a transient myeloproliferative disorder (TMD) (Gamis and Smith 2012) and eventually AML if a cooperating GATA1 muta-tion is also present (Hitzler 2003; Mundschau et al. 2003). Furthermore, trisomy 21 is also observed in non-DS hem-atologic cancers (Mitelman et al. 1990; Cheng et al. 2009). The model system that we developed here will permit effective molecular dissection of the effect of specific chromosomal abnormalities and the role of aneuploidy and CIN in general on the development of leukemias and lymphomas.
Aneuploidy is selected against in regenerating tissues Our finding that aneuploidy impairs rather than promotes proliferation in vivo is supported by our tissue analyses in Bub1bH/Hmice. Tissues that form largely during
embryo-genesis harbored high levels of aneuploid cells, whereas BM-HSCs and adult peripheral blood, skin, and intestinal crypt cells harbor few aneuploid cells. Importantly, we also found that FL-HSCs were euploid, suggesting that mechanisms that eliminate aneuploid cells are not unique to adult tissues. Rather, we favor the idea that the varying
degree of aneuploidy observed in different tissues reflects differences in the strength of purifying selection across tissues. During rapid population expansion, a“population flush” effect (Carson 1968) can occur in which genetically less-fit individuals are able to survive and contribute to the population in a more substantive manner. Once populations reach steady state, purifying selection forces are relatively stronger and select against the survival of less-fit individuals. Thus, tissues that form during embryogenesis, a period of rapid cell expansion, and are largely nonproliferative and not maintained by stem cells in the adult (brain and liver) harbor high levels of aneu-ploidy, whereas adult regenerating tissues (blood, skin, and the intestine) harbor few aneuploid cells. Our analysis of aneuploidy dynamics in Bub1bH/HHSC-derived blood
cells during hematopoietic reconstitution further indi-cates that the way in which tissues are generated and maintained determines the prevalence of aneuploidy in those tissues. Both BM-HSCs and FL-HSCs are euploid. However, when HSCs are challenged to rapidly expand to reconstitute an irradiated recipient, aneuploidy becomes more prevalent in the peripheral blood of primary recipi-ents during the early stages of hematopoietic recon-stitution. Aneuploidy levels then decline as the tissue reaches steady state.
A previous evaluation of aneuploidy in aged mice that harbored increased expression of the BUBR1 protein in all tissues throughout life found that cells that overex-press BUBR1 and additionally all wild-type aged adult stem cells show low levels of aneuploidy (Baker et al. 2012). We found that, even in a mutant in which the BUBR1 checkpoint protein is compromised, aneuploidy is selected against in tissues that are maintained by adult stem cells. Further investigation is needed to determine how aneuploid cells are culled in adult regenerating tis-sues. Previous cell culture studies have shown that chro-mosome missegregation leads to p53 activation (Li et al. 2010; Thompson and Compton 2010), raising the possibil-ity that aneuploid cells are culled in tissues through apop-tosis. We did not observe high levels of apoptosis in the skin or bone marrow of adult Bub1bH/Hmice by standard
assays (data not shown), suggesting that other mecha-nisms are responsible for eliminating aneuploid cells in adult regenerating tissues.
Aneuploidy and aging
Bub1bH/Hmice have a decreased life span and show a
number of progeroid phenotypes such as dwarfism, cata-racts, loss of subcutaneous fat, and impaired wound heal-ing (Baker et al. 2004). It has been proposed that these early aging phenotypes are caused by the progressive accumula-tion of aneuploid cells in these animals. However, our findings that serial bone marrow transfer leads to Bub1bH/H HSC exhaustion and that adult Bub1bH/H
regenerating tissues contain very few aneuploid cells sug-gest an alternative explanation. The decreased life span and early aging phenotypes exhibited by Bub1bH/Hmice
could be due to the exhaustion of adult stem cell pools that must proliferate more than wild-type stem cells to
produce euploid cells. It is also possible that the strength of purifying selection in adult regenerative tissues is relaxed as organisms age and stem cell fitness declines (Rozhok and DeGregori 2015). Such decreased purifying selection would cause tissue function decline due to the accumulation of aneuploid and hence less-fit cells with time. Consistent with this idea is the observation that life span extension can be achieved in Bub1bH/H mice
when senescing, and thus presumably aneuploid cells are induced to undergo apoptosis (Baker et al. 2011). Fur-ther investigation is needed to determine wheFur-ther decreased purifying selection can also cause the accumu-lation of cells that are genetically unstable and karyotypi-cally abnormal (Sheltzer et al. 2011; Zhu et al. 2012; Nicholson et al. 2015), since such a population from which rare cells with high proliferative and hence tumori-genic potential may arise could cause cancer as individu-als age.
Materials and methods Mouse strains
The mouse strains used previously (Williams et al. 2008) were backcrossed for at least 10 generations into the C57BL/6J back-ground (Jackson Laboratory) to generate congenic strains. Strains used to generate trisomic embryos were B6.Cg-Rb(6.16)24Lub/ JAmonJ or B6.Cg-Rb(13.16)1Mpl/JAmonJ and B6.Cg-Rb(16.17) 7Bnr/JAmonJ (trisomy 16) and B6.Cg-Rb(5.19)1Wh/JAmonJ and B6Ei.Cg-Rb(9.19)163H/J (trisomy 19). All male compound hetero-zygous mice were mated with C57BL/6J females to generate triso-mic embryos, although at a lower frequency than previously reported, most likely due to backcrossing (Pfau and Amon 2016). Bub1bH/Hmice were a generous gift from Dr. J.M. van
Deursen. Embryos from all strains were collected at E14.5– E15.5 by timed matings. Recipient mice were 6- to 8-wk-old B6. SJL-PtprcaPepcb/BoyJ (CD45.1) female mice from Jackson
Labo-ratory. Fetal livers were prepared and karyotyped as described in theSupplemental Material. All animal studies and procedures were approved by the Massachusetts Institute of Technology Institutional Animal Care and Use Committee.
Hematopoietic reconstitutions
For all reconstitution experiments, mice were closely monitored for signs of bone marrow failure and rapid weight loss. All proto-cols for treating irradiated mice were outlined by the Massachu-setts Institute of Technology’s Division of Comparative Medicine. Whole-body irradiation was performed using a 137Cs
irradiator (γ cell 40) at a dose rate of ∼100 cGy/min.
For competitive reconstitution assays and hematopoietic recon-stitution experiments, recipient mice were irradiated with a 12-Gy total dose administered as a split dose of 8 12-Gy followed by a sec-ond dose of 4 Gy 3 h later. Fetal liver cells were thawed in Iscove’s modified Dulbecco’s medium (IMDM) supplemented with 2% FBS and counted on a Cellometer Auto T4 automated hemacy-tometer (Nexelcom). Viability was assessed by propidium iodide exclusion using a FACSCalibur flow cytometer (Becton Dickin-son). Live cells (106cells) were injected intravenously in Hank’s
balanced salt solution (HBSS). In one replicate of the trisomy 16 competition assay (n = 5 trisomy 16; n = 7 wild type), CD45.2/ CD45.1 aneuploid donors and CD45.2 common wild-type donors were transferred into CD45.1 irradiated recipient mice.
Recipient mice for CFU-S assays were irradiated with 9.5 Gy administered as a single dose. Fetal liver cells were then prepared, and 106live cells were injected as described above. Seven days to 8 d after injection, spleens were harvested from recipients and then fixed overnight in Bouin’s fixative. Spleens were sectioned into 5-μm slices and stained with hematoxylin and eosin. Slides were then scanned on a Leica Aperio slide scanner, and colony area was measured using ImageJ. To control for small residual white blood cell nodules in the spleen, sections of spleens from irradi-ated mice that were not transferred with cells were also analyzed. We determined the average background colony size to be 0.336% of the total spleen area, and colonies larger than this average were considered CFU-S colonies.
Homing assays were performed as described (Gilbert and Hemann 2012) and are detailed in theSupplemental Material.
For EdU incorporation assays, recipient mice were irradiated with 9.5 Gy, administered as a single dose. Fetal liver cells were thawed, and viability was determined by propidium iodide exclu-sion as described above. Live fetal liver cells (106 cells) were injected intravenously in HBSS. Six days later, mice were injected intraperitoneally with 1.25 mg of EdU in PBS. Twenty hours after EdU injection, recipient mice were euthanized. Bone marrow was harvested by flushing the long bones 24 h after injec-tion. Red blood cells were lysed in ACK lysing buffer, and samples were washed in IMDM containing 2% FBS. EdU incorporation was detected using the Click-iT plus EdU Alexa fluor 488 flow cytometry kit (Thermo-Fisher) on an LSR II flow cytometer (Bec-ton Dickinson). EdU-positive recipient-derived bone marrow cells were excluded using a CD45.1 antibody conjugated to PE (BioLegend; clone A20).
Recipient mice for bone marrow transfers were irradiated with 9.5 Gy, administered as a single dose. Bone marrow cells were iso-lated, and red blood cells were lysed as described above. White blood cells were then counted, and recipient mice were reconsti-tuted by intravenous injection of 106cells in HBSS.
Peripheral blood analysis
For complete blood cell counts, peripheral blood was collected with heparinized capillary tubes into EDTA-coated Microvette 100 tubes (Sarstedt) and analyzed on a HemaVet 950FS (Drew Sci-entific). Peripheral blood for flow cytometry analysis was col-lected with heparinized capillary tubes into sodium heparin diluted in PBS. Red blood cells were lysed in ACK lysing buffer and washed in HBSS containing 2% FBS. Cells were then incu-bated with antibodies according to the manufacturer’s specifica-tions and analyzed with a FACSCalibur or LSR II flow cytometer (Becton Dickinson). The following antibodies were used and obtained from BioLegend: CD45.1 (A20), CD45.2 (104), CD45R/B220 (RA3-6B2), and CD90.2/Thy-1.2 (53-2.1).
HSC quantification
Fetal livers and bone marrow cells were harvested, genotyped or karyotyped, processed, and counted as described above for hema-topoietic reconstitutions. FL-HSCs were quantified using markers described previously (Kim et al. 2006). BM-HSCs were quantified as described previously (Kiel et al. 2005). More detailed procedures are included in theSupplemental Material. The fol-lowing antibodies were used and obtained from BioLegend: CD150 (TC15-12F12.2), CD48 (HM48-1), Sca-1 (E13-161.7), CD117 (2B8). The following antibodies were used in a lineage cocktail for fetal liver cells and were obtained from BioLegend: CD3ε (145-2C11), Ly-6G/Ly-6C (Gr-1) (RB6-8C5), B220/CD45R (RA3-6B2), Ter-119, CD5 (53-7.3), and CD8a (53-6.7).
Single-cell sequencing and trisomy 19 sequencing
Single-cell sequencing was performed and analyzed as described in Knouse et al. (2014). Single-cell isolation protocols for each cell type are described in detail in theSupplemental Material. CD45.2 trisomy 19 peripheral blood was prepared as above for other blood cells and sorted on a FACSAria (Becton Dickinson). Genomic DNA was isolated from collected cells using the DNeasy blood and tissue kit (Qiagen), amplified with Genome-Plex Complete WGA kit (Sigma-Aldrich), and sequenced and ana-lyzed in the same way as amplified single cells. The sequences reported in this study have been deposited in the National Center for Biotechnology Information Sequence Read Archive (accession no. SRP075831).
Acknowledgments
We thank the Swanson Biotechnology Center at the Koch Institute for Integrative Cancer Research; Paul Danielian and Christian Pallasch for advice and technical assistance; the Massa-chusetts Institute of Technology Division of Comparative Medi-cine diagnostic laboratory for technical assistance; Jie Wu for help with bioinformatics analysis; Jan van Deursen for generously pro-viding the Bub1bH/H mouse strain; David Housman, Michael
Hemann, James DeGregori, Andrii Rozhok, Jianzhu Chen, and Ömer Yilmaz for discussions and advice; and Jianzhu Chen, Ömer Yilmaz, and members of the Amon laboratory for critical reading of this manuscript. This work was supported by the National Institutes of Health (CA206157) to A.A., and the Kathy and Curt Marble Cancer Research Fund and in part by Koch Insti-tute Support Grant P30-CA14051. S.J.P. is supported by a National Science Foundation Graduate Research Fellowship, and K.A.K. is supported by the National Institute of General Med-ical Sciences Training Grant T32GM007753. A.A. is an investiga-tor of the Howard Hughes Medical Institute and the Glenn Foundation for Biomedical Research.
References
Adorno M, Sikandar S, Mitra SS, Kuo A, Di Robilant BN, Haro-Acosta V, Ouadah Y, Quarta M, Rodriguez J, Qian D, et al. 2013. Usp16 contributes to somatic stem-cell defects in Down’s syndrome. Nature 501: 380–384.
Babu J, Jeganathan K, Baker D, Wu X, Kang-Decker N, van Deursen J. 2003. Rae1 is an essential mitotic checkpoint reg-ulator that cooperates with Bub3 to prevent chromosome mis-segregation. J Cell Biol 160: 341–353.
Baker DJ, Jeganathan KB, Cameron JD, Thompson M, Juneja S, Kopecka A, Kumar R, Jenkins RB, de Groen PC, Roche P, et al. 2004. BubR1 insufficiency causes early onset of aging-associated phenotypes and infertility in mice. Nat Genet 36: 744–749.
Baker DJ, Wijshake T, Tchkonia T, LeBrasseur NK, Childs BG, van de Sluis B, Kirkland JL, van Deursen JM. 2011. Clearance of p16Ink4a-positive senescent cells delays ageing-associated disorders. Nature 479: 232–236.
Baker DJ, Dawlaty MM, Wijshake T, Jeganathan KB, Malureanu L, van Ree JH, Crespo-Diaz R, Reyes S, Seaburg L, Shapiro V, et al. 2012. Increased expression of BubR1 protects against aneuploidy and cancer and extends healthy lifespan. Nat Cell Biol14: 1–9.
Boveri T. 1914. Zur frage der entstehung maligner tumoren. Gus-tav Fischer, Jena, Germany.
Busch K, Klapproth K, Barile M, Flossdorf M, Holland-Letz T, Schlenner SM, Reth M, Höfer T, Rodewald H-R. 2015.
Funda-mental properties of unperturbed haematopoiesis from stem cells in vivo. Nature 518: 542–546.
Campisi J, d’Adda di Fagagna F. 2007. Cellular senescence: when bad things happen to good cells. Nat Rev Mol Cell Biol 8: 729–740.
Carson HL. 1968. The population flush and its genetic conse-quences. In Population biology and evolution (ed. Lewon-tin RC), pp. 123–137. Syracuse University Press, Syracuse, NY.
Cheng Y, Wang H, Wang H, Chen Z, Jin J. 2009. Trisomy 21 in patients with acute leukemia. Am J Hematol 84: 193–194. Choi JK. 2008. Hematopoietic disorders in Down syndrome. Int J
Clin Exp Pathol1: 387–395.
Chou ST, Opalinska JB, Yao Y, Fernandes MA, Kalota A, Brooks JSJ, Choi JK, Gewirtz AM, Danet-Desnoyers G-A, Nemiroff RL, et al. 2008. Trisomy 21 enhances human fetal erythro-megakaryocytic development. Blood 112: 4503–4506. Crasta K, Ganem NJ, Dagher R, Lantermann AB, Ivanova EV, Pan
Y, Nezi L, Protopopov A, Chowdhury D, Pellman D. 2012. DNA breaks and chromosome pulverization from errors in mitosis. Nature 482: 53–58.
Davoli T, Xu AW, Mengwasser KE, Sack LM, Yoon JC, Park PJ, Elledge SJ. 2013. Cumulative haploinsufficiency and triplo-sensitivity drive aneuploidy patterns and shape the cancer genome. Cell 155: 948–962.
Ema H, Nakauchi H. 2000. Expansion of hematopoietic stem cells in the developing liver of a mouse embryo. Blood 95: 2284–2288.
Frasca D, Guidi F, Arbitrio M, Pioli C, Poccia F, Cicconi R, Doria G. 2000. Hematopoietic reconstitution after lethal irradiation and bone marrow transplantation: effects of different hemato-poietic cytokines on the recovery of thymus, spleen and blood cells. Bone Marrow Transplant 25: 427–433.
Gamis AS, Smith FO. 2012. Transient myeloproliferative disorder in children with Down syndrome: clarity to this enigmatic disorder. Br J Haematol 159: 277–287.
Gilbert LA, Hemann MT. 2012. Context-specific roles for para-crine IL-6 in lymphomagenesis. Genes Dev 26: 1758–1768. Gogendeau D, Siudeja K, Gambarotto D, Pennetier C, Bardin AJ,
Basto R. 2015. Aneuploidy causes premature differentiation of neural and intestinal stem cells. Nat Commun 6: 8894. Gropp A, Winking H, Herbst EW, Claussen CP. 1983. Murine
tris-omy: developmental profiles of the embryo, and isolation of trisomic cellular systems. J Exp Zool 228: 253–269.
Harrison DE, Astle CM. 1982. Loss of stem cell repopulating abil-ity upon transplantation. Effects of donor age, cell number, and transplantation procedure. J Exp Med 156: 1767–1779. Harrison DE, Zhong RK, Jordan CT, Lemischka IR, Astle CM.
1997. Relative to adult marrow, fetal liver repopulates nearly five times more effectively long-term than short-term. Exp Hematol25: 293–297.
Henry E, Walker D, Wiedmeier SE, Christensen RD. 2007. Hem-atological abnormalities during the first week of life among neonates with Down syndrome: data from a multihospital healthcare system. Am J Med Genet 143A: 42–50.
Herbst EW, Winking H. 1991. Adoptive transfer of the hemato-poietic system of trisomic mice with limited life span: stem cells from six different trisomies are capable of survival. Dev Genet12: 415–422.
Hitzler JK. 2003. GATA1 mutations in transient leukemia and acute megakaryoblastic leukemia of Down syndrome. Blood 101: 4301–4304.
Jeganathan K, Malureanu L, Baker DJ, Abraham SC, van Deursen JM. 2007. Bub1 mediates cell death in response to