HAL Id: hal-01717492
https://hal.archives-ouvertes.fr/hal-01717492
Submitted on 6 Nov 2019
HAL is a multi-disciplinary open access
archive for the deposit and dissemination of
sci-entific research documents, whether they are
pub-lished or not. The documents may come from
teaching and research institutions in France or
abroad, or from public or private research centers.
L’archive ouverte pluridisciplinaire HAL, est
destinée au dépôt et à la diffusion de documents
scientifiques de niveau recherche, publiés ou non,
émanant des établissements d’enseignement et de
recherche français ou étrangers, des laboratoires
publics ou privés.
Derivation of supersaturation during precipitation from
the mixing pattern of an inert tracer in the same device:
case of partially premixed feed streams
R David, A Fall, Olivier Lecoq
To cite this version:
R David, A Fall, Olivier Lecoq. Derivation of supersaturation during precipitation from the mixing
pattern of an inert tracer in the same device: case of partially premixed feed streams. Chemical
Engineering Science, Elsevier, 2003, 58 (22), pp.5079-5085. �10.1016/j.ces.2003.07.013�. �hal-01717492�
Derivation of supersaturation during precipitation from the
mixing pattern of an inert tracer in the same device: case of partially
premixed feed streams
Ren David
∗, Ahmed Fall, Olivier Lecoq
Laboratoire de G nie des Proc d s des Solides Divis s, EMAC-CNRS, 81013 Albi Cedex 9, France
Abstract
The average supersaturation !eld is predicted for precipitations in the case of partially premixed feed streams by a simple mixing model from a couple of successive experiments with the same inert tracer by Planar Laser Induced Fluorescence and using a single camera. Then, the mathematical derivation is di"erent from that one used for the unmixed feed case. The corresponding experiments have been achieved in a 90◦impinging jets premixer and the supersaturation !eld was predicted. Due to the non-simultaneity of tracer experiments, a calculation of the averaged nucleation #ux is not possible in the premixed feed case. Nevertheless, a comparison between di"erent premixers can be done on the basis of the generated supersaturation levels and fouling risks.
Keywords: Mixing; Precipitation; PLIF; Nucleation; Tracer; Supersaturation
1. Introduction
Basically, precipitation is a chemical reaction between A and B, yielding a non-soluble particulate precipitate S: nA + mB → S (solid); (1) where n and m generally lie between 1 and 3.
Precipitation encompasses the so-called primary nucle-ation step, which generates the nuclei from the liquid phase and further steps forming the particle like growth, agglom-eration, breakage or secondary nucleation, which generates additional nuclei from existing particles. Precipitations are generally characterized by small particles and short to medium precipitation times (Mersmann, 2001). Accord-ing to the length and time scales de!ned by Villermaux and David (1988), this corresponds to high nucleation and medium growth rates.
Premixing is supposed to generate higher local supersat-uration consecutive to contacting between highly concen-trated fresh reagents from the feed streams. Thus, higher nucleation rates and in turn smaller particles are produced
∗Corresponding author. Tel.: +33-563493236; fax: +33-563-49-3025. E-mail address:rdavid@enstimac.fr(R. David).
(see for instance the pioneering work of Tosun (1988)).
Baldyga, Podgorska, and Pohorecki (1995)andBaldyga and Bourne (1999) presented several mixing models for pre-cipitations in tubes and stirred tanks with partial premixing based on a complete description of the mixing process. The !t with the corresponding experimental results on barium sulphate was generally fair and the in#uence of operating parameters correctly predicted, but their velocity and con-centration !elds were computed. Therefore, their models are relatively expensive in both computation time and e"ort.
Zauner and Jones (2002)tried an other approach by using the segregated feed model (SFM) of Villermaux (1989), where the entering #uids undergo macro- and meso-mixing together and with the rest of the tank bulk, applied to double jet semi-batch precipitation of calcium oxalate.
In recent papers, a simulation of the initial mixing of two separated feed jets of reactive solutions in virtual ionic pre-cipitation was presented (Fall, Lecoq, & David, 2002;David, Fall, & Lecoq, 2003). The mixed volume was split into #uid fractions originating from the jet and from the bulk. The paper demonstrates the possibility to predict the supersatu-ration and the nucleation #ux !elds in a mixed precipitator from concentration measurements of an inert tracer in the same precipitator geometry. One may try to implement the same procedure described inDavid et al. (2003)in the case
of partially premixed feed streams. However, impossibil-ity arises when doing so because the procedure requires the identi!cation in the mixing plume of the molecules coming from every feed stream and from the rest of the tank: in other words, a given tracer concentration can be achieved by di"erent combinations of portions of #uids coming from these three environments.
Fox (1998) did a somewhat similar approach of #uid mixing relying on the general mixing model (GMM), in-troduced byVillermaux and Falk (1994). He distinguished 4 di"erent modes respectively (feed 1, feed 2 and two lev-els of mixed bulk). Each spatial point is characterized by a probability to be in one of these modes.Piton, Fox, and Marcant (2000)applied it to the precipitation of barium sul-phate in a tubular precipitator. As they intended to calculate the concentration of species and the complete crystal size distributions of the precipitate, they took also nucleation and growth rates into account.Marchisio, Barresi, and Garbero (2002)simpli!ed it to three modes (feed 1, feed 2 and one single mixed bulk) and calculated the moments of the CSD taking into account the presence of agglomeration. Never-theless, their model and calculations are rather di$cult to handle.
The present paper introduces a mixing model in the case of partially premixed feed streams, in order to keep the simplicity of our previous approach and to over-come the di$culty of dealing with three origins of #uids (or modes).
2. Experimental apparatus
The planar laser induced #uorescence (PLIF) Tech-nique and the experimental apparatus used in this work are described and available in Fall, Lecoq, and David (2001). The mixing device, which is tested here, is a standard tank equipped with a Rushton turbine and two 90◦-impinging jets mixer. Mahajan and Kirwan (1996)
andBenet, Muhr, Plasari, and Rousseaux (2002)have ex-tensively studied such impinging mixers. However, both groups of authors used an angle equal to or close to 180◦
between the jets (opposite jets). During tracer experi-ments, the impinging jet mixer feeds fresh tracer solution and pure solvent. The feed point locations are shown in Fig.1. The stirring speed is N = 3 s−1 and the #ow rates
QL= QR= 1:35 dm3 min−1.
3. Model
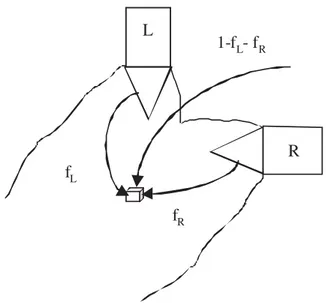
Imagine the situation depicted by Fig.2, where the two feed stream jets are partially premixed (90◦-impinging jets).
It would be interesting to predict the supersaturation !eld from inert tracer concentration measurements in the same device. dH=53 mm dV =14 mm 10 4 mm 25 mm 30 mm R L 30 mm
•
•
•
48 mm StirrerFig. 1. Experimental set-up. Left: relative position of fed streams L and R; right: view from above; locations of both feed streams with respect to the stirrer.
L
R
f
Lf
R1-f
L- f
RFig. 2. Partially premixed feed streams model.
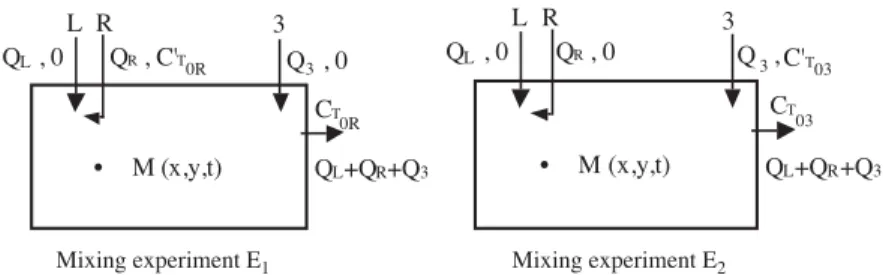
Let us consider two mixing experiments with tracers, which denote E1 and E2 (Fig.3). In E1, the inert tracer is
injected in the right feed streams with #ow rate QR. A third
inlet feed stream with #ow rate Q3 is located far from the
two others. The mixing zone of both fresh #uid feed streams is described by two fractions fR and fL, which we denote
the #uid fractions at point (x; y; z) and time t, and which originate from feed tubes R and L, respectively. Each ele-mentary volume of this zone is made of fractions fR and
fLof incompressible #uid coming from the incoming feed
streams and of the complementary fraction 1 − fL− fR,
coming from the bulk where uniform concentration CT0 is
assumed. Note that experiments E1and E2can be performed
at di"erent times with the same or di"erent tracers, provided that the linearity of signal against tracer concentration is veri!ed.
M (x,y,t) QL , 0 L 3 CT0R • R QR , QL+QR+Q3 Q3 , 0 C'T0R M (x,y,t) QL , 0 L 3 CT 03 • R QR , 0 QL+QR+Q3 C'T03 Q3 ,
Mixing experiment E1 Mixing experiment E2
Fig. 3. Mixing of two partially premixed jets of inert tracers.
The relation between the inlet and outlet concentration can be written C′ T0R= CT0R ! 1 +QL QR + Q3 QR " = CT0R ! 1 +1 + v3 v " ; (2) C′ T03= CT03 ! 1 + QR Q3 + QL Q3 " = CT03 ! 1 +1 + v v3 " (3) with v = QR=QL and v3= Q3=QL: (4)
At a given point M, if we could monitor CTR and CT 3
si-multaneously, we could write
CTR= (1 − fL− fR)CT0R+ CT′0RfR; (5) CT 3= (1 − fL− fR)CT03 (6) which yields CTR CT0R = XTR= 1 − fL+ !1 + v 3 v " fR (7) and CT 3 CT03 = XT 3= 1 − fL− fR: (8)
When fL and fR are substituted in the above equation, we
obtained
fR=1 + (1 + vXTR− XT 3
3)=v; (9)
fL= 1 −XTR1 + ((1 + v+ ((1 + v3)=v)XT 3
3)=v) : (10)
Let us consider now a virtual reactive experiment, which we denote E3 and corresponding to real ionic precipitation
(Fig.4).
The simpli!ed reaction scheme is given by A + B → S with m = n= 1:
At the same point (x; y; z) in the tank we assume that there is no change in hydrodynamics between experiments E1, E2
and E3. If we had performed E3 instead of E1, E2, at the
same time and location, the concentrations of reagents A
M (x,y,t) L 3 • R QR , QL+QR+Q3 Q3 , 0 C'A0 QL , C'B0 CA , CB
Virtual mixing experiment E3
Fig. 4. Mixing of two partially premixed jets of reactants.
and B would be respectively
CA= (1 − fL− fR) %CA+ CA0′ fR; (11)
CB= (1 − fL− fR) %CB+ CB0′ fL: (12)
The relative supersaturation is de!ned by S = CACB=Ps− 1
(for m = n= 1), and is expressed by S = (1 − fR− fL)2 % CAC%B Ps − 1 +CA0′ C%B Ps (fR− f 2 R− fRfL) +CB0′ C%A Ps (fL− f 2 L− fRfL) + fRfLC ′ A0CB0′ Ps : (13) If feed is stoichiometric % CA= %CB and C ′ B0 C′ A0 =QR QL = v: (14)
Then the supersaturation becomes S =C%AC%B Ps (1 + f 2 R+ fL2− 2fR− 2fL− 2fRfL) − 1 +CA0′ CA Ps (fR− f 2 R− fRfL+ vfL− vf2L− vfRfL) +CA0′2 Ps vfLfR: (15)
We have chosen QL= QR (v = 1) and the feed stream Q3
is very low compared to the others (v3= 0)—but the tracer
solution remains concentrated in order to be detectable—, Eqs. (9) and (10) are considerably simpli!ed
fR=XTR− X2 T 3; (16) fL= 1 − !X TR+ XT 3 2 " : (17)
Assuming %CAand %CBto be close to equilibrium in the bulk
of the tank (see David et al., 2003), the supersaturation de!ned by Eq. (13) becomes
S = (−1 − 2XTR+ 2XT 3+ XTR2 ) + C′ A0 √Ps(XT 3− X 2 T 3) +CA0′2 Ps !X TR− XT 3 2 + X2 T 3− XTR2 4 " : (18)
Taking into account C′
A0 ≫ √Ps, we can neglect the !rst
term of Eq. (18).
And, !nally, the supersaturation is expressed by S = CA0′ √Ps (XT 3− XT 32) +CA0′2 2Ps ! XTR− XT 3+X 2 T 3− XTR2 2 " : (19)
The !rst term of the right-hand side of Eq. (19) corresponds to the contribution of the mixing between fresh #uids and the bulk, whereas the second one is related to the direct mixing of the entering fresh #uids. From the instantaneous super-saturation, it is easy to derive the average supersaturation by
%S = CA0′ √Ps (XT 3− XT 32) +CA0′2 2Ps # XTR− XT 3+X 2 T 3− XTR2 2 $ : (20)
It is worthwhile noting that expression (20) contains no cross terms XTRXT 3. From Eqs. (9), (10) and (15), it can be
demonstrated that this holds if, in the general case (m=n=1) QR= QL+ Q3 i:e: v = 1 + v3: (21)
It is then possible to monitor and average XTRand XT 3
sep-arately for the calculation of %S by Eq. (20). The average su-persaturation can be reduced by Smax= CA0′2=4Ps. Smax
repre-sents the highest achievable value of %S when premixing both feed streams. Generally, the second term of the summation at the right hand side of Eq. (20) is larger than the !rst one, because of the experimentally high values of C′
A0=√Ps. If
no interaction would exist between the feed streams and the rest of the tank (pure premixing), XT 3 would be nil. Then
Eq. (20) reduces to %S = CA0′2 2Ps # XTR−X 2 TR 2 $ : (22)
The next step would consist of the calculation of the nu-cleation #uxes. Nunu-cleation rate, as well homogeneous as het-erogeneous nucleation, is generally expressed by theVolmer and Weber (1926)relationship:
RN= ANexp % −BN Log2 eS & : (23)
The average reduced nucleation #ux is expressed by RN AN = exp % −LogBN2 eS & =' 2 XTR=0 ' 2 XT 3=0 exp ! −BN Log2 eS(XTR; XT 3) " ×p(XTR; XT 3) dXT 3dXTR: (24)
However, the demonstration made above for the average su-persaturation cannot be applied to relation (24). Actually, the calculation of RN=ANimposes the knowledge of the
prob-ability p(XTR; XT 3) to have simultaneously the values XTR
and XT 3at the same point. This would require that XTR and
XT 3 are simultaneously measured at this point, and,
conse-quently, it would necessitate two di"erent tracers and two monitoring cameras.
4. Experimental results with an inert tracer
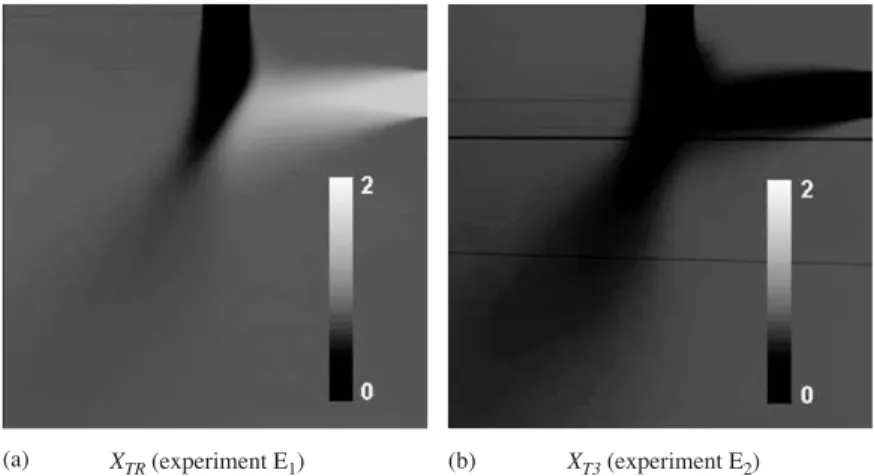
The average reduced concentration is shown in Fig.5for the 90◦-impinging jets mixing. In the Fig. 5(b), the two
perpendicular feed pipes contain pure water and the reduced tracer concentration is XT 3, whereas, in the Fig.5(a) one of
the two perpendiculars feed pipes contains the solution of inert tracer and the other one contains the pure water. In this case the reduced tracer concentration is XTR.
The reduced tracer concentration varies between 0 (black), in the pure water feed stream jets, to 2 (white), in the inert tracer feed stream jets. A pixel represents a square of an area about 70 × 70 !m2 in Figs.5(a and b).
5. The virtual experimental results with an in ionic precipitation
By applying Eq. (20) to the concentrations !elds result-ing from experiments E1and E2we can predict the average
supersaturation !eld for every pixel. The result is given in Fig.6. High local supersaturations induce high local nucle-ation rates (see Eq. (23)). However, when applying Eq. (24), one should remark that RN is a non-linear function of S and
thus
RN(S) ̸= RN( %S): (25)
A highly supersaturated zone appears in the mixing layer between the impinging jets with a maximum value of 0.72 for the reduced average supersaturation, which is relatively high with respect to the maximum value of 1. A more de-tailed analysis is made in Fig.7: The reduced
supersatura-XTR (experiment E1) XT3 (experiment E2)
(a) (b)
Fig. 5. Average reduced tracer concentrations: (a) the tracer is introduced in the right (horizontal) feed stream; (b) the tracer is introduced via feed 3.
Fig. 6. Average reduced supersaturation %S=Smax.
0 0.05 0.1 0.15 0.2 0.25 0.3 0 80 160 240 320 400 480 560 A1A2 B1B2 C1C2
Average reduced supersaturation
Pixels
Fig. 7. Pro!les of average reduced supersaturation %S=Smaxalong the lines A1A2, B1B2, C1C2 de!ned in Fig.6.
tion pro!les on straight lines A1A2, B1B2 and C1C2 are plotted. Zero supersaturations are observed in the core of the jets on each line. The mixing plume shows average val-ues about 0.05, while the highest peaks (up to 0.3 on line C1C2) are noticed in the central part of the mixing layer.
In this con!guration, the risk of fouling on the inlet tubes is low, because the highest supersaturations arise far from the tubes.
6. Discussion
The same discussion on time and space resolution as for unmixed feed streams (David et al., 2003) still applies. Dur-ing 35 ms exposure time, with an order of magnitude of the velocity of 0:1 m s−1as expected in the jets, an eddy moves
on about 50 pixels in the main #ow direction. Consequently, exposure times of each pixel under 1 ms are recommended. Even in this case, the spatial resolution will not be better than the size of one pixel, i.e. 70!m. A better resolution in exposure time of the tracer images would increase the av-eraged squared terms X2
TR and XT 32 in Eqs. (20) and (22).
Especially X2
TR would be modi!ed because XTR has a wider
range of variation than XT 3(see Fig.5). Thus the calculated
average supersaturation would be reduced.
As noted in the preceding paper (David et al., 2003), the apparent paradox is that the average supersaturations are decreasing functions of the variance !2
TR: %S = CA0′2 2Ps # XTR− XT 3+! 2 T 3+ XT 32− !TR2 − XTR2 2 $ : (26)
Again, Eq. (26) indicates that the highest average supersat-urations are obtained at locations where (a) XTR ̸= 2 and
XT 3̸= 0, or (b) both XTR and XT 3̸= 1 and (c) variance !2TR
is small (i.e. negligible #uctuations of tracer concentrations during experiment E1). Indeed, such locations are grossly
the same as those for non-zero variance, but the areas of maximum supersaturations di"er from those for maximum variances.
Generally, the goal of such premixing devices is to pro-duce very small particles. As a consequence of the threshold e"ect illustrated by Eqs. (23), (24), the actual supersatura-tion must be as high as possible in a wide premixing zone in order to maximize the nuclei production #ux. This is likely to occur when the average supersaturation is high over a large area. It is thus possible to detect premixing devices with a high ability to produce very small particles.
7. Conclusion
Averaged supersaturation !elds in partially premixed feed precipitators were predicted from tracer concentration im-ages obtained by PLIF by a simple mixing model. The method is based on the experimental monitoring of the same area during two successive experiments, where the tracer is injected via either one of the feed streams or a third addi-tional feed stream with very a low #ow rate. Thus, the most supersaturated regions could be determined for two feed streams impinging at 90◦. A quantitative comparison of
dif-ferent mixing devices is thus possible, provided that instan-taneous tracer concentration images are available. Zones or points with higher fouling risks can be foreseen, in order to avoid non-adapted geometries when performing precipita-tions with frequent occurrence of scaling.
However, due to the non-simultaneity of both records, the method was not able to also predict the averaged nucleation #ux as it was previously done in the case of unmixed feed precipitators. The simultaneous use of two di"erent tracers should make it possible to overcome this di$culty.
Other improvements of the method would consist of the reduction of exposure time in order to monitor faster #uc-tuations (i.e. smaller scales of mixing).
Notation
AN constant, Eq. (23), m−3s−1
BN constant, Eq. (23), dimensionless
C concentration, mol m−3
CA mixing concentration of reagent A in the
out-let, mol m−3
C′
A0 feed concentration of reagent A, mol m−3
CB mixing concentration of reagent B in the
out-let, mol m−3
C′
B0 feed concentration of reagent B, mol m−3
CT 0 mixing tracer concentration in the outlet,
mol m−3
C′
T 0 feed concentration of #uorescent tracer,
mol m−3
fL feed stream fraction coming from the left
in-let, dimensionless
fR feed stream fraction coming from the right
inlet, dimensionless
H height of the liquid in the tank, m N stirring speed, s−1
p joint probability density function, dimension-less
Ps solubility product, mol2m−6
Q feed #ow rate, dm3s−1
RN nucleation #ux, m−3s−1
S supersaturation, dimensionless Smax=C
′2 A0
4Ps maximum achievable value of %S,
dimension-less
T internal diameter of the tank, m v #ow rate ratio, dimensionless V volume, m3
XT reduced local concentration of the tracer,
di-mensionless Subscripts
3 third feed stream (in the bulk of the tank far away from the feed streams L and R) A reactant A B reactant B L left R right T #uorescent tracer Superscripts
m; n stoichiometric coe$cients, dimensionless
− time average
References
Baldyga, J., & Bourne, J. R. (1999). Turbulent mixing and chemical reactions (pp. 810–840). Chichester–New York–Weinheim–Brisbane– Singapore–Toronto: Wiley.
Baldyga, J., Podgorska, W., & Pohorecki, R. (1995). Mixing-precipitation model with application to double-feed semibatch precipitation. Chemical Engineering Science, 50(8), 1281–1300.
Benet, N., Muhr, H., Plasari, E., & Rousseaux, J. M. (2002). New technologies for the precipitation of solid particles with controlled properties. Powder Technology, 128(2–3), 93–98.
David, R., Fall, A., Lecoq, O. (2003). Derivation of supersaturation and nucleation #ux during precipitation from the mixing pattern of an inert tracer in the same device: Case of unmixed feed streams, Chemical Engineering Science, 58(13), 2883–2891.
Fall, A., Lecoq, O., & David, R. (2001). Characterization of mixing in a stirred tank by planar laser induced #uorescence (PLIF). Trans IchemE, 79(A), 876–882.
Fall, A., Lecoq, O., & David, R. (2002). Derivation of supersaturation and nucleation #ux in a stirred tank from tracer concentration measurements
by P.L.I.F. 15th international symposium on industrial crystallization, Sorrento, Italy.
Fox, R. O. (1998). On the relationship between Lagrangian micromixing models and computational #uid dynamics. Chemical Engineering Proceeding, 37(6), 521–535.
Mahajan, A., & Kirwan, D. J. (1996). Micromixing e"ects in a two-impinging jets precipitator. A.I.Ch.E. Journal, 42(7), 1801–1814. Marchisio, D. L., Barresi, A. A., & Garbero, M. (2002). Nucleation, growth and agglomeration in barium sulphate turbulent precipitation. A.I.Ch.E. Journal, 48(9), 2039–2050.
Mersmann, A. (2001). Crystallization technology handbook (2nd ed.) (pp. 45–79). New York: Marcel Dekker.
Piton, D., Fox, R. O., & Marcant, B. (2000). Simulation of !ne particle formation by precipitation using computational #uid dynamics. Canadian Journal of Chemical Engineering, 78, 983–993.
Tosun, G. (1988). E"ect of addition mode and intensity on particle size distribution in barium sulphate precipitation, Proceedings of the 6th European conference on mixing, Pavia, Italy (pp. 161–170). Villermaux, J. (1989). A simple model for partial segregation in a
semibatch reactor. AIChE annual meeting, San Francisco, paper 114a. Villermaux, J., & David, R. (1988). E"et du microm&elange sur la
pr&ecipitation. Journal de Chimie Physique, 85, 273–279.
Villermaux, J., & Falk, L. (1994). A generalized mixing model for initial contacting of reactive #uids. Chemical Engineering Science, 49, 5127–5140.
Volmer, M., & Weber, A. (1926). Keimbildung in 'ubers'attigten Gebilden. Zeitschrift fuer Physikalische Chemie, 119, 277–301.
Zauner, R., & Jones, A. G. (2002). On the in#uence of mixing on crystal precipitation processes—application of the segregated feed model. Chemical Engineering Science, 57, 821–831.