Copie Infothèque
Compensation and Benefits Policy Design and
Implementation – A Company’s Key To Success
Travail de Bachelor réalisé en vue de l’obtention du Bachelor HES par :
Déborah Isabelle MIR
Conseiller au travail de Bachelor : Philippe BUTTY, Professeur
Carouge, 16 juillet 2020
Haute École de Gestion de Genève (HEG-GE) Filière économie d’entreprise
Déclaration
Ce travail de Bachelor est réalisé dans le cadre de l’examen final de la Haute école de gestion de Genève, en vue de l’obtention du titre de Bachelor of Science en économie d’entreprise.
L’étudiant a envoyé ce document par email à l'adresse d'analyse remise par son conseiller au travail de Bachelor pour analyse par le logiciel de détection de plagiat URKUND. http://www.urkund.com/fr/student/392-urkund-faq
L’étudiant atteste avoir réalisé seul-e le présent travail, sans avoir utilisé des sources autres que celles citées dans la bibliographie
L’étudiant accepte, le cas échéant, la clause de confidentialité. L'utilisation des conclusions et recommandations formulées dans le travail de Bachelor, sans préjuger de leur valeur, n'engage ni la responsabilité de l'auteur, ni celle du conseiller au travail de Bachelor, du juré et de la HEG.
« J’atteste avoir réalisé seule le présent travail, sans avoir utilisé des sources autres que celles citées dans la bibliographie »
Fait à Carouge, le 16 juillet 2020 Déborah Isabelle Mir
Acknowledgements
The achievement of this thesis could not have been possible without the support, guidance and contribution of the people’s name mentioned below.
I express my gratitude to my advisor, Professor Philippe Butty for his valuable feedback and guidance throughout the completion of this undertaking.
I would like to thank deeply Mrs Madeleine Sindabahawe, Head, HR Switzerland & Global Reward, my current Manager, for her support and encouragement she gave me during these past months as well as Mr. Fabian Vidal, Expert Compensation & Benefits, my colleague, for the time devoted to our interview and for advising and guiding me in this domain which allowed me to achieve the final objectives of this thesis.
Finally, I thank my friends, relative and colleagues for their precious support and believing in the realization of this project.
Executive Summary
Compensation and Benefits (C&B) plays an important role in today’s competitive world whilst aspects relating to employee wellness are also being given increasing consideration by employers. Given the importance of this matter, this thesis explores the elements that need to be considered by Executive and Human Resources Management when designing an effective C&B policy.
When well designed, a C&B policy is a powerful tool used to attract, motivate and retain employees. The case of a fictitious company is presented to demonstrate the application of the theoretical aspects of C&B to a real-world scenario.
As a C&B policy is specific to each organization, it is important to consider, analyze and review all aspects which could have material influence. Some of these aspects are related to the company's DNA, workforce demographic, economic trends, exogenous factors like the current global health crisis (Covid-19) and peer group salary practices.
When defining the C&B policy, and in order to measure its effectiveness, a set of objectives must be clearly stated. Finally, detailed job descriptions, evaluations and market data such as salary, employee benefits and wellness will be needed to finalize its design.
The aforementioned process facilitates the implementation of an effective C&B policy. The result, as measured by certain key performance indicators and qualitative observations, is a net positive contribution to the company. Specifically, a decrease in sporadic sickness leave, delays and turnover as well as an increase in employee motivation, job applications from qualified external candidates and, perhaps most importantly, an improvement in the company’s net profit.
Table of content
Déclaration ... i
Acknowledgements ... ii
Executive Summary ... iii
List of tables ... vii
List of figures ... vii
1.
Introduction ... 1
2.
Compensation & Benefits throughout time ... 2
3.
A global overview ... 3
3.1 Compensation ... 4
3.1.1 Fixed Salary... 4
3.1.2 Variable Salary ... 4
3.1.3 Benefits ... 4
3.2 Total Rewards Policy ... 4
4.
Better Future SA ... 7
5.
Factors to consider when designing an effective C&B policy from a
CEO’s perspective ... 11
6.
Company’s DNA ... 12
7.
Aligning C&B with the company's environment ... 17
7.1 Internal environment ... 17
7.2 Economic trends... 18
7.3 Economic crisis ... 20
7.4 External pay competitiveness ... 20
8.
Defining the objectives of a C&B policy ... 21
8.1 Salary inequalities ... 21
9.
Developing an effective C&B policy ... 24
9.1 Restructuring ... 24
9.2 Salary structure ... 26
9.2.1 Job Analysis ... 26
9.2.2 Job Evaluation ... 26
9.3 Mercer Total Reward Survey (TRS) ... 28
9.3.1 Online Survey ... 28
9.3.1.1 Company Data ... 28
9.3.1.2 Incumbents ... 28
9.3.1.3 Long-term incentives plan ... 29
9.3.1.4 Short-term incentives ... 29
9.3.1.5 Benefits ... 29
9.3.1.6 Company cars ... 29
10.
Better Future’s C&B policy ... 30
10.1 Salary Structure ... 30
10.1.1 Short-term incentives ... 35
10.1.2 Long-term incentives ... 36
10.2 Benefits ... 36
11.
Budget Forecast and Monitoring ... 37
12.
Non-Financial Rewards ... 38
12.1 Employee Performance ... 38
12.2 Training & Development ... 38
12.3 Work-Life Effectiveness ... 39
13.
The results arising from the C&B policy ... 40
13.1 Turnover KPI ... 40
13.2 Net Profit KPI ... 41
13.3 Qualitative improvement ... 41
14.
Conclusion ... 42
Appendix 2: Life Cycle Chart ... 45
Appendix 3: C&B Manager’s Job Description ... 46
Appendix 4: Mercer’s Career Stream Definitions ... 47
List of tables
Table 1: Better Future’s Generations ... 9
Table 2 : Economic Trends 2019 ... 19
Table 3 : Better Future’s Turnover ... 23
Table 4 : Mercer’s International Position Evaluation ... 27
Table 5 : Mercer’s Position Class ... 27
Table 6 : Better Future’s Compensation Structure ... 30
Table 7 : Better Future’s Matrix ... 33
Table 8 : Better Future’s Target Bonus Scheme ... 35
Table 9 : Economic Trends 2020 ... 37
Table 10 : Better Future’s Action Plan 2019 ... 40
List of figures
Figure 1 : Elements of Compensation and Benefits ... 3Figure 2 : Elements of Total Rewards Policy ... 6
Figure 3 : Better Future’s Organizational Chart ... 8
Figure 4 : Better Future’s Age Pyramid ... 9
Figure 5 : Competitive Values Framework ... 14
Figure 6 : Better Future’s Culture ... 16
Figure 7 : Better Future’s New Organizational Chart ... 25
Figure 8 : Mercer’s Job Code for C&B Manager ... 29
Figure 9 : Better Future’s Salary Data 2019 ... 32
1.
Introduction
More than ever, companies are facing increasing challenges due in part to a rapidly changing economy and increased market competition. A key success factor, as highlighted in the current global pandemic (Covid-19), is organizational flexibility. Moreover, effective management and good governance will allow organizations to overcome some of these challenges. As human capital plays a central role in any organization, the implementation of a robust compensation and benefits (C&B) policy is key. Compensation refers to the financial remuneration that employees receive in exchange for their labor and can take different forms such as fixed or variable salaries, whereas benefits refer to the value provided to employees beyond compensation. With employee wellness becoming more important, organizations need to consider non-financial incentives which need to be put in place above and beyond compensation or benefits.
A well-designed C&B policy is a powerful tool used by Human Resources (HR) to attract, motivate and retain employees. Research show that compensation, benefits and wellness significantly influence employee effectiveness and thus the organization’s overall performance. According to Bhattacharyya (2009), “balancing the cost of compensation
and retaining employees has now become the most important priority for today’s organizations”. It is therefore crucial for companies to know how to attract the best talents,
keep those talents motivated, and above all, retain the best employees.
Given the importance of this matter, this thesis explores the elements that need to be considered by Executive and Human Resources Management when designing an effective C&B policy. A short summary on the evolution of C&B is provided, followed by an overview covering the structure and individual components related to C&B as well as wellness. The creation and implementation of a C&B policy is outlined for a fictitious company operating in the recycling industry in Switzerland with the aim of guiding readers through the process and apply theory to a real-world scenario which took place in 2019.
2.
Compensation & Benefits throughout time
Employee compensation has been used for over centuries to reward employees in exchange for labor and has evolved throughout time. One of the milestones in this domain was the work of Frederick Wilson Taylor1, also known as the father of scientific
management. Taylor’s scientific management concept was to link efficiency to performance and promoted the idea of “A fair day’s pay for a fair day’s work”. Workers would be paid based on their work efficiency and Taylor believed that this system would encourage people to work better. One of the most popular criticisms of Taylorism is the lack of attention to human needs and appreciation (Caldari 2007). With time, an organization’s approach to management started by integrating the needs of their employees. Maslow’s hierarchy of needs by Abraham Maslow2 notes that humans are
motivated by five categories of needs which are physiological, safety, social, esteem, and self-actualization3.
Another factor that characterizes the evolution of compensation happened during World War II, where salary and price controls prevented companies from remaining competitive in terms of employee pay. As a result, companies started offering benefits such as health allowance and attractive retirement plans to compensate for the stagnant salaries (DeRosa 2018).
The introduction of employee stock options is also one of the elements that has contributed to the development of compensation (Moehrle 2001). By the 1990s, financial markets had grown 15 times from their level of the early 1980s (Bachelder III 2014). As such, employee stock option programs had become one of the most popular tools used in recruitment and retention (Stanley 2018).
More recently, companies developed performance share plans, allowing participants to receive actual company shares in order to better align management interest with the company’s long-term objectives. This can be done by introducing and measuring key performance objectives which can include internal financial mid-term objectives and/or comparison with an external peer group. Final delivery of the company’s shares is contingent upon achievement of these mid-term’s measures and is an effective
1 American engineer, promoter of the Scientific Management (1856 - 1915) 2 American psychologist, father of humanistic psychology (1908 - 1970) 3 Appendix 1: Maslow’s pyramid of needs
mechanism to foster growth and success whilst aligning stakeholder interests (Vidal 2020)4.
3.
A global overview
In large companies, there is often a dedicated C&B function within the HR department. Thus, a C&B Manager will work closely with the Senior HR Manager as well as the finance department. As a C&B policy covers a multitude of elements, it needs to be tailored to each organization. However, below diagram presents the key elements that need to be considered and the different terms, though generic, are widely used in many types of organizations worldwide, including Switzerland.
Compensation & Benefits
Financial Rewards
Compensation
Fixed Salary Variable Salary
Base Salary Benefits Pension Health insurance/ allowance Gym membership Mobility car/ transportation allowance Mobile phones Short-Term Incentives Long-Term Incentives Bonus Commission Lump Sum Profit sharing Employee stock option Performance shares Meals Housing
3.1 Compensation
3.1.1 Fixed Salary
A fixed salary corresponds to the base salary which is a fixed amount paid to employees in exchange for their work. Base salary does not include benefits, bonuses or any other form of compensation. The base salary is established according to the skills required, represents the valuation of roles and responsibilities of the job within the market as well as markets scarcity.
3.1.2 Variable Salary
A variable salary is an amount paid to employees throughout the year which can be represented in two different forms:
Short-term incentives are used for short-term objectives (1 month to 1 year) and are aligned with individual and organization performance. Short-term incentives can take different forms such as bonuses, commissions, lump sum, etc.
Long-term incentives are used for long-term objectives (2 to 5 years) and are generally designed for Managers and/or Executives. Long-term incentives include profit-sharing which represents a percentage of the company's profits that is distributed or allocation of stock option where participants can buy several shares in the company at a fixed price. Executives may also receive actual shares for a performance share plan or a mix of actual shares and stock options.
3.1.3 Benefits
Benefits can be defined as any other additional value, other than base salary and variable salary. According to Ryzhova (2013) citing Armstrong (2012), benefits are an important element of compensation as it is “a strategic tool that helps strengthen employee value
proposition while helping to improve the image of an organization.” The types of benefits
offered by employers are varied and will depend on the organization. Benefits typically include an attractive pension scheme, health insurance subsidies, gym membership, mobility car/transportation allowance, mobile phones, meals and housing for example.
3.2 Total Rewards Policy
In light of the attention to employee wellness, it is no longer sufficient for organization to focus only on compensation and benefits. The inclusion of this additional factor is defined as having a Total Rewards Policy approach. A definition of such a model, as defined by WorldatWork, a leading Organization operating in the Total Rewards area, is as follows:
Compensation: Compensation paid to employees in exchange for their work. Compensation includes fixed and variable pay.
Benefits: The various programs that employers initiate for employees within the organization to supplement cash compensation. Different programs such as health insurance and pension allowance ensure the safety of employees and their families. Work-Life Effectiveness: A set of organizational programs and practices to support employees in their professional activities at work and at home.
Performance Management: Consider and align individual and group efforts that achieve business goals. This includes goal achievement, skill demonstration, feedback and, continuous improvement.
Talent Development: Provides employees with the necessary tools to perform in their skills in the short- and long-term career. Career opportunities to effectively deploy talented employees are supported by companies allowing them to provide their greatest value to the organization.
Recognition: The actions, efforts, behavior and performance of employees who support the organization's strategy will be recognized through programs that can be formal or informal.
Although this thesis focuses mainly on the implementation of a C&B policy, aspects of employee wellness will also be addressed. As employee wellness does not generally fall within the mandate of a C&B Manager, and for the sake of clarity, both aspects have been covered separately. The below diagram represents a Total Rewards policy:
Total Rewards
Financial Rewards
Compensation
Fixed Salary Variable Salary
Base Salary Benefits Pension Health insurance/ allowance Gym membership Mobility car/ transportation allowance Mobile phones Talent Development Short-Term Incentives Long-Term Incentives Bonus Commission Lump Sum Profit sharing Employee stock option Performance shares Meals Housing Non-Financial Rewards Performance Management Work-Life Effectiveness
Worldatwork, Total Rewards Model
4.
Better Future SA
As presented in the introduction, the implementation of a C&B policy for a fictitious company takes place in Switzerland and will be described below. Although fictitious, the information presented has been based on real case studies and my personal professional experience.
Better Future SA is a family run business based in Geneva and founded in 1999. The company specializes in the recycling of Polyethylene Terephthalate (PET) and operates across the French speaking part of Switzerland. The core activity is the recycling of used PET bottles, transformed into new PET bottles, which are later sold to their clients. Finally, the company’s mission statement aims to “Collect, revalue and make our customers happy!5”
The activities of Better Future SA cover four main functions. These functions are carried out by the below divisions:
• Division n°1 – Sorting Process • Division n°2 – Revalue Process
• Division n°3 – Melting & Molding Process • Division n°4 - Packaging & Delivery
In 2012, the Founders decided to recruit a Chief Executive Officer (CEO) to delegate some of the managerial responsibilities of the company. Since the recruitment, the Executive Committee is composed of the CEO and four divisional Directors. End of 2018, the company has over 250 employees and the organizational structure is highlighted below:
Figure 3 : Better Future’s Organizational Chart
CEO Senior HR Manager HR Business Partner Payroll Manager HR AssistantHealth & Safety Manager CFO Financial Controller Accountant Invoicing Accountant IT & ERP Manager Network Engineer IT Help Desk Coordinator Marketing Manager Marketing Analyst Customer Service Representative Senior Sales Manager Senior Sales Representative Purchasing Manager Purchasing Analyst Facility Manager Mechanics Maintenance Facility Operators Sorting Operations Director (Div. 1) Revalorize Operations Director (Div. 2) Grinding Team Leader
Foundry & Molding Operations Director (Div. 3) Foundry Team Leader Injection Molder Team Leader Storage & Product Director (Div. 4) Packaging Team Leader Receptionnist Recycling Truck Drivers Customer Delivery Drivers Labelling Team Leader Storage & Inventory Associates Recycling Operators Compressor Operators Conveyor Belt Operators Grinding Operators Purification Operators Recycling Team Leader Compressor Team Leader Conveyor Belt Team Leader Purification Team Leader Foundry Operators Injection Molder Operators Packaging Operators Labelling Operators Executive Assistant Adm inistra tive Pr o du ct ion Machine Techniciens Mechanical Engineers Machine Techniciens Mechanical Engineers Machine Techniciens Mechanical Engineers
Quality Control & Assurance Technicians
Quality Control & Assurance Technicians
Quality Control & Assurance Technicians Laboratory Chemists Laboratory Chemists Laboratory Chemists Continious Improvement Engineers Continious Improvement Engineers Continious Improvement Engineers CSR Manager
In order to highlight the challenges of workforce efficiency within Better Future SA, the demographic structure of the company's workforce has been identified as follows:
Figure 4 : Better Future’s Age Pyramid
The horizontal line shows the number of men (blue) and the number of women (green) within the company by age group from 25 to 65 years (vertical line).
Table 1: Better Future’s Generations
Baby Boomer 1946 – 1964 56 to 74 years old Generation X 1965 – 1982 38 to 55 years old Generation Y 1983 - 2001 19 to 37 years old F 18 41 31 M 43 67 53 Total 61 108 84 Total % 24.11% 42.69% 33.20% 0 13 9 14 9 16 10 13 6 0 0 -16 -19 -21 -15 -24 -22 -29 -17 0 -40 -30 -20 -10 0 10 20 20-24 25-29 30-34 35-39 40-44 45-49 50-54 55-59 60-65 66-70
Age Pyramid
M FAs of today, the company’s life cycle stage6 is between maturity and decline which is
reflected in the deteriorating business performance since several years. Evidence of this can be found in the persistent low profit margin relative to its competitors. Additionally, employee turnover has been high and business development, as measured by new client acquisition, has been stagnant.
In light of this weak performance, the Founders decided to recruit a new CEO with the aim to drastically improve the company’s performance. The new CEO began his mandate January 1st, 2019.
Following a brief observation period, the CEO noticed several deficiencies, most importantly, a lack of working process, communication and collaboration across the various divisions. Although he noted that the company was offering certain benefits such as subsidy for food at the company’s cafeteria and attractive prices negotiated by the company for gym memberships, when looking closer, it became patent that the C&B policy was not clearly defined across the organization. To remediate this situation and to revitalize employee performance, it was agreed with the Founders, the CEO and the HR team that an effective C&B policy should be put in place.
6 Appendix 2: Life Cycle Chart
5.
Factors to consider when designing an effective C&B
policy from a CEO’s perspective
Many factors need to be considered when designing and implementing a C&B policy. Although not traditionally the direct responsibilities of the CEO, several aspects have the potential to redefine the company’s DNA and need to be carefully considered.
Firstly, the CEO must make sure that the company’s mission, vision and values are well defined in order to align the C&B policy accordingly. Secondly, it should be determined what type of C&B policy is best suited to the company’s internal and external environment following which it will be essential to clarify the objectives and the purpose of the implementation of a C&B policy. Clearly defined objectives will give a better understanding of which steps need to be taken: does the company want to improve organization’s process, attract the best talents on the market, establish pay equity within the company and/or reduce the turnover rate and therefore increase the company’s profit. Once the objectives have been highlighted, the following step is to identify the applicability of the C&B policy to the various employees across the organization.
Furthermore, analysis should be undertaken to determine how different employees or functions will be rewarded and on what basis. For example, individual or team work and short or long-term objectives. Finally, when considering short term incentives, a reward scheme should be clearly defined.
It is important to remember that each business is different but also for management style. They differ not only from their activities but also from management. This is why it is essential for each company to adapt its C&B policy to the company’s mission, vision and values --- also known as the company’s DNA. As such, prior to establishing the C&B policy, the CEO needs to clearly redefine the company's DNA.
6.
Company’s DNA
It is no secret that, overtime, many companies fail. Without the clear definition of a company’s purpose and objectives, it will be difficult for any company to survive and let alone thrive. Drucker (1973), a prominent management consultant said that: "Business
purpose and business mission are so rarely given adequate thought is perhaps the most important cause of business frustration and failure.” Moreover, Johnson, Whittington,
Scholes, Frery (2011, p.149) citing Montgomery from Harvard University, state that defining and expressing the motivating strategic intention explicitly is an essential task of any strategist. Montgomery shares a question she asks in her MBA classes: “If your
company disappeared today, would the world be different tomorrow?” A manager who is
having a clear view of what the company’s purpose is will be able to answer yes. Without a clear vision of a company’s purpose, it remains a mystery to everyone who is supposed to apply it. These people are likely to end up "inventing" what the company’s intentions are.
From an internal point of view of the company, the mission allows employees to establish a guideline which eases decision making. From an external point of view, this makes it possible to present the uniqueness of the organization and to obtain credibility with the stakeholders (customers, suppliers, investors, government and local communities). By explicitly determining the company's strategy, this will provide clarity to all stakeholders. It is therefore essential to identify the company's DNA in order to align the C&B policy with the values which the company embodies. Indeed, the C&B policy will be shaped accordingly to better influence employees so that they can reflect the company’s purpose and objectives. According to Johnson, Whittington, Scholes, Frery (2011, p.149), there are three elements that constitute together a company’s DNA:
• Mission: Affirmation of its fundamental intention and its purpose. • Vision: What it aspires to become.
• Core values: The principles that underpin an organization’s strategy and define how it should act.
Better Future’s mission "Collect, revalue and make our customers happy!" explains the activities of the company but does not explicitly identify its purpose. Once reviewing the company’s strategy, the CEO submits to the Executive Committee the new company’s DNA:
Mission: “To provide PET recycling services and to revalue these products in order to secure the highest level of recycling rate so as to contribute to the preservation of our planet.”
Better Future’s mission is to excel in the recycling process and to deliver impeccable quality products. It sees this quality as a competitive advantage. It also highlights its contribution to preserving our planet because in the end, the environment needs our protection.
Vision: “To maintain its reputation as an excellent organism in the PET recycling management in Switzerland, which protects and preserves the environment by bringing new value to products and creating something new out of a product that has come to the end of its useful life.”
Core values:
Sustainability: To implement actions which protect our planet.
Quality: To provide outstanding products to ensure a safe and healthy community. Leadership: To show the way to success by helping others grow.
Team Work: To head in the same direction as one heartbeat.
Employee uniqueness: To encourage, appreciate, and reward excellence. Win-Win Partnerships: To create and guarantee win-win partnerships. Integrity: To guarantee a positive word of mouth.
In terms of fundamental values, the company highlights sustainability and quality which represent a competitive advantage. It also identifies the importance of leadership, teamwork, employee’s uniqueness and recognizes and rewards the daily effort of each employee. To ensure the evolution of the company, it wishes to create and guarantee win-win partnerships while promoting its integrity.
It has been noticed that employees who are connected and identify themselves to the company’s purpose will do more to achieve their objectives. In addition, a C&B policy will also be able to motivate, guide and influence employees in order to achieve these objectives. This is why the vision, mission and values of the company must be
the same perception and move forward together to achieve the objectives identified by the company.
Another important element which can be considered part of the company’s values is corporate culture. It refers to the values, attitudes, behaviors, and beliefs that members have within an organization. According to the website Encyclopedia – Business Terms: “Corporate culture is rooted in an organization’s goals, strategies, structure, and
approaches to labor, customers, investors, and the greater community.” Furthermore,
Groysber, Lee, Price and Cheng state in Harvard Business Review: “When properly
aligned with personal values, urges and needs, culture can release huge amounts of energy toward a common goal and promote an organization's ability to thrive.”
The corporate culture and the C&B policy are two complementary elements which support the company’s objectives. Interestingly, not only does corporate culture have a significant impact on the C&B policy, but the C&B policy will have a significant influence on the corporate culture (Madhani, 2014).
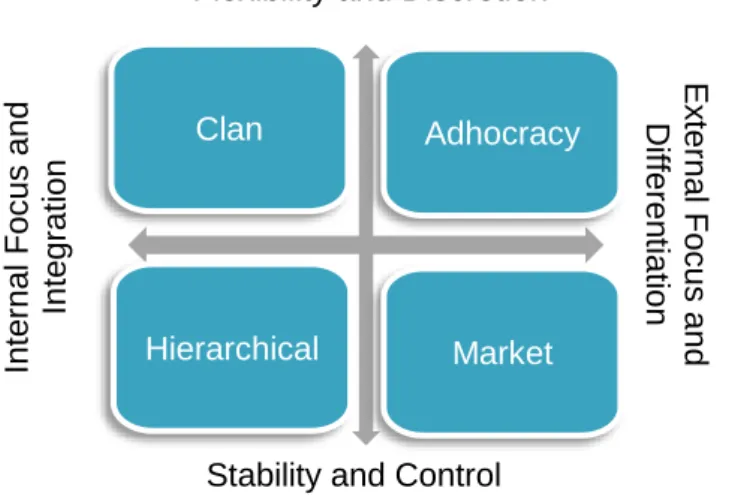
The Competitive Values Framework (CVF) is a model developed by Robert Quinn and Kim Cameron that explains four types of corporate culture based on the way a business operates, employees collaborate and the values that emanate from the business. The CVF is represented as follows:
Figure 5 : Competitive Values Framework
CAMERON, Kim S. QUINN, Robert E. Diagnosing and changing organizational culture. 2006. P. 35
Clan Adhocracy
Hierarchical Market Flexibility and Discretion
E x ternal Fo cus and D iff eren tiati on
Stability and Control
Inte rna l Fo cus an d Inte grat ion
Horizontal line discusses the organizational focus:
• Internal target includes the well-being and development of members within the organization.
• External target indicates the well-being and development of the company itself.
Vertical line distinguishes the structure of the organization (degree of freedom) between flexibility and stability/control.
Through the article "Aligning compensation systems with organizational culture", the author defines each culture and explains how to build a C&B policy accordingly (Madhani, 2014):
Clan culture focuses on common goals and shared values, teamwork, employee involvement and personal commitment. This culture is flexible but is internally oriented and will therefore be less subject to entrepreneurial activity.
C&B strategy will favor a higher proportion of fixed salary. However, teamwork and common goals are represented in this culture and that is the reason why bonuses are established based on team performance or on the results of the organization.
Adhocracy culture can be represented as a temporary institution, which means that tasks are performed temporarily to respond to a specific objective. Organizations adopting the adhocratic culture react rapidly to change and encourage individual initiative.
C&B strategy is built to attract, motivate and retain creative employees who meet the organization's need to be innovative. The C&B policy will integrate a proportion of variable salary based on achieved objectives.
Hierarchical culture forms a clear and structured organization with well-defined responsibilities, strict control with aligned rules and procedures. This culture considers the hierarchy where the individual needs of employees are subordinated to the organization's objectives.
C&B strategy will focus more on control, stability and a long-term system-wide perspective from its employees. Since it can be difficult to assess long-term performance, the focus will be on employee behavior. Behavioral control implies that managers are involved in monitoring, evaluating and rewarding their employees. This corporate culture will have a C&B strategy which will provide high fixed salary and will reward employees for their
Market culture is focused on exchanges with the external environment of the company with the objective of making profits through market competition.
C&B strategy will focus primarily on the operational quality of the business and as such in the retention and acquisition of market share in order for the company to evolve. Individual performance is taken into account and evaluation will be focused on the results. Therefore, a higher proportion of variable salary is recommended in order to reward employees for the achievement of their short-term objectives.
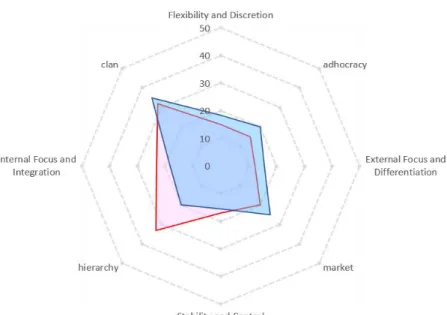
In order to establish the diagnosis of the corporate culture of Better Future SA, the CEO filled out the Organizational Culture Assessment Instrument7 (OCAI) questionnaire to
identify the current culture and determine the desired culture he wishes to implement. OCAI measures six key dimensions of corporate culture which are dominant characteristics, organizational leadership, employee management, organizational coaching, strategic emphases and success criteria (Cameron, Quinn 2006).
Figure 6 : Better Future’s Culture
Results of OCAI test
7 The Organizational Culture Assessment Instrument (OCAI), developed by Kim Cameron and Robert Quinn, is a validated research method to assess organizational culture.
The results show that the hierarchy culture currently dominates within the company. The aim of the CEO is to reduce the hierarchy aspect and increase teamwork, consensus and participation (clan), innovation, risk taking and uniqueness (adhocracy) as well as gain market share and be up to the competition (market). As a result, the C&B policy will be shaped based primarily on clan, adhocracy and market cultures.
7.
Aligning C&B with the company's environment
7.1 Internal environment
Each company is different from one another and not all companies will have the same C&B policy. Therefore, when shaping a C&B policy, it is essential to rely on the internal elements of the company and thus adapt and create its policy accordingly.
The table 1 “Better Future’s Generations” groups the types of generation working within the company. The table indicates that Baby Boomers, people close to retirement, represent about 24% of the population, Generation X represent 43% and 33% for the Generation Y. A single C&B strategy cannot be effective for all employees because depending on the age of the employees, they hold different attitude toward work and each generation values and perceives reward differently (Valickas, Jakstaite, 2017).
Therefore, in order to attract, retain and motivate, the company will have to create several types of reward strategies to consider all employees. The article “Different Generations’
attitudes towards work and management in the business organizations” points out the
different characteristics of each generations such as attitudes, behaviors, motivations and work which must be defined and considered (Valickas, Jakstaite, 2017):
Baby Boomers (1946 - 1964): The Baby Boomer generation is considered the workaholics, is very attached to their workplace and has a certain loyalty to their organization. Findings suggest that Baby Boomers are mostly motivated by relaxed stress-free job, health and freedom.
C&B strategy: An idea would be to allow employees to increase their contribution to their pension fund or offer an exit package if the employee should lose their job for one reason or another.
Generation X (1965 - 1982): Generation X have greater loyalty towards their profession rather than their organization. This generation values personal life and chooses a job
C&B strategy: Since these employees find their motivation through a good work-life-balance, the company could offer to employees the means to do home office for example. Generation Y (1983 - 2001): This generation are the first natives of digitalization and are mostly loyal to career opportunities rather than to a given company. They tend to view their current position as a phase of learning and development. Comfortable with different technologies, Generation Y are looking for an attractive job enabling them to evolve. The motivating reasons for Generation Y are a competitive salary, training and development opportunities. In addition, this generation likes to feel free to work in another place other than on company’s premises. Companies now offer the possibility to work from home or in offices outside the company as well as flexible working hours. Finally, it is more and more common that Generation Y wish to carry out humanitarian missions or to participate in a project which will have a positive impact on the environment/community. In order to achieve a personal goal, the company can support their choice and values by granting them unpaid leave during a certain period.
C&B strategy: Set up, for example, several trainings and put more emphasis on career development, flexible hours, working from outside company’s offices and unpaid leave to achieve personal objectives.
Since the different characteristics have been analyzed and clarified, the CEO will therefore structure the C&B policy while considering the needs of the different generations.
7.2 Economic trends
The way each organization designs its C&B policy does not only depend on internal factors of the company but on various external factors as well. The economic landscape has a profound effect on organizations in general but also on C&B. Depending on the nature of the business activity, the most important expense of an organization may be the C&B and the elements related to employee wellness. C&B policy is at the heart of several economic trends and this is the reason why it is essential for an organization to monitor and adapt these costs according to market movements.
Unemployment rate, inflation and the gross domestic product (GDP) are the main economic trends analyzed while designing a C&B policy. Low unemployment leads to higher GDP, higher wages and higher industrial production (Labonte, Stupak, 2016). Indeed, the Phillips curve8, a curve indicating a negative relationship between the
unemployment rate and inflation indicates that when the unemployment rate decreases, salaries increase, which leads to inflation. Conversely, if unemployment rises, the salaries increase will slow down, and inflation will fall. Although the Phillips curve has been less effective as an indicator since the financial crisis and unconventional bank policies, it is still a useful tool.
The analysis of the unemployment rate will allow to foresee the departures of employees. With a high unemployment rate on the market, employees will be reluctant to leave. On the contrary, if the unemployment rate is relatively low, it is important for Managers to take necessary measures to retain employees.
Moreover, inflation is one of the factors that allows to anticipate the evolution of the market as regards to the purchasing power of consumers. If there is an increase in the inflation rate from year to year, it will decrease the purchasing power of consumers. As a result, inflation is a factor that will have a direct impact on the company's financial decisions. Regarding the GDP, it is an indicator of economic activity used to measure and compare economic development levels in different countries.
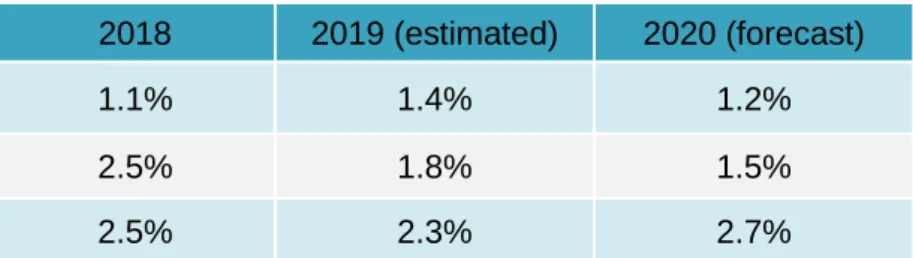
In order to have an overview of market data, the CEO indicated the rates provided by Mercer9 for the inflation and GDP and conducted an analysis on the International
Monetary fund (IMF) website for the unemployment rate. Here is a summary table of data from 2018 to 2020 analyzed during the year 2019.
Table 2 : Economic Trends 2019
Economic Trends 2018 2019 (estimated) 2020 (forecast)
Inflation 1.1% 1.4% 1.2%
GDP 2.5% 1.8% 1.5%
Unemployment rate 2.5% 2.3% 2.7%
7.3 Economic crisis
The coronavirus (Covid-19), which appeared in December 2019 in the city of Wuhan, China, is the cause of a global health crisis that has shaken the global economy.
The first people affected by the virus in Switzerland were detected in February 2020. As of March 16th, 2020, the Federal Confederation took the decision to close all stores,
restaurants / bars as well as entertainment establishments. Only food stores and health establishments stayed open. Since that date, the Swiss economy has been put on hold, companies ceased their activity and the Swiss people were henceforth confined in their homes. Even though companies have started implementing home office to allow the continuity of certain activities such as HR, Finance and IT, all companies producing goods had no other choice but to shut down until further notice and as a result, companies are facing great losses.
Due to the pandemic, companies find themselves in a situation having to make decisions to overcome their economic loss, like for instance, reducing overtime compensation, suspending job openings without replacing departures and cutting down bonuses.
This is the reason why it is key to consider economic trends in order to adapt strategy compensation in these moments of crisis. Moreover, a C&B policy must imperatively balance financial and non-financial rewards in order to keep employees motivated, especially during exceptional times.
7.4 External pay competitiveness
One of the fundamental elements when designing a C&B policy is to consider external pay competitiveness. This is when HR come to ask themselves "what is the market doing?” (Klingler, Pieren, Lampart, Feliziani 2017, P. 60) To do so, organizations compare their compensation data with other organizations having the same size, location and similar jobs. Therefore, it will be possible to determine if employee’s remuneration is aligned with the market labor. Furthermore, market data indicates the practices in terms of remuneration of competing companies. By analyzing market data, it allows organizations to be competitive and thus attract new employees. In addition, market data provide an indication of whether salaries need to be increased, which is a component of employee overall satisfaction.
8.
Defining the objectives of a C&B policy
The objectives of a C&B policy are specific to each company and depend on what the company wishes to set up or improve. For instance, does the company want to improve organization’s process, attract the best talents on the market, establish pay equity within the company and/or reduce the turnover rate and therefore increase the company’s profit. Thus, it is essential to identify the company’s greatest internal weaknesses in order to overcome them.
8.1 Salary inequalities
On the employees’ side, compensation must be perceived as fair, competitive in the market and motivating (Burke 2008). Indeed, if employees notice pay inequalities within their organization, their motivation, engagement and loyalty may be discouraged, and they could end up leaving the company. According to the International Labor Organization, equal pay is a key element in the company's hiring and retention strategies. Korn Ferry10
also stated that organizations who pay their employees fairly would have better chance of attracting and retaining their best talent, unlike companies who pay unfairly will create dissatisfied employees and therefore hamper business performance.
Within Better Future SA, the CEO identified that there were indeed large salary inequalities within the company by comparing similar position titles within a division. The two most striking examples11 are the salaries of a Purification Operator and a Recycling
Truck Driver. First, all Purification Operators are paid around CHF 85’000, but a 33-year-old Purification Operator is paid CHF 105’000.-. A reason which could explain this gap is that he’s a family member to one of the directors and will soon take over as Team Leader. The second striking example is the extremely low salary of the 62-year-old Recycling Truck Driver whose salary is CHF 62’000 whilst the other Recycling Truck Drivers earn around CHF 68’500.-. One explanation that could be given is the fact that this employee often received warnings but because of his age, the company never dismissed him. As a result, Better Future SA must review and adjust employees’ salaries. If the company is not competitive in terms of compensation, it is very likely that the employees will leave the company to go work in an organization providing better compensation.
8.2 Turnover
The second internal weakness the CEO identified within Better Future SA was a high turnover. One of HR’s objectives is to maintain a low turnover rate because a high turnover tends to have a negative impact on the company. Talented employees leaving the company because they found a better opportunity elsewhere means that the company is not only losing “know-how” but is also losing attractiveness. In addition, high turnover rate is also linked to high costs (loss of production, recruitment and training costs, etc.). According to a case study conducted by McMullen and Royal (2012), the main reasons for employee departure are the “opportunity to earn more pay elsewhere”, the “lack of
promotional opportunities” and “feelings that pay levels are unfair relative to others outside the organization”. By identifying the main reasons for employee departure, measures can
be taken to retain key employees.
According to Qualtrics, the turnover rate is calculated by adding the number of employees who have left the company during a period of time (from January 1 to December 31, for example), to the new commers during the same period, divided by 2, and divided again by the total number of employees at the beginning of this period. (January 1)12.
A company will never have a turnover rate equal to 0% since each year, employees retire, or limited contracts come to an end. However, a too low turnover rate is not necessarily healthy for a company. If a turnover rate is low, this means that the only employees leaving the company are the ones retiring or who found a better opportunity elsewhere. Therefore, this could have a negative impact on productivity levels since low-performing employees stay within the company (Zurek).
One of the main objectives in the analysis of a turnover rate is to identify the number of employees who decide to leave the company voluntarily. This analysis will allow managers to know if the turnover rate is considered healthy. In general, a healthy turnover rate based on voluntary departures (resignations) is between 3% and 5% in Switzerland. As stated by Qualtrics “A company’s turnover is considered as low when it is less than
5%. However, if it exceeds 15%, it means that the employee attrition rate is high and that the company suffers from a poor social climate due to a variety of causes”.
12 (Number of departures in N + Number of arrivals in N) / 2] / Workforce as of January 1 of year N
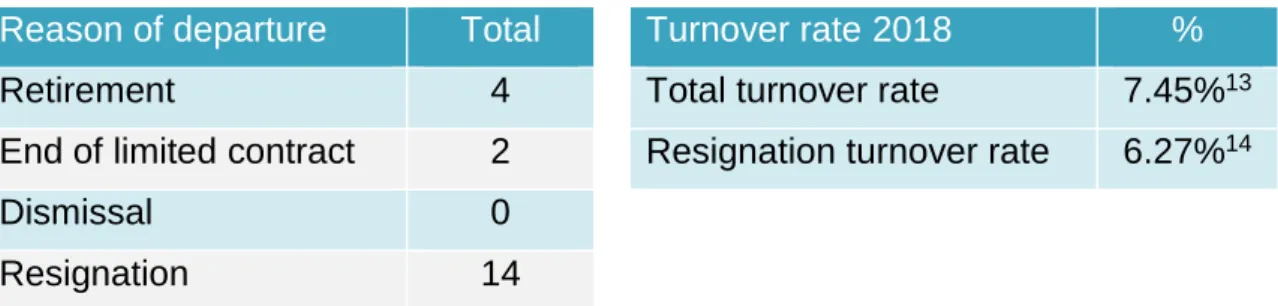
Since the CEO identified a high turnover, he decided to carry out its analysis which was conducted mid-2019. The CEO based the turnover rate on year 2018 in order to have data for a full year.
The number of employees on January 1st, 2018 was 255 employees, and 253 employees
on December 31st, 2018 with 18 new commers and 20 departures during the year. First,
the CEO pointed out the main reasons of these departures. Secondly, he calculated the turnover rate based on the year 2018 and highlighted the turnover rate based on resignations only:
Table 3 : Better Future’s Turnover
Reason of departure
Total
Turnover rate 2018
%
Retirement
4
Total turnover rate
7.45%
13End of limited contract
2
Resignation turnover rate
6.27%
14Dismissal
0
Resignation
14
This analysis shows that the company’s total turnover rate is higher than 5% with a rate based on resignations at 6.27%. Better Future SA is in a situation where its turnover rate is high. Moreover, the reasons of employee resignations were mainly due to inadequate compensation, lack of career growth, training and development and finally, management dissatisfaction. As a result, Better Future’s high turnover rate followed by the highlighted departure reasons represent major weaknesses for the company in terms of cost and image.
However, the real concern that stands in which the company should be more focused on is regretted loss. Regretted losses occur when the voluntary departure of an employee has a negative impact on the organization. Indeed, it is not always easy to replace a talented employee with solid knowledge and experience within the company. This is the reason why it is more accurate to measure the turnover based on regretted loss to define the health of an organization (Malloy Cummings 2016).
8.3 Lack of clarity in the company’s processes
The third weakness highlighted by the CEO is the lack of working process, communication and collaboration between the different divisions. He observed that some working processes were unclear, and several employee roles and responsibilities were not well defined. To overcome this situation, the review of the entire organization’s working process needed to be conducted which could potentially lead to internal restructuring. After having identified the major weaknesses of the company which include salary inequalities, high turnover rate and lack of processes, communication and teamwork across the various divisions, the objectives of the implementation of a C&B policy will help to overcome these deficiencies.
9.
Developing an effective C&B policy
9.1 Restructuring
Internal restructuring aims to develop the organization through a streamlining of the processes and redefining the functions which makes it possible to reduce the costs, to cluster energies and skills and to identify the company’s assets (Held-Khawam 2002). After numerous discussions between the CEO and the Founders, the CEO decided to restructure certain divisions. Nowadays, organizations must constantly improve their competitiveness and sometimes these changes involve restructuring. The aim of this restructuring within Better Future SA is to improve management system in order to increase the company’s performance.
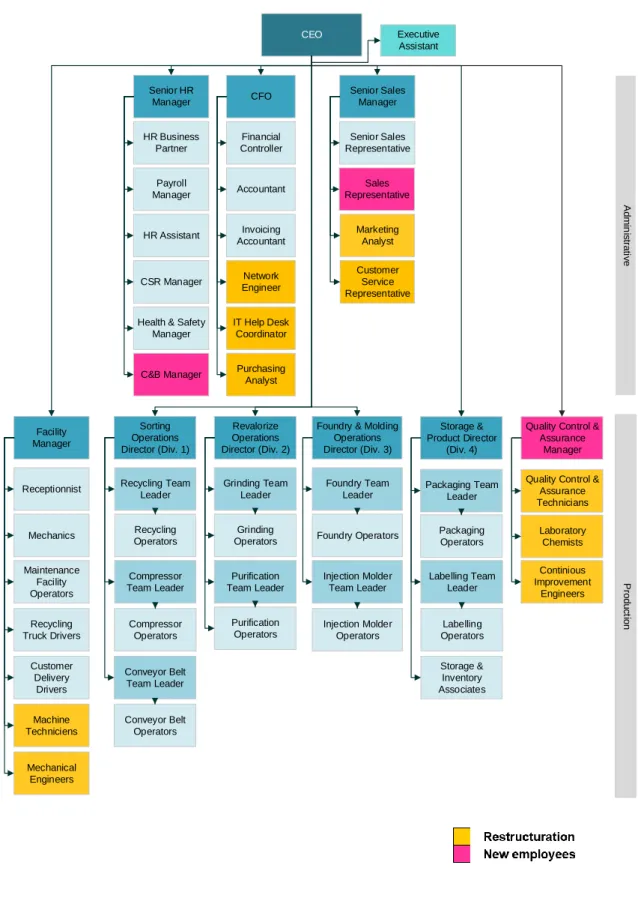
To start with the Administration services, a new position was created within the HR department. The HR needed a C&B Manager to participate in the implementation of the C&B policy and to conduct the C&B annual exercises. The decision was also made to combine IT/ERP15 and Purchasing department with the Finance department. Employees
in the IT/ERP and Purchasing departments now report to the CFO. Finally, the Senior Sales Manager has been promoted and is now responsible for both sales and marketing departments. The Marketing Analyst and Customer Service Representative now report to the Senior Sales & Marketing Manager. In addition, the Senior Sales & Marketing Manager decided, with the approval of the CEO, to hire a Sales Representative to support the Senior Sales Representative in his daily activities.
15 IT: Information Technology
Regarding the Production services, Machine Technicians and Mechanical Engineers now report to the Facility Manager. Finally, a new service has been created with a new Quality Control & Assurance Manager, gathering together all positions relating to research and development. The new organization has been defined as follows:
Figure 7 : Better Future’s New Organizational Chart
CEO Senior HR Manager HR Business Partner Payroll Manager HR Assistant
Health & Safety
Manager CFO Financial Controller Accountant Invoicing Accountant Network Engineer IT Help Desk Coordinator Marketing Analyst Customer Service Representative Senior Sales Manager Senior Sales Representative Purchasing Analyst Facility Manager Mechanics Maintenance Facility Operators Sorting Operations Director (Div. 1) Revalorize Operations Director (Div. 2) Grinding Team Leader
Foundry & Molding
Operations Director (Div. 3) Foundry Team Leader Injection Molder Team Leader Storage & Product Director (Div. 4) Packaging Team Leader
Quality Control &
Assurance
Manager
Quality Control &
Assurance Technicians Receptionnist Recycling Truck Drivers Customer Delivery Drivers Labelling Team Leader Storage & Inventory Associates Laboratory Chemists Continious Improvement Engineers Recycling Operators Compressor Operators Conveyor Belt Operators Grinding Operators Purification Operators Recycling Team Leader Compressor Team Leader Conveyor Belt Team Leader Purification Team Leader Foundry Operators Injection Molder Operators Packaging Operators Labelling Operators Executive Assistant Ad m in is tra tiv e Pro d u c tio n Machine Techniciens Mechanical Engineers Sales Representative C&B Manager CSR Manager
9.2 Salary structure
Now that the overall working process has been improved, the next step when designing a C&B policy will be to establish a salary structure
.
Salary structures are composed of compensation levels which represent the value of a job within an internal organization as well as salary market practices (Ducan 2019). According to WorldatWork, “salarystructures serve as the foundation of administering base pay within organizations”. A
well-designed salary structure will not only help to decrease salary inequalities but will also be used as a tool for Managers to reward individual performance. To create a salary structure, it would therefore be necessary to go through different stages using different compensation tools:
9.2.1 Job Analysis
A job analysis includes the study of all existing positions within an organization. For this, it is necessary to identify the activities and responsibilities of each position and to compare its importance with other positions of the company. Furthermore, it is also necessary to identify the qualifications needed in order to perform the job. This analysis leads to the review and implementation of job descriptions which includes the job title, a summary of the knowledge and skills and a list of essential tasks and responsibilities16.
In the case where a company does not have job descriptions which clearly specify roles, responsibilities and the specific skills required to achieve the work, updating these documents will be part of the process. Revising all job descriptions, especially for organizations having many employees is a long and heavy task. However, gathering detailed job information for every position will pay off, particularly to support decisions related to compensation.
9.2.2 Job Evaluation
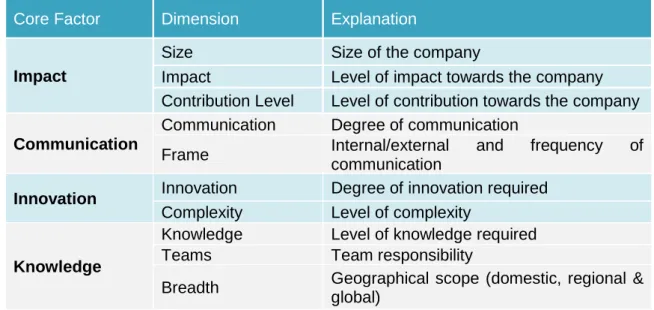
The second step in designing a salary structure is the exercise of the job evaluation which involves assessing the relative value of jobs in an organization. The value of each position will be based on the job description previously established. For this task, the C&B Manager decided to use Mercer’s International Position Evaluation (IPE) tool. The IPE is a system based on points and four core factors: Impact, Communication, Innovation and Knowledge and each of these core factors include 2 to 3 dimensions.
Table 4 : Mercer’s International Position Evaluation
Core Factor Dimension Explanation
Impact
Size Size of the company
Impact Level of impact towards the company Contribution Level Level of contribution towards the company Communication
Communication Degree of communication
Frame Internal/external and frequency of communication
Innovation Innovation Degree of innovation required Complexity Level of complexity
Knowledge
Knowledge Level of knowledge required
Teams Team responsibility
Breadth Geographical scope (domestic, regional & global)
ATANASOV, Kamen. MERCER. Boost Reward Planning. 2014
By using the IPE tool, it will therefore be possible to assign points to each of these dimensions which will ultimately give out the total points for a specific job. As a result, a position class (PC) will then be matched according to the result of the total points:
Table 5 : Mercer’s Position Class
Total Point Range PC Total Point Range PC Total Point Range PC 26 - 50 40 426 - 450 56 826 - 850 72 51 - 75 41 451 - 475 57 851 - 875 73 76 - 100 42 476 - 500 58 876 - 900 74 101 - 125 43 501 - 525 59 901 - 925 75 126 - 150 44 526 - 550 60 926 - 950 76 151 - 175 45 551 - 575 61 951 - 975 77 176 - 200 46 576 - 600 62 976 - 1000 78 201 - 225 47 601 - 625 63 1001 - 1025 79 226 - 250 48 626 - 650 64 1026 - 1050 80 251 - 275 49 651 - 675 65 1051 - 1075 81 276 - 300 50 676 - 700 66 1076 - 1100 82 301 - 325 51 701 - 725 67 1101 - 1125 83 326 - 350 52 726 - 750 68 1126 - 1150 84 351 - 375 53 751 - 775 69 1151 - 1175 85 376 - 400 54 776 - 800 70 1176 - 1200 86 401 - 425 55 801 - 825 71 1201 - 1225 87
internal salary range which will be created by the C&B Manager, based on salary market data. Therefore, in order to receive salary market data, Better Future SA would need to participate to an external HR Consulting’s survey.
9.3 Mercer Total Reward Survey (TRS)
9.3.1 Online Survey
While establishing the job evaluation for all existing position titles, the C&B Manager decided to participate to Mercer’s TRS in order to receive salary data from the market. The results which will be provided in return by Mercer give out anonymous information about market salaries, benefits practices as well as short and long-term incentives. With this information, the C&B Manager will be able to finish designing the salary structure and make decisions related to benefits, short and long-term incentives implementation. The survey is divided into six categories which need to be filled in:
9.3.1.1 Company Data
This section includes information about the company such as the company’s name, type of legal entity, type of industry, activities, as well as information on the frequency of the salary review.
9.3.1.2 Incumbents
This section collects compensation data on all employees who can be matched to Mercer’s Job Library Code. The latter is a catalog containing position titles with the explanation of specific skills for each job title. The purpose of this catalog is to match each position title of the company with a position appearing in the Mercer Job Library Code. Here is how Mercer’s Job Library is structured:
1st level: Family Titles include all types of job industries
2nd level: Sub Family Titles indicate specific activities for each Family
3rd level: Specialization Titles demonstrate all specializations for each Sub Family Titles
4th level: Career Stream and the Career Level. The Career stream displays four
categories which are Executive (E), Management (M), Professional (P) and Para Professional (S)17. Then, the Career level will determine at which level, between 10 and
50, each position stands. The greater the number of the Career level, the higher the
position is situated. Hereunder is an example of a job matching with one of Mercer’s Code for a Compensation & Benefits Manager, level 30:
Figure 8 : Mercer’s Job Code for C&B Manager
Mercer Job Library – Catalogue of Jobs (2018)
In order to complete the section, each position title of the company must be matched with a Mercer Code.
9.3.1.3 Long-term incentives plan
In this category, it is necessary to indicate which are the long-term incentive plans exercised within the company. Since Better Future SA has no long-term incentive plans, the C&B Manager left this category empty.
9.3.1.4 Short-term incentives
In order to provide information on short term incentives, the C&B Manager analyzed the different types of variable payments that had been paid over the past three years. As a result, an “end of year thank you bonus” was paid to a couple of employees, mostly to Managers and Executives.
9.3.1.5 Benefits
In the benefits section, the C&B Manager indicated the total amount of food subsidy the company is providing to its employees.
9.3.1.6 Company cars
Since the company does not provide any company cars, the C&B Manager left this part blank.
Once the survey is completed, the results are sent back within a couple of weeks. Sub-Family Family
HRM
. 04 . 001 .
M30
Career Stream Career Level Specialization10.
Better Future’s C&B policy
The results18 received in return which include market salaries, benefits, short and
long-term incentives enabled the C&B Manager to design the C&B policy for Better Future SA.
10.1 Salary Structure
To begin with, the C&B Manager analyzes the market salary data indicating the salaries assigned to each position class, making it possible to establish the company’s internal salary structure. The market salary data supplied in return include three different information:
Low-end: Represents the low-end salary level for a specific level of positions.
Median: The median salary indicates that 50% of the market is below this reference point and the other 50% is above this reference point.
High-End: Represents the high-end salary level for a specific level of positions.
An important fact to remember is that a salary structure is specific to each company. Depending on the different types of position class existing within an organization, they will have to be grouped together to create an internal grading structure, designed in this case, by the C&B Manager:
Table 6 : Better Future’s Compensation Structure
Internal Grade
Mercer’s
Position Class Salary Range Range
From To Low-End Median High-End Low-End High-End
A 61 64 207 000 276 000 345 000 -25% +25% B 56 60 165 500 207 000 248 500 -20% +20% C 53 55 125 000 147 000 169 000 -15% +15% D 48 52 98 000 115 000 132 500 -15% +15% E 44 47 78 000 89 000 100 000 -13% +13% F 41 43 66 000 73 500 81 000 -10% +10%
Better Future’s internal grading structure includes letters from A to F and each of these letters have different position levels, with A being the highest and F the lowest. As a result, A includes Executives, namely the CEO and the CFO. B brings together all four Directors
18 As part of my work, I was authorized to use Mercer’s TRS survey results (2019)
of Production as well as Senior Managers. The letter C includes Managers and positions working closely and regularly with Senior Managers. D groups all production Team Leaders, as well as some positions requiring a certain level of knowledge and experience in the field. E groups fewer complex positions. However, a high school diploma or a Federal Diploma of Vocational Education and Training is still required in order to achieve the job. Finally, the letter F includes all position that do not specifically require a diploma but possibly a driving license and some professional experience.
Regarding the salary range, the C&B Manager referred to Mercer's Total Reward results. Indeed, the median displayed in table 6 “Better Future’s Compensation Structure” is a clustering of salary medians for each Mercer’s position class. Then, the low and high-end represent salary entry level and ceiling within which an employee should ideally be positioned. In order to calculate these ends, the C&B Manager will apply a percentage that will indicate the differences between the median and the low and high-ends. These percentages are shown in the table under “Range” and vary from one internal grade to another. Since there is more chance of having a higher salary range in grade A than in grade F, the spread will be larger. The higher the rate, the greater the range between the low and high-end salary. Hereunder is how the low and high-end are calculated for grade A:
• Low-end: 276′000 𝑥 (1 − 0.25) = 207′000 • High-end: 276′000 𝑥 (1 + 0.25) = 345′000
Then, the C&B Manager's approach was to extract the salary data from the payroll software of each employee effective on January 1st, 2019 and to compare them with the
median salaries indicated in table 6 “Better Future’s Compensation Structure” for each internal grade. As a result, a graph has been put together combining the low and high-ends, the median salary and the salary data of Better Future SA:
Figure 9 : Better Future’s Salary Data 2019
The x-axis indicates the internal grades (A = 6; B = 5; C = 4; D = 3; E = 2; F = 1). The y-axis is the salary values in CHF and the little crosses in the table are 2019 current annual base salaries for all employees within the company. Moreover, there are four regression lines that appear on this graphic. In dashed grey are the low and high-ends, the black line corresponds to the median and finally, the red line represents the company's salary internal trend line.
It was been decided that Better Future’s C&B policy is to pay at market median for the base salary component. Thus, well-defined and well-distributed salaries within an organization should be as close to the median as possible. The graph shows that the
y