HAL Id: hal-03215382
https://hal.archives-ouvertes.fr/hal-03215382
Submitted on 3 May 2021
HAL is a multi-disciplinary open access
archive for the deposit and dissemination of
sci-entific research documents, whether they are
pub-lished or not. The documents may come from
teaching and research institutions in France or
abroad, or from public or private research centers.
L’archive ouverte pluridisciplinaire HAL, est
destinée au dépôt et à la diffusion de documents
scientifiques de niveau recherche, publiés ou non,
émanant des établissements d’enseignement et de
recherche français ou étrangers, des laboratoires
publics ou privés.
Post-eruptive deformation associated with the 1986-87
and 1989 lava flows of Etna detected by radar
interferometry
Pierre Briole, D. Massonnet, C. Delacourt
To cite this version:
Pierre Briole, D. Massonnet, C. Delacourt. Post-eruptive deformation associated with the 1986-87 and
1989 lava flows of Etna detected by radar interferometry. Geophysical Research Letters, American
Geophysical Union, 1997, 24 (1), pp.37-40. �10.1029/96GL03705�. �hal-03215382�
Post-eruptive deformation associated with the 1986-87
and 1989 lava flows of Etna detected by radar
interferometry
P. Briole,
•'2 D. Massonnet
3 and C. Delacourt
•
Abstract. We analysed 92 interferograms produced us- ing ERS1 SAR images taken on Etna between May 1992and October 1993. Nineteen show a local subsidence in
the eastern flank of the volcano, correlated with the lo-
cation of the 30 October 1986- 1 March 1987 and 27
September- 9 October 1989 lava flows. Using fringe un- wrapping and data gridcling techniques, and assuming that over the sampled time-window, deformation was a linear function of time, we derive a map of along range
rate of motion. The correlation between the deforma-
tion field and the area covered by recent lavas suggests that compaction of the lava flows continues several years
after the eruptions. The area of maximum subsidence
(47 mm/yr.) is localised at the narrowing of the 1989
flow, between 1500 and 1700 m a.s.1.. We observe that subsidence extends outside the lava flows, accounting for at least 12 mm/yr. Assuming a relaxation process of the substrate in response to loading produced by re- cent lavas, a simple 1D Maxwell visco-elastic model pre-
dicts a maximum subsidence rate of 25 mm/yr and a
relaxation time of about 3.5 years. The relaxation time agrees with those derived from post-eruptive displace- ments observed by levelling on Etna and Piton de la
Fournaise after several eruptions. We conclude that at
the time of our measurements, 25 to 50% of the defor-
mation was related to relaxation of the substrate and
the other part due to compaction of the lava flows.
Introduction
Post-eruptive deformations correlated with the loca-
tion of lava fields have already been observed from lev- elling data on volcanoes, for example after the 1981 and
1983 eruptions of Etna [Murray, 1988] after the 1961, 1976, 1977, 1986 eruptions of Piton de la Fournaise [D½- lotroe, 1994]. On Piton de la Fournaise, the data cor-
responding to the 1976 and 1986 eruptions showed that
the deformation took place over several years (20 mm
• Institut de Physique du Globe, Paris, France
2CNRS, URA 195, France
3 Centre National d'Etudes Spatiales, Toulouse, France
Copyright 1997 by the American Geophysical t tnion.
Paper number 96GL03705.
0094-g 534/97/96G I ,-03705505.00
37
subsidence between 1980 and 1986, then 5 mm between
1986 and 1989 for the 1976 eruption; 10 mm subsidence in the first days after the 1986 eruption, then 100 mm
between 1986 and 1989). On Etna, Murray [1988] pro-
posed that most of the observed deformation was due to compaction of the recently deposited lava, with relax-
ation times ranging between a few years and 15 years.
As the deformation observed on Piton de l a Fournaise was located outside the lava flow itself, Delorme [1994]
proposed a process of relaxation of the substrate in re-
sponse to the loading of the lava. Measurement and
interpretation of deformations related to deposited lava
is fundamental on volcanoes because it gives access to quantitative information on the sub-surface rheology that is necessary for developing realistic models of de-
formations associated with eruption, dike emplacements or flank unstabilities. Thanks to the new capability of
mapping deformations offered by radar interferometry,
we analyse in this paper a deformation located in a re-
mote area of Etna (Figure 1) where no classical geodetic data are available. In a previous paper [Massonnet et al., 1995], we used radar interferometry data to assess the location (16 km depth) of a volcano-wide deflat-
ing zone associated with the 1991-93 eruption. Here,
we use the same data and focuse on a local anomaly
(Figure 2) that is spatially well correlated with the 27
September - 9 October 1989 lava field and partly with that of 30 October 1986- 1 March 1987 (Figure 3a, 3b). The 1989 eruption occured inside the Valle del
Bove, between 2550 m and 1100 m a.s.l., with the fol-
lowing characteristics [Bertagnini et al., 1990]' area- 3.3 km 2, volume- 26 x 10 ½ m 3, maximum thickness
= 10 m. The 1986-87 eruption took place in the same
area, between 2900 m and 1300 m a.s.l., with area-
6.5 km 2 and volume
- 60 x 10
½ m 3 [Azzaro
and Neri,
1992]. The coincidence between the location of the lava fields and the deforming area is clear (Figure 3a, 3b).
To explain our data, in the following, we investigate the two physical processes mentioned above: compaction of
the recent lava flows and relaxation of the substrate.
Data analysis
We analysed 92 interferograms created with ERS1 SAR images acquired on Etna between May 1992 and October 1993. Nineteen have coherent phase returns and interference fringes that show clearly an anomalous subsidence in the eastern part of the volcano. The ten
38 BRIOLE ET AL.' POST-ERUPTIVE DEFORMATION ON ETNA
ETNA
37' •' 37' 40'1,•'
50'
15'
00'
15'
10'
15'
20'
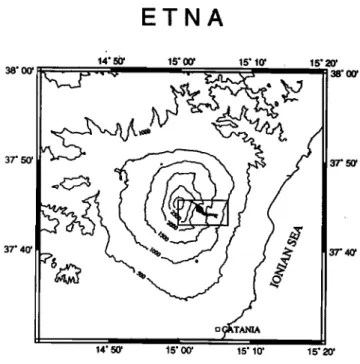
37' 50' II I ' I ß 14' 50' i5' 00' 15' 10' 15' 20'Figure 1. Map of Mount Etna. The box shows the location of the interferograms. The UTM33 coordi- nates of the NW corner of the box are: x= 499.560,
y: 4179.320.
The 27 September
- 9 October 1989 lava
flow is reported in black.
best interferograms are listed in Table 1 and shown in
Figure 2. The subsidence pattern is stable spatially. This can be easily checked in two places: the narrowing
of the 1989 lava flow at 1600 m a.s.1. and the lower end
of this lava flow at 1200 m a.s.1.. The amplitude of the
movement ranges between 2 and 4 fringes (about 6 to 12 cm) depending on the interferogram. The dependence
between elapsed time and amplitude cannot be assessed
over a wide time frame because most of the interfero- grams have relatively comparable elapsed times (210 to 385 days). We further assume that the amplitude of the
observed phenomenon is a linear function of time. The
altitude of ambiguity [Massonnet and Rabaute, 1993] of most interferograms we use is above 50 m (Table 1).
This ensures that the uncertainty due to the inaccu-
racy of the digital elevation model (DEM) is at most
one Sixth of a fringe, or about 5 ram. To quantify the observed subsidence, we unwrapped the fringes in the places where they were clearly separable. This was pos- sible in seven of the ten interferograms shown in Figure
2 (a, c, d, e, f, g, j). Then, using a gridding algorithm (triangulation with linear interpolation), we created an image of the deformation field for each interferogram, limited to the area where effective information was ob-
tained from the fringes. Finally, we averaged the seven images weighted by their duration, to obtain a map of
along range rates of subsidence (Figure 3c). The area where a deformation is observed is 4.1 km 2 and the rate
of volume
change
is 90 103 m3/yr. The average
subsi-
dence rate is then 22 mm/yr. The maximum rate is
47 mm/yr at the narrowing of the 1989 lava flow near elevation 1600 m. Figure 4 shows the rate of range
change along a N45E section A-A' (Figure 3c) crossing the lava field near this maximum. In order to validate
the quality of our interferograms, we processed the data
using two codes ß the code developed by CNES (the reference in this study) and the code developed at IPG
on a Connection
Machine
(CM5-128).• We also used
two different digital elevation models {DEMs) ß CNES used a DEM obtained from a SPOT stereoscopic pair
acquired
in July 1991, whose
vertical accuracy
is 8 m
(r.m.s.
error) and IPG used
a DE M obtained
from an
aero-photogrammetric survey carried out in September
1985. A comparison
of the interferograms
obtained
us-
ing both different codes and DEMs is shown in Figure
3a and 3b for our best interferogram
(interferogram
(e)
in Table 1). Only minor difference
is visible
in the west-
ern edge of the scene. The r.m.s. scatter between thetwo DEMs (Figure 3d) is 22 m. This ensures
a posterJ-
ori the independence of the DEM for the generation of
the interferogram. However, as one DEM is using 1985
data and the other 1991 data, their difference contains signatures of the 1986-87 and 1989 lavas at the places where their thickness exceeds 20 m. The average differ- ence of the DEMs in the area delimited by the lava flows is 15 m, that is compatible with the average thickness deduced from the surfaces and volumes reported above.
The maximum positive difference is +80 m (largest red spot in figure 3d) and is observed inside the lava flows area and could be due to a thickening of the 1986-87 lava field. The maximum negative difference (violet spot of -170 m in the southwest on figure 3d) is an artefact
due to a cloud masking the terrain in one of the SPOT images.
Discussion
Three observations of the deformation field are sig-
nificant: 1. the deformation field is correlated with the
area covered by lava in 1986-87 and 1989; 2. part of
the deformation is located outside the lava flow itself;
3. there is a maximum of subsidence concentrated at
the narrowing observable on the 1989 lava flow between
1500 and i700 m a.s.1. We suggest
that this last ob-
servation is associated with a relative thickening of the1986-87 and/or 1989 lava flows there, that, however,
could not exceed 40 m as this is constrained by the difference of the two DEMs discussed in the previous
section. We propose
that the observed
signal corre-
sponds to both visco-elastic relaxation of the medium in response to the loading and compaction of the recent lava flows. To quantify the relaxation, we use a simplemodel of Maxwell visco-elasticity strain relaxation [Tur- cotte and Schubert, 1982], that is compatible with the
temporal and spatial scales of our problem. We assume that the deformation is mostly vertical, and neglect the contribution of the horizontal movement to the change
in range. Using equation 7-243 of these authors (p. 338), with v=0.25, we obtain:
Figure 2. The 10 interferograms used quantitatively in our study. Each image contains 128 x 257 pixels of 40 m. The two orbit numbers, the ambiguity height and
the characteristic ascending (a)or descending (d) are indicated. The contour lines (every 100 m) are drawn.
e2 = cro12E (3 - 413exp(-t/r)), (1) where e2 is the strain, r = (9 p / 2 E) the Maxwell
relaxation time and p the viscosity of the medium. The
derivative of (1) gives the rate of along range displace-
ment dR/dr:
eling of deformations associated with dike intrusions at low depth on Piton de la Fournaise. The value of or0
(1 MPa) is deduced from a 40 m height of lava of den-
sity 2500 kg m -a at the place
of maximum
subsidence.
Assuming that most of the observed deformation is as-sociated with the 1989 lava flow, the function dR/dt(r) is maximum for t=r=3.5 yr, and is equal to 25 mm/yr.
On the other hand, a minimum rate of subsidence of
12 mm/yr is given by the values observed at the edges of the lava flows (close to both ends of section A-A' in Figure 4). Relaxation could, thus, account for 25 to 50 % of the subsidence, the other part (22 to 35 mm/yr)
being due to compaction of the recent lava flows. Using a typical thickness of 12 m for the sum of the 1986-87 and 1989 lava flow, given the average rate of subsidence
of 22 mm/yr for the whole area of the lava flows and as-
suming about half of the movement due to compaction,
we find a strain rate of 10
-a yr -i for the compacting
volume. Taking a coefficient
of dilatation of 10
-• for
the basalts, this would imply a decrease of temperatureof 120ø/yr about 4 years after the eruption. This high
value implies that most of the compaction is not of ther- mal origin. In order to check the validity of our analytic model, especially for the amplitude of the signal and
the lateral extension, we ran simulations of the same
problem on two 2D finite element codes (TECTON and ADELI). Our solutions agreed with the predictions of the above model. The numerical simulations were also
used to estimate the amplitude of the expected lateral
bulges (less than 10-15% of the maximum subsidence and thus not detectable in our data) and the contribu-
tion of the horizontal movement to the change of range
(also less than 10-15% of the maximum subsidence, thus negligible as assumed before).
Conclusions
In our study, we show that, using radar interferom-
etry, it was possible to detect a deformation moderate
dR/dr = (2rrohcos,/3Er)exp(-t/r),
(2) in size and amplitude
in an almost
inaccessible
area of
Etna. A process of relaxation of the substrate associ-
where
er0
is the
load
applied
to the
medium,
E Young's
ated
with
the
load
of the 1986-87
and
1989
lava
flow
ex-
modulus, r the Maxwell visco-elastic relaxation time, h
the thickness of the medium and cosc• the cosine di- rector between vertical and range (0.904 for ascend- ing orbits here). The superficial structures of Etna are
characterized by low values of velocities of the seismic
waves that we can convert into low values of the elas- b tic parameters. Using typical values between 1 and 2 c
km/s [Hirn, personal
communication]
for the first kilo-
d
metre, the Young's modulus ranges between 2 GPa and e10 GPa.
Below,
the
increasing
velocities
imply
Young's f
gmodulus
increasing
to about 35 GPa. Due to the fast in-
h
crease of Young's modulus below 1 km, we next assume ithat our model consists of a 1 km thick visco-elastic j
body with a Young's modulus of 2.5 GPa surrounded by a perfect rigid body. The same value for the Young's
modulus has been used by Cayol (1996), for the mod-
Table 1. ERS1 images used in this study
N ø Orb. 1 Date Orb. 2 Date He`rat, Days
5785 23/08/92 9793 30/05/93 153 280 5785 23/08/92 10294 4/07/93 25 315 5785 23/08/92 10795 8/08/93 49 350 5785 23/08/92 11296 12/09/93 35 385 6286 27/09/92 11797 17/10/93 205 385 6787 1/11/92 10294 4/07/93 81 245 6787 1/11/92 11797 17/10/93 51 350 6379 4/10/92 9385 2/05/93 100 210 6379 4/10/92 11389 19/09/93 232 350 6379 4/10/92 11890 24/10/93 108 385
Starting and ending orbit number and dates of each in-
terferogram, altitude of ambiguity in meters (He, rat,) and
40 BRIOLE ET AL.' POST-ERUPTIVE DEFORMATION ON ETNA
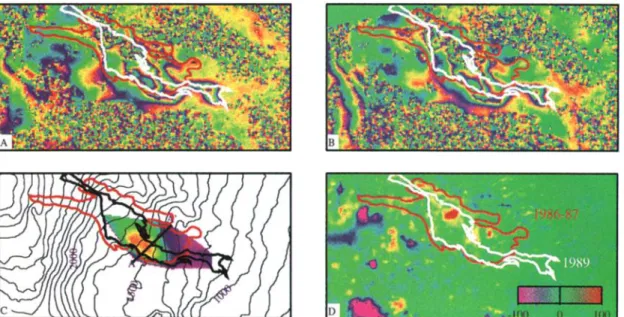
Figure 3. 3a: Interferogram
(e) produced
by CNES
using
the SPOT
DEM. The 1986-87
lava
flow
is reported
in
red and the 1989 one in white; 3b: Same interferogram produced at IPG using the CNR DEM; 3c: Rate of along
range
change
found
by averaging
the values
obtained
on the seven
best
interferograms
after
fringe
unwrapping
and data gridding.
The maximum
rate, in red corresponds
to 47 mm/yr. Section
A-A' refers
to figure
4; 3d:
difference of the two DEM, the scale in meters is given by the palette.
plains 25 to 50 % of the amplitude of the post-eruptive displacements observed on a one year window in 1992- 93. The amplitude of deformation outside the lava flows
is used to show that the relaxation time cannot be very different from the 3.5 years elapsed between the erup-
tion and the data collection. Such a value agrees with
relaxation times observed after other eruptions on Etna and Piton de la Fournaise. The compaction of the lava
flow itself contributes for at least half of the total subsi- dence. This is consistent with Murray's [1988] observa-
tions on Etna after the 1981 eruption. The occurrence
of the large 1991-93 eruption will offer in the next years the opportunity to test our model, with a volume of de- posited lava ten times larger and thus with much larger
deformations expected.
Acknowledgments. We thank I. Contrucci for the fig-
ures, R. Cattin for running two 2D finite element models,
G. Wadge, M. Diament, J.C. Komorowski and an anony-
mous reviewer for very helpful comments. The italian CNR
(Gruppo Nazionale per la Vulcanologia) provided a DEM
of Etna. This work was supported by Matra Cap Systemes
• 50
,
40
30
o 20
:
• '10
•-•
-
•
0
5•
1•
15•
20•
Distrace (m)Figure 4. Rate of range change along a section A-A' (Figure 3) crossing the lava flow in a N4•E •zimuth at
1•00 m a.s.1. The two marks on the curve correspond to the edges of the 1•8• lava field.
in the framework of the European Space Agency contract n
11318/95/I- HGE. IPGP contribution N ø 1456.
References
Azzaro, R. and M. Neri, L'attivitK eruttiva dell'Etna nel corso del ventennio 1971-1991, CNR, IIV, Open File Re-
port, 3/92, 46p., 1992.
Bertagnini, A., S. Calvari, M. Coltelli, P. Landi, M. Pom- pilio and V. Scribano, The 1989 Eruptive sequence, in Mr. Etna: the 1989 eruption, edited by F. Barberi, A. Bertagnini, P. Landi,A. Hayli, pp. 10-22, Giardini, 1990. Cayol, V., Analyse 61astostatique tridimensionnelle du champ de d6formation des 6difices volcaniques par 616- ments frontikres mixtes, Thkse de Doctorat de l'Universit6 Paris VII, pp. 98-100, 1996.
Delorme, H., Apport des d6formations & la compr6hension des mdcanismes 6ruptifs: le Piton de la Fournaise, Th•se de Doctorat d'Etat, pp. 449-467, Universit• Paris VII,
1994.
Massonnet, D., P. Briole and A. Arnaud, Deflation of Mount Etna Monitored by Spaceborne Radar Interferometry, Na- ture, 375, 567-570, 1995.
Massonnet, D. and T. Rabaute, Radar Interferometry: Lim- its and Potential, IEEE Trans. Geosci. Rein. Sensing, 31, 455-464, 1993.
Murray, J.B., The Influence of Loading by Lavas on the Sit-
ing of Volcanic Eruption Vents on Mt Etna, J. Volcanol. Geotherm. Res., 35, 121-139, 1988.
Turcotte, D.L. and G. Schubert, Geodynamics, Application
of Continuum Physics to Geological Problems, 450 pp.,
John Wiley, New York, 1982.
P. Briole, C. Delacourt, Institut de Physique du Globe, 4 Place Jussieu, 75005 Paris, France
D. Masonnet, Centre National d'Etudes Spatiales, 18 Avenue E. Belin, 31055 Toulouse, France
(received August 8, 1996; revised October 7, 1996; accepted October 10, 1996.)