arXiv:1101.4643v2 [astro-ph.EP] 11 May 2011
WASP-40b: Independent Discovery of the 0.6 M
JupTransiting
Exoplanet HAT-P-27b
D.R. Anderson
1, S.C.C. Barros
2, I. Boisse
3,4, F. Bouchy
3,5, A. Collier Cameron
6, F. Faedi
2,
G. Hebrard
3,5, C. Hellier
1, M. Lendl
7, C. Moutou
8, D. Pollacco
2, A. Santerne
8, B. Smalley
1,
A.M.S. Smith
1, I. Todd
2, A.H.M.J. Triaud
7, R.G. West
9, P.J. Wheatley
10, J. Bento
10, B.
Enoch
6, M. Gillon
11, P.F.L. Maxted
1, J. McCormac
2, D. Queloz
7, E.K. Simpson
2, I.
Skillen
12ABSTRACT
From WASP photometry and SOPHIE radial velocities we report the discovery of WASP-40b (HAT-P-27b), a 0.6 MJup planet that transits its 12th magnitude host star every 3.04 days. The
host star is of late G-type or early K-type and likely has a metallicity greater than solar ([Fe/H] = 0.14 ± 0.11). The planet’s mass and radius are typical of the known hot Jupiters, thus adding another system to the apparent pileup of transiting planets with periods near 3–4 days. Our parameters match those of the recent HATnet announcement of the same planet, thus giving confidence in the techniques used. We report a possible indication of stellar activity in the host star.
Subject headings: Extrasolar Planets
1Astrophysics Group, Keele University, Staffordshire,
ST5 5BG, UK; [email protected]
2
Astrophysics Research Centre, School of Mathematics & Physics, Queen’s University, University Road, Belfast, BT7 1NN, UK
3
Institut d’Astrophysique de Paris, UMR7095 CNRS, Universite Pierre & Marie Curie, 75014 Paris, France
4
Centro de Astrof´ısica, Universidade do Porto, Rua das Estrelas, 4150-762 Porto, Portugal
5
Observatoire de Haute-Provence, CNRS/OAMP, 04870 Saint-Michel l’Observatoire, France
6
SUPA, School of Physics and Astronomy, University of St. Andrews, North Haugh, Fife, KY16 9SS, UK
7Observatoire Astronomique de l’Universit´e de Gen`eve
51 ch. des Maillettes, 1290 Sauverny, Switzerland
8
Laboratoire d’Astrophysique de Marseille, 38 rue Frderic Joliot-Curie, 13388 Marseille Cedex 13, France
9
Department of Physics and Astronomy, University of Leicester, Leicester, LE1 7RH, UK
10Department of Physics, University of Warwick,
Coven-try CV4 7AL, UK
11
Institut d’Astrophysique et de G´eophysique, Universit´e de Li`ege, All´ee du 6 Aoˆut, 17, Bat. B5C, Li`ege 1, Belgium
12
Isaac Newton Group of Telescopes, Apartado de Correos 321, E-38700 Santa Cruz de la Palma, Tenerife, Spain
1. Introduction
While the Kepler mission is currently produc-ing the most candidates for transitproduc-ing extraso-lar planets (e.g., Borucki et al. 2010), the ground-based transit-search programs continue to find more planets around stars at brighter magnitudes than those found in the space missions. Of these, Hungarian Automated Telescope Network (HAT-net; Bakos et al. 2004) and Wide Angle Search for Planets (WASP; Pollacco et al. 2006) have been the most successful. Both projects are based on ar-rays of 200 mm f/1.8 lenses backed by CCDs, with the biggest difference being that HATnet operates at several longitudes while WASP consists of one station in each hemisphere. The two projects look at overlapping regions of sky, which has led to some near-simultaneous discoveries, such as the planet WASP-11b (West et al. 2009) also being HAT-P-10b (Bakos et al. 2009). Reporting of such independent discoveries gives important informa-tion on the reliability of the respective techniques and on the completeness of the transit surveys.
HAT-P-27b (B´eky et al. 2011), a hot Jupiter in a 3 day orbit around a mV = 12.2 star. This
planet had been independently discovered by the WASP project and assigned the name WASP-40b (Hellier et al. 2011). We report here on the discovery of WASP-40b made using data from SuperWASP-North and WASP-South com-bined, together with radial velocities from the SO-PHIE spectrograph at the Observatoire de Haute-Provence (OHP) observatory.
2. Observations
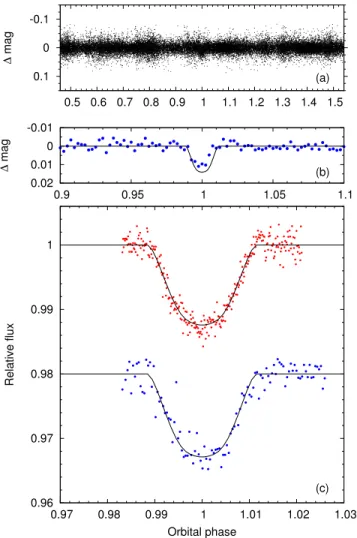
We observed WASP-40, an ∼K0-type star lo-cated in Virgo, with the SuperWASP-North and WASP-South cameras during the three seasons of 2008–2010. A transit search (Collier Cameron et al. 2006) of the resulting 30,260 photometric measure-ments found a strong 3.04 day periodicity. The discovery light curve is displayed in Figure 1a, folded on this period.
Using the SOPHIE spectrograph mounted on the 1.93 m OHP telescope (Perruchot et al. 2008; Bouchy et al. 2009), we obtained eight spectra of WASP-40 during 2010 April and May. The high-efficiency mode and slow readout were used, corresponding to a spectral resolving power of 40 000 and lowest readout noise. We acquired a spectrum in both entrance fibers of the spectro-graph to allow monitoring of and correcting for the sky background. However, over the sequence, this background was low enough that we did not have to apply such a correction. Signal-to-noise ratio values range from 22 to 35, for exposure times of 30 to 43 minutes. Radial-velocity (RV) measurements were computed by weighted cross-correlation (Baranne et al. 1996; Pepe et al. 2005) with a numerical G2 spectral template. To ac-count for systematic effects associated with the high-efficiency mode (e.g., Bouchy et al. 2009), we added an uncertainty of 10 m s−1in quadrature to
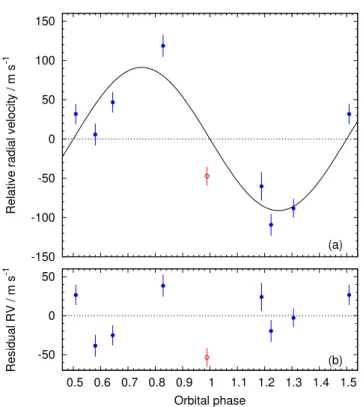
the formal errors. RV variations were detected with the same period found from the transits and with a semiamplitude of 91 m s−1, consistent with
a planetary mass companion. The RV measure-ments are listed in Table 1 and are plotted in Fig-ure 2.
To test the hypothesis that the RV varia-tions are due to spectral line distorvaria-tions caused by a blended eclipsing binary or starspots, we
Fig. 1.— Photometry of WASP-40, with the best-fitting transit model superimposed. (a) WASP discovery light curve, folded on the ephemeris of Table 4. (b) WASP data around the transit, binned in time with a bin width of ∼11 minutes). (c) High-precision transit light curves from Liv-erpool Telescope RISE (top, red) and Euler/C2 (bottom, blue).
Table 1: SOPHIE Radial-Velocity Measurements BJD − 2, 400, 000a RV σ RV BS (km s−1) (km s−1) (km s−1) 55,301.4903 −15.796 0.012 −0.035 55,303.4817 −15.702 0.013 −0.043 55,305.4918 −15.837 0.012 −0.044 55,323.4792 −15.858 0.014 −0.059 55,324.5650 −15.743 0.014 −0.025 55,334.4374 −15.630 0.014 −0.037 55,335.5319 −15.809 0.018 −0.054 55,336.5056 −15.717 0.013 −0.014
a BJD = Barycentric Julian Date (UTC).
Fig. 2.— (a) SOPHIE RVs with the best-fitting circular Keplerian orbit superimposed. The RV represented by an open, red circle was excluded from the analysis, as it was taken during transit. (b) Residuals of the RVs about the fit.
performed a line-bisector analysis (Queloz et al. 2001) of the SOPHIE cross-correlation functions. The lack of correlation between bisector span and RV (Fig. 3) supports our conclusion that the peri-odic dimming of WASP-40 and its RV variations are due to a planet.
To refine the system parameters we obtained high-precision transit photometry. On 2010 June 26 we obtained a full transit of WASP-40 with the RISE (rapid imager to search for exoplanets) high-speed CCD camera mounted on the 2.0 m Liv-erpool Telescope (Steele et al. 2008; Gibson et al. 2008). RISE has a wideband filter of ∼ 500–700 nm, which corresponds approximately to V + R. We obtained 285 exposures in the 2 × 2 binning mode with an exposure time of 35 s and effectively no dead time. To minimize the impact of flat-fielding errors and to increase the duty cycle we defocused the telescope by 1 mm. On 2010 June 30 we observed a full transit of WASP-40 through a Gunn r filter with the C2 camera on the 1.2 m Euler Swiss telescope, which was defocused by 0.1 mm. The seeing ranged from 0.5 to 1.1′′, and air
mass ranged from 1.2 to 1.5 over the course of the 105 exposures. We performed differential photom-etry relative to several stable reference stars, using the ULTRACAM pipeline (Dhillon et al. 2007) for the RISE data and IRAF for the Euler data. The resulting light curves are displayed in Figure 1c. 3. Stellar parameters from spectra
The individual SOPHIE spectra of WASP-40 were co-added to produce a single spectrum with an average S/N of around 60:1. The analysis was performed using the methods given in Gillon et al. (2009). The Hα line was used to determine the ef-fective temperature (Teff), and the Na i D and Mg i
b lines were used as surface gravity (log g) diagnos-tics. The parameters obtained from the analysis are listed in Table 2. The elemental abundances were determined from equivalent-width measure-ments of several clean and unblended lines. A value for microturbulence (ξt) was determined
from Fe i using the method of Magain (1984). The quoted error estimates include those given by the uncertainties in Teff, log g and ξt, as well as the
scatter due to measurement and atomic data un-certainties.
Fig. 3.— Bisector span variation with respect to radial velocity, with approximately the same scale used for each axis. The systemic velocity was subtracted from the radial-velocity values. We adopted uncertainties on the bisector spans that were twice the size of those on the radial velocities.
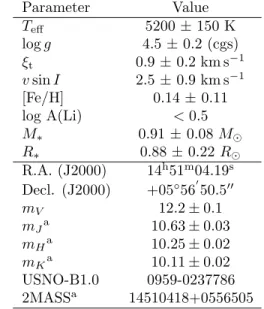
Table 2: Stellar Parameters from Spectra Parameter Value Teff 5200 ± 150 K log g 4.5 ± 0.2 (cgs) ξt 0.9 ± 0.2 km s−1 v sin I 2.5 ± 0.9 km s−1 [Fe/H] 0.14 ± 0.11 log A(Li) < 0.5 M∗ 0.91 ± 0.08 M⊙ R∗ 0.88 ± 0.22 R⊙ R.A. (J2000) 14h51m04.19s Decl. (J2000) +05◦56′ 50.5′′ mV 12.2 ± 0.1 mJa 10.63 ± 0.03 mHa 10.25 ± 0.02 mKa 10.11 ± 0.02 USNO-B1.0 0959-0237786 2MASSa 14510418+0556505 aSkrutskie et al. (2006).
velocity (v sin I) by fitting the profiles of several unblended Fe i lines. For this, we used an in-strumental FWHM of 0.15 ± 0.01 ˚A, determined from the telluric lines around 6300˚A and assumed a value for macroturbulence (vmac) of 1.0 ± 0.3
km s−1(Bruntt et al. 2010).
As a check of our analysis we also estimated the metallicity and v sin I directly from the cross-correlation function of the averaged SOPHIE spec-tra, using the methods described in Boisse et al. (2010). These give [Fe/H] = 0.06±0.09 and v sin I = 3.3 ± 1.0 km s−1, which are in agreement with
our preceding values.
We input our values of Teff, log g and [Fe/H]
into the calibrations of Torres et al. (2010) to ob-tain estimates of the stellar mass and radius (Ta-ble 2).
4. System parameters from RV and tran-sit data
We determined the system parameters from a simultaneous fit to the data described in § 2. The transit light curve was modeled using the formula-tion of Mandel & Agol (2002) with the assumpformula-tion that RP≪R∗. Limb-darkening was accounted for
using a four-coefficient nonlinear limb-darkening model, using fixed coefficients (Table 3) appropri-ate to the passbands and interpolappropri-ated in effective temperature, surface gravity and metallicity from the tabulations of Claret (2000).
The simultaneous fit was performed using the current version of the Markov-chain Monte Carlo (MCMC) code described by Collier Cameron et al. (2007) and Pollacco et al. (2008). The transit light curve is parameterized by the epoch of mid-transit T0, the orbital period P , the planet-to-star
area ratio (RP/R∗)2, the approximate duration
of the transit from initial to final contact T14,
and the impact parameter b = a cos i/R∗ (the
distance, in fractional stellar radii, of the transit chord from the star’s center). The radial-velocity orbit is parameterized by the stellar reflex veloc-ity semiamplitude K∗, the systemic velocity γ,
Table 3: Limb-Darkening Coefficients
Light curve (band) a1 a2 a3 a4
WASP/Euler (RC) 0.714 −0.651 1.335 −0.602 RISE (V J) 0.657 −0.626 1.479 −0.658
and√e cos ω and√e sin ω (Anderson et al. 2011), where e is orbital eccentricity and ω is the argu-ment of periastron.
The linear scale of the system depends on the orbital separation a which, through Kepler’s third law, depends on the stellar mass M∗. At
each step in the Markov chain, the latest val-ues of stellar density ρ∗, effective temperature
Teff and metallicity [Fe/H] are input to the
em-pirical mass calibration of Enoch et al. (2010) to obtain M∗. The shapes of the transit light curve
(Seager & Mall´en-Ornelas 2003) and the radial-velocity curve constrain ρ∗, which combines with
M∗ to give R∗. Teff and [Fe/H] are proposal
parameters constrained by Gaussian priors with mean values and variances derived directly from the stellar spectra (Table 2).
As the planet-star area ratio is constrained by the measured transit depth, RP follows from R∗.
The planet mass MP is calculated from the
mea-sured value of K1 and M∗; the planetary density
ρPand surface gravity log gPthen follow. We also
calculate the blackbody equilibrium temperature
TP,A=0, where A is albedo, assuming efficient
re-distribution of heat from the planet’s presumed permanent day side to its night side.
At each step in the MCMC procedure, model transit light curves and radial-velocity curves are computed from the proposal parameter values, which are perturbed from the previous values by a small, random amount. The χ2statistic is used
to judge the goodness of fit of these models to the data and a step is accepted if χ2 is lower than for
the previous step. A step with higher χ2 is
ac-cepted with a probability exp(−∆χ2/2). To give
proper weighting to each transit and RV data set, the uncertainties are scaled at the start of the MCMC so as to obtain a reduced χ2 of unity.
From an initial MCMC fit for an eccentric or-bit, we found e = 0.13+0.18
−0.10. The improvement
in the fit resulting from the addition of √e cos ω and √e sin ω as fitting parameters is too small to justify adoption of an eccentric orbit. The F -test approach of Lucy & Sweeney (1971) indicates that there is an 84 % probability that the improvement in the fit could have arisen by chance if the under-lying orbit were circular. In the absence of con-clusive evidence to the contrary, we adopted the circular orbit model.
One spectrum of the eight SOPHIE spectra was taken during the start of transit. As we did not fit for the Rossiter-McLaughlin effect (e.g., Queloz et al. 2000) we excluded the resulting RV measurement (BJD = 2,455,301.4903) from our analysis.
The median values and 1 σ uncertainties of the system parameters derived from the MCMC model fit are presented in Table 4. The corresponding transit and orbit models are superimposed on the transit photometry and radial velocities in Fig-ures 1 and 2.
For a transit to be grazing, the grazing criterion (Smalley et al. 2011) must be satisfied:
X = b + RP/R⋆> 1. (1)
For WASP-40b X = 0.9895+0.017−0.014. Figure 4 shows
the MCMC posterior distribution of RP/R∗and b.
A total of 26.4% of these data points satisfy the grazing criterion. Using the odds ratio test (e.g., Kipping et al. 2010), we find a 40.5% probability that the system is grazing.
5. System age
Assuming aligned stellar-spin and planetary-orbit axes, the measured v sin I of WASP-40 and its derived stellar radius (Table 2) indicate a rota-tional period of Prot= 17.8 ±7.8 days. Combining
this with the B − V color of a K0 star from Gray (2008), we used the relationship of Barnes (2007) to estimate a gyrochronological age of 1.2+1.3−0.8Gyr.
Considering that the stellar-spin axis may not be in the sky plane, these are upper limits on the stel-lar rotation period and the gyrochronological age. We found no evidence for rotational modulation in the WASP light curves.
We interpolated the stellar evolution tracks of Marigo et al. (2008) and Bertelli et al. (2008) us-ing ρ∗ from the MCMC analysis and using Teff
and [Fe/H] from the spectral analysis (Fig. 5). This suggests an age of 6 ± 5 Gyr and a mass of 0.83 ± 0.07 M⊙ for WASP-40.
6. Discussion
As we find more exoplanets that transit their host stars we begin to see patterns in their dis-tribution. It is thus important to add new sys-tems to probe such patterns and to understand
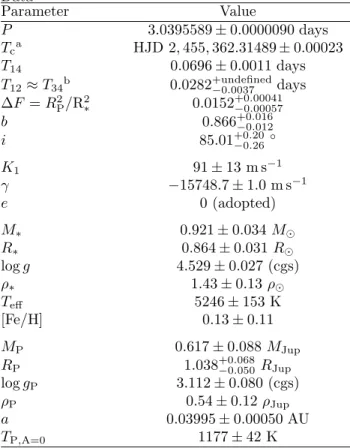
Table 4: System Parameters from RV and Transit Data Parameter Value P 3.0395589 ± 0.0000090 days Tca HJD 2, 455, 362.31489 ± 0.00023 T14 0.0696 ± 0.0011 days T12≈ T34b 0.0282+undefined−0.0037 days ∆F = R2 P/R2∗ 0.0152 +0.00041 −0.00057 b 0.866+0.016−0.012 i 85.01+0.20 −0.26 ◦ K1 91 ± 13 m s−1 γ −15748.7 ± 1.0 m s−1 e 0 (adopted) M∗ 0.921 ± 0.034 M⊙ R∗ 0.864 ± 0.031 R⊙ log g 4.529 ± 0.027 (cgs) ρ∗ 1.43 ± 0.13 ρ⊙ Teff 5246 ± 153 K [Fe/H] 0.13 ± 0.11 MP 0.617 ± 0.088 MJup RP 1.038+0.068−0.050 RJup log gP 3.112 ± 0.080 (cgs) ρP 0.54 ± 0.12 ρJup a 0.03995 ± 0.00050 AU TP,A=0 1177 ± 42 K
a HJD = Heliocentric Julian Date (UTC). b 1 σ upper limit undefined as system is
near-grazing.
Fig. 4.— The MCMC posterior distributions of b and RP/R∗. The solid line indicates the position
of the stellar limb, i.e., b + RP/R∗= 1. A total
of 26.4% of the points lie above the line and are grazing solutions.
the role of selection effects in transit surveys. For example, given the apparent pileup of tran-siting planets with periods near 3–4 days, it is important to investigate the shape of the cut-off toward shorter periods (e.g., Szab´o & Kiss 2011). Further, there are increasing suggestions of correlations between planetary radii, the ir-radiation of the planet and the metallicity of the host star (Enoch et al. 2011; Anderson & Iro 2011, in preparation). For brighter systems, the measurement of the Rossiter–McLaughlin effect allows us to build up statistics of the alignment of planetary orbits (e.g., Triaud et al. 2010), and to thus test suggestions of a correlation between alignment and the spectral type of the host star (Winn et al. 2010).
Since all such comparisons depend on the re-liability of measured parameters of the transit-ing systems, it is worth nottransit-ing that the param-eters of HAT-P-27b/WASP-40b reported here are in good accord with those from the independent study by B´eky et al. (2011). Most parameters agree to within 1 σ errors, while the impact param-eter, which is strongly dependent on the modeling of the transit light curve and the limb-darkening, agrees to within 2 σ. This adds confidence to the methods used by the two projects.
One difference in our analyses is that our radial velocities show more scatter about the model than would be expected from their formal uncertainties (Fig. 6). This could be an indication of stellar ac-tivity. We calculated an activity index suggestive of an active star, log R′
HK = −4.63, directly from
the SOPHIE spectra using the methods described in Boisse et al. (2010). The RV dispersion arising from the stellar activity of a K-type star is esti-mated to be ∼10 m s−1 (Santos et al. 2000).
We note that the radial-velocity data in B´eky et al. (2011), while resulting in a very similar model, do not show a similar scatter, which could indi-cate that the level of stellar activity fluctuates. Alternatively, if the scatter was indicative of an additional planet, the signal may not be present in the radial velocities of B´eky et al. (2011) due to limited sampling. Both the SOPHIE and Keck data sets are sparse, with eight and nine radial velocities, respectively, so more observations are needed to reach a conclusion.
re-Fig. 5.— Modified H-R diagram. The evolu-tionary mass tracks (Z = 0.026 ≈ [Fe/H] = 0.14; Y = 0.30) are from Bertelli et al. (2008). The isochrones (Z = 0.026 ≈ [Fe/H] = 0.14) for the ages 1, 4, 7, and 10 Gyr are from Marigo et al. (2008).
Fig. 6.— Residual radial velocities about the best-fitting circular Keplerian orbit.
ceived funding from the European Community’s Seventh Framework Programme (FP7/2007-2013) under grant agreement number RG226604 (OP-TICON). SuperWASP-N is hosted by the Issac Newton Group on La Palma and WASP-South is hosted by the South African Astronomical Obser-vatory. We are grateful for their ongoing support and assistance. Funding for WASP comes from consortium universities and from the UK’s Science and Technology Facilities Council. We thank Tom Marsh for the use of the ULTRACAM pipeline.
Facilities: SuperWASP, OHP:1.93m, Liver-pool:2m, Euler1.2m
REFERENCES
Anderson, D. R., & Iro, N. 2011, in preparation Anderson, D. R., et al. 2011, ApJ, 726, L19 Bakos, G., Noyes, R. W., Kov´acs, G., Stanek,
K. Z., Sasselov, D. D., & Domsa, I. 2004, PASP, 116, 266
Bakos, G. ´A., et al. 2009, ApJ, 696, 1950 Baranne, A., et al. 1996, A&AS, 119, 373 Barnes, S. A. 2007, ApJ, 669, 1167
B´eky, B., et al. 2011, preprint (arXiv:1101.3511) Bertelli, G., Girardi, L., Marigo, P., & Nasi, E.
2008, A&A, 484, 815
Boisse, I., et al. 2010, A&A, 523, A88 Borucki, W. J., et al. 2010, Science, 327, 977 Bouchy, F., et al. 2009, A&A, 505, 853 Bruntt, H., et al. 2010, MNRAS, 405, 1907 Claret, A. 2000, A&A, 363, 1081
Collier Cameron, A., et al. 2006, MNRAS, 373, 799
—. 2007, MNRAS, 380, 1230
Dhillon, V. S., et al. 2007, MNRAS, 378, 825 Enoch, B., Collier Cameron, A., Parley, N. R., &
Hebb, L. 2010, A&A, 516, A33+ Enoch, B., et al. 2011, MNRAS, 410, 1631
Gibson, N. P., et al. 2008, A&A, 492, 603 Gillon, M., et al. 2009, A&A, 496, 259
Gray, D. F. 2008, The Observation and Analysis of Stellar Photospheres, ed. Gray, D. F. (Cam-bridge: Cambridge Univ. Press)
Hellier, C., et al. 2011, EPJ Web Conf. 11, De-tection and Dynamics of Transiting Exoplan-ets, ed. F. Bouchy, R. D´ıaz, & C. Moutou (Provence: St. Michel l’Observatoire), 01004 Kipping, D. M., et al. 2010, ApJ, 725, 2017 Lucy, L. B., & Sweeney, M. A. 1971, AJ, 76, 544 Magain, P. 1984, A&A, 134, 189
Mandel, K., & Agol, E. 2002, ApJ, 580, L171 Marigo, P., Girardi, L., Bressan, A., Groenewegen,
M. A. T., Silva, L., & Granato, G. L. 2008, A&A, 482, 883
Pepe, F., et al. 2005, The Messenger, 120, 22 Perruchot, S., et al. 2008, Proc. SPIE, 7014, 17 Pollacco, D., et al. 2008, MNRAS, 385, 1576 Pollacco, D. L., et al. 2006, PASP, 118, 1407 Queloz, D., Eggenberger, A., Mayor, M., Perrier,
C., Beuzit, J. L., Naef, D., Sivan, J. P., & Udry, S. 2000, A&A, 359, L13
Queloz, D., et al. 2001, A&A, 379, 279
Santos, N. C., Mayor, M., Naef, D., Pepe, F., Queloz, D., Udry, S., & Blecha, A. 2000, A&A, 361, 265
Seager, S., & Mall´en-Ornelas, G. 2003, ApJ, 585, 1038
Skrutskie, M. F., et al. 2006, AJ, 131, 1163 Smalley, B., et al. 2011, A&A, 526, A130+ Steele, I. A., Bates, S. D., Gibson, N., Keenan, F.,
Meaburn, J., Mottram, C. J., Pollacco, D., & Todd, I. 2008, Proc. SPIE, 7014, 217
Szab´o, G. M., & Kiss, L. L. 2011, ApJ, 727, L44 Torres, G., Andersen, J., & Gim´enez, A. 2010,
A&A Rev., 18, 67
Triaud, A. H. M. J., et al. 2010, A&A, 524, A25 West, R. G., et al. 2009, A&A, 502, 395
Winn, J. N., Fabrycky, D., Albrecht, S., & John-son, J. A. 2010, ApJ, 718, L145
This 2-column preprint was prepared with the AAS LATEX
![Fig. 5.— Modified H-R diagram. The evolu- evolu-tionary mass tracks (Z = 0.026 ≈ [Fe/H] = 0.14;](https://thumb-eu.123doks.com/thumbv2/123doknet/5477425.130152/7.918.85.444.219.470/fig-modified-diagram-evolu-evolu-tionary-mass-tracks.webp)
