1
Developing the Detectability, Identifiability, and Trackability Analysis for the Space Sustainability Rating
by Riley Steindl
S.B. Mechanical Engineering
Massachusetts Institute of Technology, 2019 Submitted to the
Department of Mechanical Engineering
in Partial Fulfillment of the Requirements for the Degree of Master of Science in Mechanical Engineering
at the
Massachusetts Institute of Technology February 2021
© 2021 Riley Steindl. All rights reserved.
The author hereby grants to MIT permission to reproduce and to distribute publicly paper and electronic copies of this thesis document in whole or in part in any medium now known or
hereafter created.
Signature of Author:
Department of Mechanical Engineering January 15, 2021 Certified by:
Danielle R. Wood Benesse Corp. Career Development Assistant Prof of Research in Education Program in Media Arts & Sciences and Department of Aeronautics & Astronautics Thesis Supervisor Accepted by:
Nicolas Hadjiconstantinou Professor of Mechanical Engineering Chairman, Committee on Graduate Students
3
Developing the Detectability, Identifiability, and Trackability Analysis for the Space Sustainability Rating
by Riley Steindl
Submitted to the Department of Mechanical Engineering on January 15, 2021 in Partial Fulfillment of the
Requirements for the Degree of Master of Science in Mechanical Engineering Abstract
Three of the core activities in maintaining Space Situational Awareness (SSA) efforts are the Detection, Identification, and Tracking of Anthropogenic Space Objects (ASOs). For much of the space age, the onus for improving global SSA has fallen primarily on the ground-based satellite surveillance and tracking community, leading to more technically advanced and powerful sensing systems. With the focus on improving sensor design for SSA purposes, designers of surveillance and tracking systems have been able to push the envelope of observing increasingly smaller ASOs. Meanwhile, ventures in the use of nanosatellite and picosatellite architectures for commercial business models have become increasingly popular due to their lower material and launch costs. The proliferation of these small ASOs has made it easier than ever to add to the orbital population while also stretching thin the increasingly taxed ground-based sensing systems on which the world depends for SSA. With the number of ASOs in orbit increasing rapidly, effort is required from both the sensing and satellite communities to ensure that humans can maintain adequate SSA for the foreseeable future. To aid in these efforts, the Detectability, Identifiability, and Trackability (DIT) analyses have been developed through this thesis work to quantitatively assess how difficult it is to detect, identify, and track ASOs from the Earth as a function of orbital and spacecraft characteristics. The DIT analysis first assumes a fictional network of medium quality ground-based sensors with optical and radar observation capabilities that are distributed in geographic locations around the world providing excellent coverage in high, middle and low latitudes. The Detectability analysis utilizes geometric approximations of the shape of an ASO, along with its orbital parameters, to produce estimates of its visual magnitude and probability of detection by radar, in order to determine whether or not an ASO is likely to be detectable by the assumed ground sensor
4
network. The Trackability analysis characterizes how the ASO’s orbit interacts with the generically defined ground sensor network over time. Utilizing access statistics for both optical and radar sensing modes, the Trackability analysis calculates the percentage of the orbit that is tracked by the network, average time between ground sensor access and the duration of the access. These metrics inform how much information is available to improve state estimation for the ASO. Finally, for the Identifiability analysis, the vision is to describe how difficult it would be for an uninformed observer to determine if a given ASO can be matched to a known record in a catalog of space objects. The author has been exploring an approach proposed by Professor Moriba Jah of the University of Texas at Austin based on clustering analysis of ASO orbital angular momentum data. Currently this analysis is limited to the population size data for each cluster, but work is underway to incorporate ASO characteristic data. The goal of including characteristic data is to consider groups of satellites that share common characteristics as sharing a so-called “orbital zip code”. The analysis asks how many objects within a given orbital zip code are indistinguishable from the ASO based on data that can be observed by a ground observer with no prior information about the ASO. This paper delves into the specifics of the analysis and discusses the current plans for its implementation. While still a work-in-progress, work is underway to address the limitations of the analysis and improve its functionality. The author has also been working closely with the developers of the Space Sustainability Rating (SSR), an initiative to create an incentive system to reward operators of satellites that take actions to reduce space debris and collision risk. The methods from the DIT analysis will be used as one of the scoring inputs for the Space Sustainability Rating.
5
A
CKNOWLEDGEMENTSI would not have been able to complete this thesis without the support I received from my family, friends, advisors, mentors, and research associates. I would like to take this opportunity to thank everyone who helped succeed.
I would first like to thank my family for providing love and support throughout the research and writing process. Thank you, Mom and Dad, for always telling me how proud you are of my endeavors and for offering positive encouragement to me throughout my studies. Jenny and Megan, thank you as well for your love and support and for the fun times we had together whenever I needed a break from my work.
Second, I would like to thank those who advised me throughout my thesis work. Thank you, Danielle Wood, my research advisor, for constantly helping me throughout my research experience by connecting me with experts in different fields and for always offering positive and constructive feedback. I would also like to thank Moriba Jah, who co-advised me on my work and helped produce the inspiration for this project. I have thoroughly enjoyed working with you both and hope I have the opportunity to work with each of you in the future.
Thank you to all the experts who took the time to meet with me and help me learn more about the many fields of research related to my work, each of you provided valuable input and without your advice my work would not have been successful. Additionally, I would like to thank my fellow members of the Space Enabled Research Group. Thank you for all of your helpful feedback and support throughout my research, and for opening my eyes to a multitude of new and interesting topics surrounding human activities in space.
Finally, I would like to thank Lauren Johnson for being with me every step of the way. Thank you so much for your love and support, and for the opportunities to escape from my work on our many adventures together.
7 Table of Contents
Acknowledgements ... 5
1. Background ... 13
1.1 Space Debris ... 13
1.2 Space Situational Awareness & Space Domain Awareness ... 14
1.3 The Space Sustainability Rating... 15
2. Literature Review ... 17
2.1 Related Research ... 17
2.1.1 Detection and Observation Models... 17
2.1.2 Identification and Tracking Models ... 18
2.2 Detection ... 18
2.2.1 Optical Sensors ... 19
2.2.2 Radar Sensors ... 23
2.3 Identification ... 28
2.3.1 The Basics of Identification ... 28
2.3.2 Nair’s Clustering Analysis: Defining Orbital Zip Codes ... 29
2.4 Tracking ... 32
2.4.1 Basics of Tracking ... 32
2.4.2 Key Metrics ... 32
3. Study Scope and Assumptions ... 35
4. Methods ... 37
4.1 Detectability ... 39
4.1.1 Sensor Architecture & Metric Selection ... 39
4.1.2 Optical Detection Tests ... 40
4.1.3 Radar Detection Tests ... 42
8
4.2 Identifiability ... 47
4.3 Trackability... 48
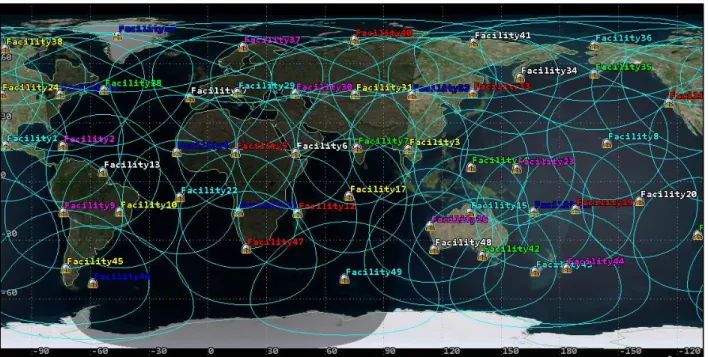
4.3.1 Defining a Generic Ground Sensor Network... 49
4.3.2 Access Analyses ... 51
4.3.3 Translating Trackability Metrics into Scores ... 51
4.4 Questionnaire Portions for DIT ... 59
4.5 Verification ... 60 5. Results ... 61 5.1 Analysis Framework ... 61 5.2 Detectability Analysis ... 62 5.3 Identifiability Analysis ... 63 5.4 Trackability Analysis... 63 5.5 DIT Questionnaire ... 65 5.6 Case Studies... 66 5.6.1 MicroMAS ... 66 5.6.2 Sentinel 2A ... 71 5.6.3 MiRaTA ... 77 5.6.4 IntelSat-36 ... 82 5.6.5 CYGNSS ... 87 5.6.6 SMAP ... 92 6. Discussion ... 99 7. Limitations ... 107
7.1. Limitations in the Detectability Analysis... 107
7.2 Limitations in the Identifiability Analysis ... 107
9
8. Future Work ... 111
8.1 Future Work in the Detectability Analysis ... 111
8.2 Future Work in the Identifiability Analysis ... 111
8.3 Future Work in the Trackability Analysis ... 112
9. Conclusions ... 113
9.1 The Detectability Analysis ... 113
9.2 The Identifiability Analysis ... 114
9.3 The Trackability Analysis ... 114
9.4 Final Thoughts ... 115
10. References ... 117
Appendix ... 122
List of Figures Figure 1: Diagram of the Path of Light During the Passive Optical Detection Process ... 19
Figure 2: Equations for estimating the limiting magnitude of an optical system [27–29] ... 21
Figure 3: Diagram of the Radar Detection Process ... 24
Figure 4: Equation for probability of detection [28] ... 26
Figure 5: 3D Plots of orbital clusters in h-space from resulting from Nair’s analyses ... 30
Figure 6: Distribution of orbital zip code populations from Nair’s clustering analysis ... 31
Figure 7: STK User Interface During ASO Access Calculations ... 40
Figure 8: Generic Ground Sensor Network used in the Trackability Analysis ... 50
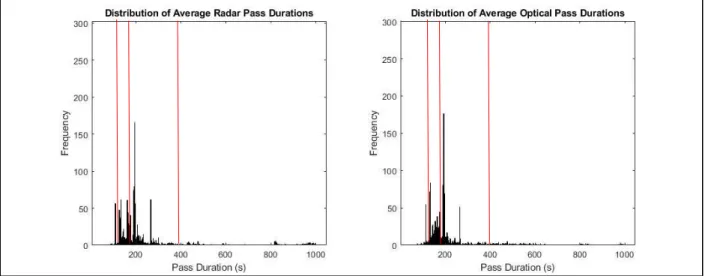
Figure 9: Full distribution of average pass durations for Celestrak active satellites ... 53
Figure 10: Cropped version of distribution in Figure 8 to show detail between 0s and 300s ... 53
Figure 11: Distributions of average orbital coverage percentage for Celestrak active satellites .. 55
Figure 12: Distribution of ephemeris ages for Celestrak active satellites on 11NOV2020 ... 56
Figure 13: Distributions of ephemeris ages for Celestrak active satellites 20OCT2020-22OCT2020 ... 56
10
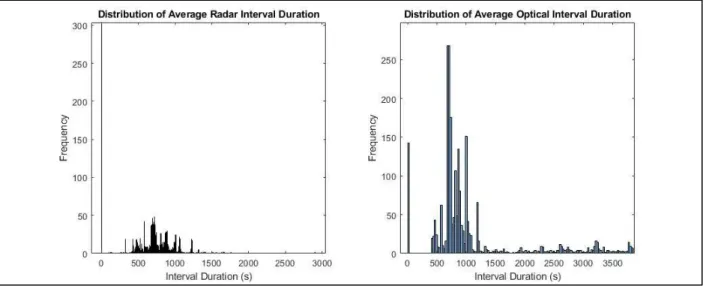
Figure 15: Cropped distributions of average interval durations to show detail between 0s and 3000s
... 58
Figure 16: Flow charts showing workflows for each of the DIT analyses ... 61
Figure 17: 3D rendering of MicroMAS [65] ... 67
Figure 18: STL Model of MicroMAS used in the Detectability Analysis ... 67
Figure 19: MicroMAS RCS at 450MHz for Full 360deg (left) and Bottom/Nadir 180deg (right) ... 68
Figure 20: MicroMAS Probability of Radar Detection Over Time ... 69
Figure 21: Visualization of MicroMAS Access Intervals Suitable for EOIR Observation ... 70
Figure 22: Visual Magnitude Data for MicroMAS over 7 Passes ... 70
Figure 23: 3D rendering of Sentinel 2A [66] ... 72
Figure 24: STL rendering of Sentinel 2A used in the Detectability Analysis ... 73
Figure 25: Sentinel 2A RCS at 450MHz for Full 360deg (left) and Bottom/Nadir 180deg (right) ... 73
Figure 26: Sentinel 2A Probability of Radar Detection Over Time ... 74
Figure 27: Visualization of Sentinel 2A Access Intervals Suitable for EOIR Observation ... 75
Figure 28: Visual Magnitude Data for Sentinel 2A over 6 Passes ... 76
Figure 29: 3D rendering of MiRaTA [68] ... 77
Figure 30: STL rendering of the MiRaTA satellite used in the Detectability testing ... 78
Figure 31: MiRaTA RCS at 450MHz for Full 360deg (left) and Bottom/Nadir 180deg (right) .. 79
Figure 32: MiRaTA Probability of Radar Detection Over Time ... 80
Figure 33: Visualization of MiRaTA Access Intervals Suitable for EOIR Observation ... 81
Figure 34: Visual Magnitude Data for MiRaTA over 6 Passes ... 81
Figure 35: 3D rendering of IntelSat-36 [69] ... 83
Figure 36: STL Rendering of IntelSat-36 used in the Detectability analysis ... 83
Figure 37: IntelSat-36 RCS at 450MHz for Full 360deg (left) and Bottom/Nadir 180deg (right)84 Figure 38: IntelSat-36 Probability of Radar Detection Over Time ... 85
Figure 39: Visual Magnitude Data for IntelSat-36 over 6 Passes ... 86
Figure 40: 3D rendering of a CYGNSS satellite [70] ... 87
Figure 41: STL rendering of CYGNSS used in the Detectability testing ... 88 Figure 42: CYGNSS RCS at 450MHz for Full 360deg (left) and Bottom/Nadir 180deg (right) . 89
11
Figure 43: CYGNSS Probability of Radar Detection Over Time... 90
Figure 44: Visual Magnitude Data for CYGNSS over 6 Passes ... 91
Figure 45: 3D rendering of SMAP [71] ... 92
Figure 46: STL rendering of SMAP used in the Detectability analysis ... 93
Figure 47: SMAP RCS at 450MHz for Full 360deg (left) and Bottom/Nadir 180deg (right)... 94
Figure 48: SMAP Probability of Radar Detection Over Time ... 95
Figure 49: Visual Magnitude Data for SMAP over 3 Passes... 96
List of Tables Table 1: Limiting magnitudes for 12 different optical aperture sizes ... 21
Table 2: Statistics for the distribution of orbital zip code population sizes ... 31
Table 3: Experts Consulted Throughout DIT Analysis Development ... 38
Table 4: Summary of Catalogued [58] and Simulated Visual Magnitude Verification Data ... 41
Table 5: Summary of RCS Verification Data ... 43
Table 6: Detectability Testing Radar Specifications ... 45
Table 7: Summary of Detectability Scoring Criteria ... 47
Table 8: Overview of Scoring Cutoff Values for Trackability ... 59
Table 9: RCS Values for MicroMAS at 450MHz ... 68
Table 10: Trackability Results and Score for MicroMAS ... 71
Table 11: RCS Values for Sentinel 2A at 450MHz ... 74
Table 12: Trackability Results and Score for Sentinel 2A ... 77
Table 13: RCS Values for MiRaTA at 450MHz ... 79
Table 14: Trackability Results and Score for MiRaTA ... 82
Table 15: RCS Values for IntelSat-36 at 450MHz ... 84
Table 16: Trackability Results and Score for IntelSat-36 ... 87
Table 17: RCS Values for CYGNSS at 450MHz ... 89
Table 18: Trackability Results and Score for CYGNSS ... 92
Table 19: RCS Values for SMAP at 450MHz ... 94
Table 20: Trackability Results and Score for SMAP... 97
Table 21: Summary of Catalogued and Simulated Visual Magnitudes ... 99
12
Table 23: Summary of Optical Trackability Statistics ... 102
Table 24: Summary of Optical Trackability Ratings/Scores ... 103
Table 25: Summary of Radar Trackability Statistics ... 103
Table 26: Summary of Radar Trackability Ratings/Scores ... 104
Table 27: Satellites and DIT Component Ratings/Scores... 106
Glossary of Terms
Anthropogenic Space Object (ASO): any object in orbit around the Earth resulting from human
spaceflight and satellite activities
Detectability: the level of difficulty with which of an observer without prior knowlegde of an ASO
can accurately and reliably detect the ASO’s presence with remote sensors
Identifiability: the level of difficulty with which an observer without prior knowledge of an ASO can accurately and reliably identify the ASO with remote sensors
Optical Detection: used in this work to refer to the passive detection of ASOs using visual light sensing equipment which collects sunlight reflected off of an ASO’s surfaces
Orbital Zip Code: analytically defined cluster of ASOs which share similar orbital characteristics
Radar Detection: used in this work to refer to the active detection of ASOs using radio detection and ranging equipment which sends and receives a radar signal to detect an ASO
Trackability: the level of difficulty with which an observer without prior knowledge of an ASO can accurately and reliably predict the ASO’s orbital parameter
13
1.BACKGROUND
With many countries, companies, and organizations expanding their operations in the space domain, questions surrounding the safety and sustainability of these enterprises have been raised. How can we safely manage the state of the orbital environment? How long can all of these individual actors continue to send objects into space before it becomes too crowded/dangerous for future use? These questions and more plague space policymakers who understand both the vast opportunities possible through human activity in space and the very delicate balance that must be struck in order to allow for these activities. The Space Sustainability Rating (SSR) is under development by a team led by the Space Enabled Research Group at MIT, along with a team from the European Space Agency (ESA), the World Economic Forum, Bryce Space and Technology, and Prof Moriba Jah from the University of Texas at Austin [1]. The goal of the SSR is to provide actors in the space domain with a rating system to guide them towards design decisions and operating behaviors that will help keep space safe for human use long into the future. The work presented in this paper describes one of the six core analysis modules for the SSR, the Detectability, Identifiability, and Trackability (DIT) module. The purpose of the DIT module is to estimate and quantify the difficulty that is expected when detecting, identifying, and tracking an object when it is in orbit. This section introduces and discusses some of the background information for the SSR and provides context for the DIT analysis.
1.1 Space Debris
According to ESA’s annual Space Environment Report, at the end of 2019 there were over 25,000 catalogued objects in orbit around the Earth as a result of human space activities [2]. Consisting of rocket bodies, satellite payloads, and fragments of other such Anthropogenic Space Objects, these entities make up the space debris population in orbit around the Earth. Throughout this thesis the term Anthropogenic Space Object (ASO) will be used interchangeably to denote a satellite or any other object in space or being sent to space by human activity. This term was coined by Dr. Moriba Jah, an expert in the field of space situational awareness (SSA) and space domain awareness (SDA) who currently serves as an Associate Professor of Aerospace Engineering and Engineering Mechanics at the University of Texas at Austin and who served as a co-advisor for this thesis.
In practice, tracking and cataloguing the behavior of ASOs is one of the many difficult tasks associated with maintaining an understanding of the space environment and allowing humans
14
to safely operate in space. Since the start of human exploration of space in the late 1950s, there has been more debris than operational objects in space [2]. As human exploitation of the space environment continued, the size of the ASO population has steadily grown to what it is today. In the 1970s, scientists analyzing the orbital environment around the Earth and the steady growth of the ASO population posited a possible phenomenon wherein a series of collisions and explosions of ASOs in orbit could create a chain reaction of further debris-producing events which would lead to an exponential growth in the ASO population and eventually make spaceflight too dangerous [3]. As the ASO population has grown and will continue to grow more rapidly as new satellite mega-constellations are put into orbit, the risk of such a destructive orbital event has and will continue to grow.
In order to reduce the probability of such events, individuals and organizations in the spaceflight community have long called for international regulation and cooperation. Laws and regulations currently exist as a framework for cooperative space activities and participation, but as the space environment grows more complex so does the need for more advanced resources and guidelines for how actors should approach the space environment [4]. It is for this reason that the World Economic Forum’s Global Future Council on Space Technologies has come forth with the concept of the Space Sustainability Rating (SSR) to encourage best practices in space in a non-regulatory matter. Taking cues from other non-non-regulatory standards such LEED, a worldwide rating system for sustainable buildings, the SSR will lay the foundation for collaboration and cooperation between countries and companies by providing a useful tool upon which assessments of the responsible use of space can be made [5]. The SSR team is also taking cues from the STARS and SAFA rating systems, which address sustainability for universities and agricultural systems [6].
1.2 Space Situational Awareness & Space Domain Awareness
Space situational awareness (SSA) and space domain awareness (SDA) are two commonly used terms to describe the development and maintenance of human understanding of the space environment, in particular the orbital environment surrounding the Earth. According to Brian Weeden of the Secure World Foundation, “SSA is the ability to accurately characterize the space environment and activities in space [7].” Similarly, according to the Centauri Corporation “SDA encompasses surveillance, detection, tracking, identifying, and characterizing objects in Earth
15
orbit and beyond [8].” In reality, SSA and SDA describe the same concept and SDA is a newer term intended to be used as a replacement for SSA. As stated in the definition above, the concepts of detection, tracking, and identification make up the core of Space Domain Awareness, so the DIT analysis is one of the key ways that the Space Sustainability Rating addresses Space Domain Awareness.
Evident in the definitions of SSA and SDA is a focus on the development of sensing capabilities to enhance human understanding of the space environment. By centering the DIT analysis on the ASOs, the SSR is shifting some of the onus in enhancing SSA/SDA onto the satellite and mission design side of the equation. Since the start of the space age so much effort has been put into advancing sensor capabilities that satellite designers and operators have not always considered how their design decisions impact SSA/SDA to the highest extent. In fact, some operators have tested the lower limits of human SSA/SDA by designing and launching smaller and smaller ASOs such as Swarm Technologies with their SpaceBEE picosatellites [9]. Utilizing a 0.25U CubeSat architecture, the SpaceBEEs are more efficient and less costly to produce but their small size makes them more difficult to detect. With the space environment becoming increasingly congested the inclusion of the DIT analysis in the SSR will allow the space community to take a closer look at how ASO design decisions impact Space Domain Awareness efforts.
1.3 The Space Sustainability Rating
In 2018, the World Economic Forum’s Global Future Council on Space Technology unveiled its concept of the Space Sustainability Rating and issued an open call for design proposals from teams interested in undertaking its development [1]. The following year, at the Satellite 2019 Conference, the Forum announced that the SSR would be developed by a consortium of contributors, including the European Space Agency, the University of Texas at Austin, and Bryce Space and Technology, and the Space Enabled Research Group at the MIT Media Lab. The SSR has been constructed to align with the Guidelines on the Peaceful Uses of Outer Space of the United Nations Committee of the Peaceful Uses of Outer Space adopted in 2019 [10]. The spirit of these guidelines is to ensure that outer space activities are sufficiently regulated at the national and international level to make sure that all actors are doing their part to keep the space domain safe for use by all. Similar to how the SSR shifts some focus from the sensors to the ASOs in the SSA/SDA equation, the SSR acts to encourage operators of satellite missions to take actions that
16
contribute to the long-term sustainability of space even if this is not formally required by national government regulation.
The current version of the SSR under development by the consortium consists of six modules that touch on different decision areas in the satellite mission design process [11]. These modules include the Mission Index to calculate the mission’s Space Traffic Footprint; Collision Avoidance; Data Sharing; Detectability, Identifiability, and Trackability; Application of Standards, and External Services. The Mission Index is a set of analyses conducted to estimate an ASO’s “space traffic footprint” which describes the impact that a space mission has on the space environment and other missions by increasing the risk of collisions or debris generation [11]. Collision Avoidance considers the capability of satellites within a mission to maneuver (modeled as part of the Mission Index calculation), the capability of operators to coordinate on collision risk assessment, and the availability of operators to respond to information generated by SSA service providers. The Data Sharing module gives operators credit for the amount of data on their ASO, such as ephemeris and characteristic data, that they are willing to share publicly or privately with the SSA service providers, regulatory bodies, and other operators. The Detectability, Identifiability, and Trackability module, which is the subject of this thesis, seeks to analyze the physical design of a spacecraft and its intended orbit to objectively estimate how difficult it will be to detect, identify, and track a rated ASO based on a set of assumptions about the ground-sensor network. The Application of Standards module evaluates a given satellite mission’s compliance with national and international regulations and published standards documents, and finally the External Services module assesses any design decisions that could allow future servicing or deorbiting spacecraft to interface more easily with the ASO. An ASO will receive a score for each of these modules which will then be weighted, summed, and compared to a set of tiers to give its final sustainability rating. For more specific information please see the paper from IAC 2020 by Rathnasabapathy et al. [12].
The Detectability, Identifiability, and Trackability analyses represent one of the main ways that the SSR assesses and gives credit for the design decisions that affect the SSA/SDA attributes of an ASO’s mission. With the orbital environment getting increasingly crowded, being able to confidently detect, identify, and track ASOs is very important to anti-collision efforts and collision probability estimates. For this reason, the DIT analysis in its current and future states will be a valuable tool for understanding the impact of different design decisions on space sustainability.
17
2.LITERATURE REVIEW
Since the dawn of the Space Age in the late 1950s, the concepts of detecting, identifying, and tracking manmade and natural objects in space have been central to human activities in space. In this section, literature and relevant information is presented for each of the core analyses of the DIT analysis module of the SSR.
2.1 Related Research
In order to better express the goal of formulating the DIT analysis this section discusses a handful of ASO modeling efforts aimed at understanding how humans can maintain better knowledge of activities in space. This discussion highlights the fact that most modeling efforts use simulations to inform future developments in SDA technology and methods. The purpose of highlighting this fact is to show the potential utility of the DIT modeling which is designed to use similar modeling techniques to analyze how the physical and orbital designs of ASOs affect SDA efforts.
2.1.1 Detection and Observation Models
There have been multiple studies done to model the detection capabilities of active and proposed space surveillance networks. Two such studies are a study by the Naval Research Laboratory (NRL) and another by Forrest Gasdia, a Masters student at Embry-Riddle, which utilize modeling to propose future sensor network architectures capable of tracking small ASOs and debris. The NRL study uses sensor modeling to explore the concept of a nanosatellite or CubeSat-based observation system capable of detecting small objects and debris [13]. The study by Gasdia uses other modeling techniques to design and propose a viable ground-based sensor network capable of characterizing and tracking small ASOs and debris [14]. These two studies, along with others from the field, illustrate the fact that the primary focus of sensor modeling efforts are to determine what sensor and network architectures might prove useful in the future expansion of SDA capabilities.
Another sensor modeling study different from most was conducted by members of Analytical Graphics, Inc., J.T. McGraw and Associates, and the Commercial Space Operations Center. In this study, North et al. utilized sensor and ASO modeling techniques to assess the brightness envelope of Starlink spacecraft [15]. This study represents one use of detection and
18
observation modeling in the spirit of the DIT analysis, and partially inspired the author’s use of AGI’s Systems ToolKit modeling software in this thesis.
2.1.2 Identification and Tracking Models
Similar to models of the detection and observation of ASOs, there are many studies that use modeling to analyze and simulate the processes of ASO identification and tracking. In one such study, Vallado and Griesbach model various space surveillance networks to better understand their tracking capabilities [16]. In another study, Kelso utilizes orbital modeling to explore the challenges associated with identifying recently launched ASOs [17]. Additionally, in other studies Vallado and others utilize orbital modeling tools to analyze the orbit determination process and develop observation strategies that maximize the accuracy of orbital determinations [18,19]. While very useful, these studies do not utilize available modeling technology to analyze how the design choices made in the ASO mission development process affect these SDA efforts. The DIT analysis seeks to do precisely that by employing similar modeling techniques to answer the question of how different ASO mission design decisions can affect the SDA community’s ability to detect, identify, and track a new ASO.
2.2 Detection
The first step in understanding the behavior of objects in space is to detect their presence. As discussed in Kennewell and Vo’s “An Overview of Space Situational Awareness”, the two predominant modes of sensing and detecting objects in space are radar and optical [20]. Within each of these detection modes there are a range of sensor architectures and capability levels. Both optical and radar systems can be operated in passive and active manners, meaning that they can be operated by passively receiving signals and analyzing the collected data for indications of detectable objects, or that they can be operated by actively sending a source signal towards an object and then analyzing the return signal. As such, this section will delve into the general theory behind each mode as well as past and current literature on what capabilities exist and are being developed for each type of sensing. Active sensing is generally used for identification and tracking, which are discussed in Sections 2.3 and 2.4.
19
2.2.1 Optical Sensors
Optical sensing of objects in space took its first and most basic form when humans first began looking up at the night sky, the naked eye. In the millennia since then, humans have developed technology to aid in the collection of optical data from objects in space. Contemporary optical technology utilizes precisely calibrated mirrors and lenses to focus light onto digital light sensors that collect and store data on what the system sees. In practice, optical sensors used for satellite tracking range from small, inexpensive, and commercial off-the-shelf (COTS) telescopes that can be operated by anyone to large, multi-million-dollar optical systems operated by governments and corporations [21]. In this section, the basic process behind optical detection is discussed along with references to literature used as guidance throughout the development of the Detectability analysis.
Optical detectors of any type function by converting incoming light into an electromagnetic signal [22]. When detecting objects in space from the Earth, optical detection starts with a light source emitting light towards the object subject to detection. This light then reflects off of the surface of the object and some of the reflected light is directed towards the optical sensor apparatus. When the light reaches the optical system, it is passively collected by an opening, called the aperture, and is focused onto a sensor that converts the light into an array of signals that are then processed into the relative brightnesses of the objects in the sensor’s field of view. Figure 1 (below) shows a simple illustration of this process.
Figure 1: Diagram of the Path of Light During the Passive Optical Detection Process
(3) Light enters the aperture and is focused onto the sensor Sun
Optical System ASO (1) Light is emitted from the Sun towards the ASO.
(2) Light reflects off surfaces of the ASO
20
Typically, in satellite observations, the light source used by observers is the Sun, but there are also more advanced commercial and government systems that use finely tuned laser systems to illuminate the target object [23]. For the purposes of the Detectability analysis, the sunlit case used, as it is currently the most commonly used method.
Quantifying Brightness: Visual Magnitudes
The most commonly used metric to characterize the brightness of objects in space is known as visual magnitude. The visual magnitude scale is a standardized logarithmic scale in which each 1-unit increase in magnitude corresponds to a roughly 2.5 times decrease in brightness [24]. It is important to note that, while slightly counterintuitive, higher visual magnitudes correspond to dimmer objects. Originally used to characterize celestial objects such as stars and planets, the visual magnitude scale is also used to describe the optical characteristics of Anthropogenic Space Objects (ASOs) in orbit around the Earth. Typically, the visual magnitudes of the brightest ASOs have visual magnitudes between 0th and 4th magnitude, and the dimmest have visual magnitudes between 12th and 18th magnitude [25]. 0th magnitude corresponds roughly to the brightness of Vega, one of the brighter stars in the night sky. This practice of optically characterizing ASOs makes visual magnitude a practical metric to determine if an ASO is likely to be observed or not. Quantifying Detectability: Limiting Magnitudes
In order to determine if an optical system is capable of detecting an object of a given magnitude, the visual magnitude of the target object must be compared to the limiting magnitude. The limiting magnitude of an optical system refers to the visual magnitude of the dimmest magnitude that it can detect [26]. Assuming ideal viewing conditions, the limiting magnitude of an optical system is a function of many variables such as the quality and number of lenses and mirrors that it employs, but the most important variable is the size of its aperture. Figure 2 (below) shows two methods for estimating the maximum limiting magnitude of an optical system based on its aperture size.
21
Figure 2: Equations for estimating the limiting magnitude of an optical system [27–29]
Likewise, Table 1 (below) shows the limiting magnitude estimates from both methods for a series of different aperture sizes.
Table 1: Limiting magnitudes for 12 different optical aperture sizes
For the Optical Detectability analysis, the concept of limiting magnitudes defines cutoffs for whether or not an object is detectable. The procedure selects an appropriate aperture size and use its limiting magnitude as a visual magnitude cutoff value. The following subsection discusses literature on optical sensor sizes appropriate for satellite detection to provide context for the cutoff value selected for Optical Detectability later in this work.
22 Sensor Sizes Necessary for Optical Satellite Detection
Prior to the space age, most all of the telescopes in use were designed for observing celestial objects. In order to detect increasingly distant stars and galaxies, scientists required optical telescopes with increasingly larger apertures and tighter fields of view that could be pointed to target smoving or relatively stationary objects in the sky. When it came time to track low-orbiting satellites, these standard specifications for optical systems changed. This shift in telescope implementation has led to an entirely new set of governing principles in the design of optical telescopes for use in satellite detection applications.
Firstly, because ASOs are closer to the Earth, their visual magnitudes are typically brighter than the distant objects being observed in the astronomy community. This meant that the optical systems used to track them did not need to be nearly as large. Whereas typical high-end astronomical telescopes are designed with aperture sizes ranging from 3 to 10 meters, studies have been conducted to prove that most ASOs can be effectively detected and tracked with automated telescopes that have apertures less than 1 meter, and in some cases less than 0.5 meters [30]. Starting in the late 1990s, researchers at the Air Force Research Lab and Boeing Rocketdyne Technical Services have been testing and verifying a proposed optical telescope network for detecting and tracking satellites made up of what they call “Raven-class” telescopes [31]. The term “Raven-class” is used to refer to any commercially available, off-the-shelf optical (COTS) telescopes with aperture sizes up to 0.5 meters (~20 inches) [21]. In their work, these researchers have progressively proven that these small telescopes when coupled with low cost, automated gimbal systems are just as effective at tracking ASOs across most all orbital regimes as the much larger optical systems used in the United States Space Surveillance Network [32]. The advantage of using these small, COTS telescopes is that they offer much greater flexibility at a much lower price. Rather than relying on multi-million-dollar optical or radar telescope systems that are limited in their geographic deployability, a network of Raven-class telescopes offers a level of flexibility, affordability, and expandability that could prove critical in keeping up with the surveillance and tracking needs of the increasingly large ASO population. Here it is important to note that while optical sensing is more common in GEO and other high-altitude applications and radar sensing is more common in LEO, both are capable of detecting objects in any regime provided the right specifications. The goal of these studies into the use of small telescopes is to provide proof-of-concept for a low-cost alternative that can track satellites across most regimes with less-advanced
23
sensors. Another study into the use of small telescopes (<1m aperture) for satellite tracking performed by the Pacific Northwest National Laboratory yielded similar results [30].
Together, validating studies such as these inform what is likely the most practical step forward in the establishment of new ASO detection and tracking systems for space actors that are new to the game. These studies illustrate a cost effective and flexible approach to the expansion of current space surveillance networks. In the context of the Detectability analysis, proof that optical sensors of this size class are sufficient for satellite detection and tracking serves as a useful tool in the selection of cutoffs between which ASOs can be considered detectable and which cannot. In the methods section this paper, these Raven-class sensors are cited as a baseline for defining Optical Detectability in the DIT analyses.
Active Optical Sensing
The optical detection process most commonplace in the satellite detection community and described above is a passive process. It is considered a passive process because these optical sensors passively collect environmentally produced light and process it to detect objects. There are also active detection processes in which the sensor produces its own source signal which then reflects off a target object and is re-collected by the sensor [33]. In optical sensing, this is known as active optical or laser ranging because active optical systems use laser light as the transmitted source signal. This method is not as common as passive optical, but is gaining traction because of its ability to detect and track ASOs in the middle of the night when there is no natural light for passive systems to detect. Active optical tracking is very similar procedurally to radar sensing which is detailed in the following section, the only difference being that radar systems use radio-frequency signals rather than light signals.
2.2.2 Radar Sensors
The second most commonly used sensing mode is active radar (radio detection and ranging). At a high level, the radar detection process occurs when a transmitted radar signal reflects off the target object towards the radar sensor which then detects the strength of the return signal. Radar has distinct advantages and disadvantages that make it an appealing alternative to optical sensing in certain use cases. This section explores the basics of radar detection, how it compares to optical, and the most common radar architectures seen in satellite detection applications.
24 The Basics of Radar Detection
The process of active radar detection has three distinct phases. The first phase is transmission, wherein a radar transmitter produces a radar signal with a certain frequency and power specification and directs it towards the location of the target object [34]. The second phase is reflection. During this phase the radar signal reaches the object and a certain amount of the signal is reflected back down to the Earth. The final phase is reception, where the return signal is captured and measured by a radar receiver. Figure 3 (below) shows a simple illustration of the radar detection process.
Figure 3: Diagram of the Radar Detection Process
If the return signal is strong enough to be distinguished from background noise that the sensor picks up, then a successful detection is made. Once measured, the strength and timing of the return signal can be used to estimate the range of the object as well as its size.
Active Radar vs. Passive Optical
While some aspects of the most common radar and optical detection processes are similar, there are a few important differences in their capabilities. One difference is that because most common radar systems actively produce their own signal which is operable in most weather conditions, they can be operated 24/7 whereas most passive optical systems rely on specific
Radar System
ASO (1) Radar system transmits a
radar signal towards the ASO
(2) The radar signal reflects off the surfaces of the ASO
(3) Radar system collects the return signal
25
weather and lighting conditions to operate. However, because radar systems must produce their own signal, they generally require more energy to operate in comparison to more passive optical systems. Radar systems are often much more limited in their range in comparison to their optical counterparts because of the different properties of the electromagnetic spectrum used in each method. This is a result of a phenomenon known as signal attenuation, which affects system dependent radar signals more drastically than visible light. Signal attenuation is the process wherein the power of an electromagnetic signal diminishes as it travels through the atmosphere [35]. The reason radar systems are affected more is because they require artificial power to produce their own signal, which means that most mainstream radar systems have much less signal power to start with in comparison to the power naturally emitted by the Sun that passive optical systems are able to use. Active optical systems also face this problem because power is necessary to produce laser light at the intensity necessary to detect and track objects in orbit. For example, the PFISR radar system operated by LeoLabs is only able to reliably reach out and detect objects in the LEO regime, whereas similarly priced or even less expensive optical systems are able to reliably detect ASOs in GEO orbits because they take advantage of naturally occurring light from the Sun [36].
A final set of key differences in the capabilities of radar and optical systems is the data they are able to provide. Radar systems are more readily able to collect data related to ASO range, range-rate, and size [37]. On the other hand, passive optical systems are typically better at gathering data on ASO azimuth and elevation at different instants in time. That is not to say that either system provides better data but that they are merely more well equipped for gathering different types of data because of how they function. In practice, combinations of radar and optical observation data are used to produce accurate and precise understanding of an ASO’s orbital state. Quantifying Radar Reflections: Radar Cross-Section
When a radar signal reaches the target object a certain amount of that signal is reflected down towards the receiver antenna, primarily as a function of the geometry and orientation of the target object [38]. The strength of the return signal for a given orientation of an object is known as its radar cross-section (RCS). In practice, radar cross-sections can be calculated experimentally or analytically and used to estimate the behavior of an object when probed by radar signals. Similar to visual magnitudes, radar cross-section values are often described on a logarithmic scale in values
26
of decibel square-meters (dBsm) [39]. For reference, a 0 dBsm value corresponds to the RCS of a 1 square-meter flat plate oriented perpendicular to the sensor, a 1 dBsm value corresponds to the RCS of a 1.259 square-meter flat plate in the same orientation, and a -1 dBsm value corresponds to that of a .794 square-meter flat plate. For the Detectability analysis, this means that estimating the RCS of a satellite is an important step in estimating its Radar Detectability.
Quantifying Detectability: Probability of Detection
There are a set of radar equations that can be used to estimate the strength of the reflected power throughout the radar detection process. One of the radar equations can be used to estimate the strength of the reflected signal that arrives at the receiver antenna [40]. Two key variables that affect the strength of the return signal are the range between the object and sensor, and the radar cross-section of the object. The key takeaways from the radar equation are that received power decreases with the square of the range because the signal spreads out in two dimensions as it travels to the target object, and that received power increases proportionally with the radar cross-section. Once the strength of the return signal is calculated, this predicted strength can be used to estimate the probability that a positive detection can be made. Radar detection is inherently probabilistic because of the probabilistic nature of electromagnetic waves and background noise. Figure 4 (below) shows a simple equation for calculating the probability of detection in any context [41].
Figure 4: Equation for probability of detection [28]
As shown in Figure 4, the probability of detection is equal to the number of true positive cases divided by the sum of all true positive and false positive cases. In the context of radar detection, the true positive value is the total received power and the false positive value is the radar noise. This means that in order for a positive detection to occur, the received signal must be sufficiently strong enough to be distinguished above the noise. In practice, radar operators usually set a threshold value that depends on the specifications of their radar system and the characteristics of the object they are expecting to detect. Based on literature from Systems ToolKit (STK), the
Probability of Detection =
# of True Positive Cases # of True and False Positive Cases
27
software used in this thesis, a probability of detection value of 50% was selected as the cutoff for positive detection for the Radar Detectability analysis [42].
Typical Systems Used for Radar Satellite Detection
The most common radar architecture used for ASO detection is known as phased array. Traditional radar systems employ a single, monostatic design (combined transmitter and receiver) with a reflector dish that disperses the transmitted signal and concentrates the return signal onto the receiver. The problem with using this style of radar for ASO detection is that their large size and narrow beam width makes it difficult for them to efficiently survey large areas or keep up with ASOs as they pass overhead. Phased array radars address this problem by using the properties of interfering radar signals to steer the transmitted signal without a need for any moving parts [43]. By electronically altering the phase of signals from an array of individual transmitters, phased array systems are able to instantaneously change the direction and field of view of the transmitted radar signal. This allows phased array systems to more effectively survey large portions of the sky and gives them the ability to detect and track fast-moving objects as they traverse the sky above the station.
In addition to the transmitter-receiver architecture, another important specification that impacts the performance of a radar system is the specific radar frequencies it can transmit. Radar frequencies range from as low as 30kHz to as high as 300GHz [44]. Even though many of the bands within this wide range of frequencies are regulated, there are many options from which radar designers can choose. Similar to the different architectures, different frequency bands have their advantages and disadvantages. Higher frequencies have shorter wavelengths which enables them to more reliably detect smaller objects that would be too small to consistently reflect lower frequency signals. However, because these higher frequencies interact more readily with smaller objects, they are more easily distorted and weakened by interference in the atmosphere. This means a high frequency signal must have a much higher power than a low frequency signal to reach further distances. Lower frequencies, on the other hand, have much longer wavelengths so they do not interact and reflect off of smaller targets as reliably. As a result of this, lower frequencies can detect objects at farther distances but are restricted in how large those objects must be to be reliably detected. For the purposes of the Detectability analysis, a phased array radar system in the ultra-high frequency (UHF) range (specifically 450MHz), which represents a moderate capability level
28
by today’s standards is simulated for testing purposes. In this context, moderate capability is defined to be on-par with the UHF radars operated by commercial entities such as LeoLabs [36]. Such systems, can reliably detect objects throughout LEO and some lower parts of MEO. For comparison, the Space Fence radar system, which can detect objects out to GEO, is considered to be a top-tier, high capability system [45].
2.3 Identification
The second component of the DIT analysis revolves around the process of ASO identification. This analysis assumes that the team operating the ground-based sensor network does not have information about an ASO such as its owner, name, altitude, and maneuver plans; thesis characteristics must be inferred from independently observed data. Once an ASO has been detected, the next step is to begin tracking it and use the data collected from multiple observations to correlate its orbital and perceived physical characteristics with a catalogue of known objects. After enough data has been collected such that the statistical confidence in its identity meets a predefined cutoff value, the identification process is considered complete, but is continually performed as new data is collected to ensure the continued accuracy of the results. The purpose of the identification analysis is to estimate how difficult an ASO will be to identify when placed into the ASO population. In this section, the basics of the identification process are detailed and the methods and results of Nair’s clustering analysis used in the identification analysis are presented.
2.3.1 The Basics of Identification
The ASO identification process consists of collecting and correlating data from multiple observations of an ASO with a known object catalogue until its identity can be determined with a certain level of confidence. While ASO’s are much closer to Earth than celestial bodies such as the stars and planets, they are still hundreds of kilometers from the surface of the Earth, so observers cannot simply take photos of an ASO and compare it to a catalogue. Using a combination of sensing methods, multiple types of data are collected on an ASO before an identification can be made. In this brief section, the types of data that are commonly used in the identification process are discussed.
The first and often most relied upon type of data in the identification process is orbital data [14]. Orbital data consists of estimates of the six Keplerian orbital elements: inclination,
semi-29
major axis, eccentricity, right ascension, argument of perigee, and true anomaly [46]. Using range, position, range-rate, and velocity data from different sensor types, orbital determination analyses are conducted to produce estimates of the ASO’s orbital state. Historically, the ASO population has been small enough that observers could rely heavily on orbital data when seeking to identify an individual ASO[2]. However, as the ASO population has grown rapidly and will continue to in the coming years, observers are forced to explore new data and methods to successfully and efficiently identify ASOs.
Such new and increasingly commonplace data revolve around ASO characteristic data. Including brightness data and radar-cross section estimates, these data give observers more tools with which to pare down the list of potential identities for an ASO. For example, using trends in an ASO’s brightness over time can allow observers to understand its physical attitude [47]. Likewise, the use of known geometric data for an ASO can also help observers predict behavior and help them more effectively correlate its identity. There have even been studies into using spectroscopy of the light reflected by ASOs to produce more detailed photometric data for use in identification efforts [48–50]. Photometry/spectroscopy-based identification is currently used to identify some GEO satellites, but the practice is not yet universally adopted. For the identification analysis, the goal is to incorporate considerations related to as many relevant and available data types as possible in order to get useful estimates of how difficult a given ASO will be to identify.
2.3.2 Nair’s Clustering Analysis: Defining Orbital Zip Codes
In his work to use mathematical modeling to devise a new way to understand the dynamics of the ASO population, Vishnu Nair, under the mentorship of Prof Moriba Jah, utilized spectral and K-means clustering algorithms on ASO data [51]. In this context, spectral is a mathematical term not to be confused with the electromagnetic spectrum. As stated in his thesis on the subject, this analysis “was done with the aim to establish an orbital family system.” Another novel aspect of Nair’s approach was the use of orbital angular momenta vectors as the parameters for the clustering analysis. Viewing ASOs through their angular momenta presents a new way to understand and describe the dynamics of the orbital population. Figure 5 (below) shows some of the results of Nair’s first round of clustering analysis on the ASO data from the 24,000 ASOs in the ASTRIAGraph repository [52].
30
Figure 5: 3D Plots of orbital clusters in h-space from resulting from Nair’s analyses
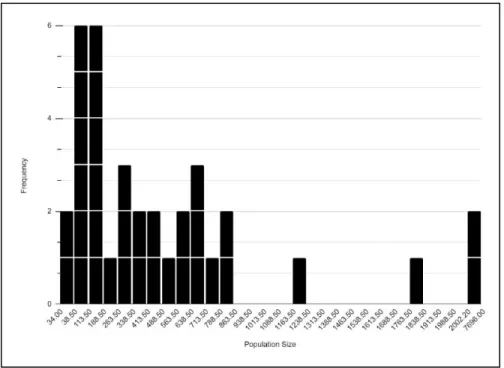
As shown above, early versions of Nair’s clustering analysis resulted in 14 distinct clusters. Each of the plots within the figure show the ASO population broken down into clusters. Each bunching of points of the same color represents a cluster of ASOs as determined by the algorithm. Each color delineates a different cluster. Later revisions of his analysis done in collaboration with the work presented in this thesis refined the clustering process and resulted in a total of 35 orbital clusters. ASOs with similar altitudes, right ascensions, and inclinations tend to fall into similar clusters because these three parameters are directly related to the direction and magnitude of the angular momentum vector for an ASO. Working with Prof. Moriba Jah, Nair and the author of this work have developed the idea of using these clusters as ‘orbital zip codes’ as a tool for the identification analysis. While still in development, the core idea is to use the orbital zip code that an ASO falls into as a sample population of similarly behaving objects to which it can be compared. From there the Identifiability could be estimated based on the size of the ASO’s orbital zip code and on how the ASO’s characteristics compare to the rest of the ASOs in that orbital zip code. Figure 6 and Table 2 (below) show the latest distribution of orbital zip code populations and a summary of a few key statistics for the distribution.
31
Figure 6: Distribution of orbital zip code populations from Nair’s clustering analysis
Table 2: Statistics for the distribution of orbital zip code population sizes
Ranging in size from 34 to roughly 7700 ASOs, the wide distribution of orbital zip code sizes shows how some objects could be much easier to distinguish from its orbital neighbors than others. One element that this analysis lacks is a means of comparing the characteristics of ASOs in an orbital zip code. The ability to further quantify how distinct an ASO is from others in the population using characteristic data would allow for more accurate estimation of how difficult it would be to identify.
32
2.4 Tracking
The third and last component of the DIT analysis is the Trackability analysis. As mentioned above in the identification section, the process of tracking an ASO begins as soon as a successful detection is made. Once that first detection is made, the tracking process is continued with every successive detection and identification of an ASO as a unique, previously observed object. The tracking analysis assumes that identification of the ASO as a unique object has been achieved and that the focus has changed to monitoring the behavior of the ASO over time. While closely related to the identification process, the tracking process has a few differences and is performed continuously until an ASO is removed entirely from space or until a ground-based sensor network loses track of an ASO and begins the detection and identification processes again. In this section, the basics of tracking are discussed further and some of the key metrics of Trackability are introduced.
2.4.1 Basics of Tracking
The first step in tracking is initial orbit determination. This step consists of taking data from initial observations and using analysis tools to calculate probable orbital parameters for the observed ASO [18]. Once the initial orbital determination has been made, tracking transitions to the second and continual step, known as estimation. Estimation involves using data from successive observations to refine and update the known information on the ASO’s orbital state. The purpose of the estimation process is to refine the accuracy of orbital state data for a tracked ASO as well as consider and measure the orbital results of any planned or unplanned maneuvers or disturbances. The concept of Trackability depends on understanding the types and quantities of usable data that can be collected for a given ASO.
2.4.2 Key Metrics
The goal of the Trackability analysis is to estimate how difficult a given object will be to track based on its orbital characteristics. As previously mentioned tracking is a data-driven process, so estimating the types and amounts of data collectable for a given ASO is the main idea of the Trackability analysis. In order to be able to collect data on an ASO, a sensor must be able to detect the ASO. Then depending on the location, type, and specifications of the sensor, different types of data can be gathered. This means that understanding the amount of time that a sensor could be
33
expected to have access to an ASO could provide a baseline estimate of how difficult it would be for a naïve observer to track it. Current practice regards longer pass durations as better because they allow for more data to be collected, since observation data is generally collected at low rates [53]. 5-10 observations per pass or fewer is considered low rate data collection.
In addition to pass duration, another tracking metric is interval duration, or the amount of time that passes between access opportunities. In optical observation, data collection periods are short and sparse, meaning that the amount of time in-between observable passes is often significantly longer on average than the average pass length [18]. This interval duration is important because it represents how long the uncertainties in the orbital state data for an ASO are allowed to propagate, leading to increasingly poor tracking data. Beyond the raw numbers of how long an ASO can and cannot be observed, when this access occurs is also an important factor. For instance, there is evidence to suggest that an ASO tracked by multiple ground stations with short and sparse data can be tracked as well as an ASO tracked by one ground station using densely collected data [53]. For the purposes of the Trackability analysis, these metrics are used as Figures of Merit for estimating the Trackability of an object: pass duration, interval duration, and orbital coverage.
35
3.STUDY SCOPE AND ASSUMPTIONS
Before describing the work done to develop the DIT analysis, this section will outline the theoretical framework for the analysis. This framework was defined in large part by Professor Moriba Jah, who is responsible for the initial formulation of the concept of the DIT analysis. Professor Jah also played a key advisory role in the work presented in this thesis. Following are the definitions of each component of the DIT analysis. These definitions are used as the theoretical backing for the work accomplished in this thesis.
Detection is defined as the scenario in which a predefined space surveillance system using optical and radar sensors to observe ASOs is monitoring for spacecraft without having a specific list of objects and without a priori knowledge of the size, altitude, or other orbital characteristics of the spacecraft. For this uninformed case, the Detectability analysis is constructed to determine the likelihood that a spacecraft with specific orbital and physical characteristics can be detected by either optical telescopes or surveillance radars. The resulting Detectability rating for a spacecraft mission is defined as the likelihood that the space surveillance system will be able to observe individual ASOs involved in the mission, subject to error sources from the sensors, from signal loss resulting from the object’s orbital dynamics, and from illumination constraints that arise from the geometry of the sun, spacecraft, and sensor along with that of the spacecraft itself. An idealized version of the Detectability analysis would be able to account for as many realistic variables as possible, and this work attempts to incorporate as many variables as is practical.
Identification refers to the process by which an observer without a prior knowledge of a spacecraft’s name, ownership, orbital characteristics, and size uses observation data to determine the identity of a detected ASO. In this similarly uninformed scenario, the Identifiability of a spacecraft is defined as the estimated difficulty it would be for such an observer to uniquely identify and distinguish a given spacecraft from other objects in orbit using only observational data and general knowledge of the ASO population from which to draw. In practice, it is very difficult to distinguish between different ASOs without a priori knowledge such as that possessed by individual operators. The Identifiability analysis presented in this work attempts to devise a new categorization system that uses orbital and characteristic data from the orbital population to produce a theoretical estimate of how difficult a particular ASO would be to identify.
Tracking is defined as the process in which an observer has already successfully detected and identified a spacecraft and proceeds to monitor and model the future orbital behavior of the
36
spacecraft over time. The fundamental question of the Trackability analysis asks how difficult it is for a third-party observer not involved with the operation of the spacecraft to successfully and reliably track the object. In this scenario, the tracking observer has already obtained knowledge of the name, ownership, and instantaneous behavior of an ASO at a specific time. Without full knowledge of the orbital parameters of the target object, there is inevitably uncertainty in any predictions of its future behavior. An observer is able to reduce this uncertainty through data collection, which is only possible when their sensors have access to the ASO. To make use of this fact, the Trackability analysis assumes a fixed rate of data collection and calculates theoretical access statistics and trends to estimate how difficult it would be for an average observer to maintain accurate tracking information for the ASO.
37
4.METHODS
The development of the DIT analysis began with research into the field of satellite observation and space situational awareness (SSA). The goal of this research and review was to understand the sensor technologies and methods currently utilized in satellite, space debris, and celestial object observation and tracking. It is the hope of the author that future researchers and students can learn from the analysis framework presented in this thesis and work to advance it into a robust and useful tool. In parallel with this foundational research, interviews and technical discussions were conducted to gain additional perspectives on the norms of the SSA field and on the key ideas. Table 3 (below) summarizes, in no particular order, the names, organizations, and fields of work/expertise of experts that were consulted for technical advice in the early stages of the DIT analysis development. The end goal of this research was to develop a framework that could be used by future students, researchers, and others to estimate the Detectability, Identifiability, and Trackability of an arbitrary ASO.
38
Table 3: Experts Consulted Throughout DIT Analysis Development
Individuals Consulted
Affiliated Organization Fields of Work/Expertise
Moriba Jah University of Texas Austin
American Astronomical Society Fellow Air Force Research Lab Fellow International Association for the Advancement of Space Safety Fellow
Space Sustainability
Space Situational Awareness Space Traffic Management
Jonathan McDowell
Harvard-Smithsonian Center for
Astrophysics Astrophysics Space Observation Brian Knoth James Miller Janice Rejto Kathleen Monoxelos Robert Guierriero Suvendra Dutta Zachary Folcik
Massachusetts Institute of Technology (MIT) Lincoln Laboratory Group 93
Space Situational Awareness Space Object Tracking
Susan Lederer National Aeronautics and Space Administration (NASA) Orbital Debris Program Office
Space Debris Observations
Dave Cappellucci Lockheed Martin (retired) North American Aerospace Defense
Command (NORAD) Satellite Tracking Space Fence Radar
Satellite Catalog Quality Phillip M. Cunio
Alexander Koenig
ExoAnalytic Commercial Space Situational Awareness
John Garnham United States Air Force (retired) Air Force Research Lab Space Vehicles Directorate
Space Domain Awareness
Alexandru Mancas Francesca Letizia Jan Siminski Stijn Lemmens Srinivas Setty
European Space Agency Space Situational Awareness
Space Object Tracking
Matthew Shouppe LeoLabs Commercial Space Situational Awareness
Discussions with these experts and reviews of scholarly articles in the fields of SSA and space domain awareness informed and shaped the entirety of the DIT analysis. After the knowledge from these experts and literary sources was collected and internalized, more specific avenues of development materialized for each of the three components of the DIT analysis.

![Figure 2: Equations for estimating the limiting magnitude of an optical system [27–29]](https://thumb-eu.123doks.com/thumbv2/123doknet/14731425.573068/21.918.116.813.403.795/figure-equations-estimating-limiting-magnitude-optical.webp)
![Table 4: Summary of Catalogued [56] and Simulated Visual Magnitude Verification Data](https://thumb-eu.123doks.com/thumbv2/123doknet/14731425.573068/41.918.109.805.421.979/table-summary-catalogued-simulated-visual-magnitude-verification-data.webp)