HAL Id: hal-01856123
https://hal.inria.fr/hal-01856123
Submitted on 9 Aug 2018HAL is a multi-disciplinary open access archive for the deposit and dissemination of sci-entific research documents, whether they are pub-lished or not. The documents may come from teaching and research institutions in France or abroad, or from public or private research centers.
L’archive ouverte pluridisciplinaire HAL, est destinée au dépôt et à la diffusion de documents scientifiques de niveau recherche, publiés ou non, émanant des établissements d’enseignement et de recherche français ou étrangers, des laboratoires publics ou privés.
Tracing Data Pollution in Large Business Applications
Laure Berti-Équille
To cite this version:
Laure Berti-Équille. Tracing Data Pollution in Large Business Applications. Proceedings of the 13th International Conference on Information Quality (IQ’08), , Nov 2008, Cambridge, MA, United States. �hal-01856123�
T
RACING
D
ATA
P
OLLUTION IN
L
ARGE
B
USINESS
A
PPLICATIONS
(Research-in-Progress) Laure Berti-Équille* U. of Rennes, France [email protected]Abstract: In large business applications, various data processing activities can be done locally or outsourced, split
or combined and the resulting data flows have to be exchanged, shared or integrated from multiple data processing units. There are indeed various alternative paths for data processing and data consolidation. But some data flows and data processing applications are most likely exposed to generating and propagating data errors; some of them are more critical too. Actually, we usually ignore the impact of data errors in large and complex business applications because : 1) it is often very difficult to systematically audit data, detect and trace data errors in such large applications, 2) we usually don’t have the complete picture of all the data processing units involved in every data processing paths; they are viewed as black-boxes, and 3) we usually ignore the total cost of detecting and eliminating data anomalies and surprisingly we also ignore the cost of “doing nothing” to resolve them. In this paper, the objectives of our ongoing research are the following: to propose a probabilistic model reflecting data error propagation in large business applications, to determine the most critical or impacted data processing paths and their weak points or vulnerabilities in terms of data quality, to advocate adequate locations for data quality checkpoints, and to predict the cost of doing-nothing versus the cost of data cleaning activities.
1. I
NTRODUCTION
Estimation of the quality of information produced or exchanged by collaborative data processing applications is difficult because errors from multiple data sources and processing paths are combined in the final output data. In large and complex business applications, it is extremely difficult: i) to establish estimates of the quality of the data delivered or exchanged by composite applications collaborating with each others, ii) to offer convenient means of keeping track of the effects of data error propagation, iii) to predict the cost of control and corrective actions on erroneous data, and iv) to determine and recommend the “best” locations (i.e., with minimal cost) for data quality control and improvement activities. In this context, our initiative is to study the notion of “quality of data dependability” (QoD-dependability) defined as: the trustworthiness of a data processing unit (or application) which allows reliance to be
justifiably placed on the data quality it delivers. As cost is a relevant issue for data quality control and
improvement activities, the cost of ensuring QoD-dependability has to be kept low. When developing QoD-dependable applications (i.e., that ensure and preserve high or, at least, acceptable quality of the data they process and exchange), it is important to know the characteristics and properties (and weaknesses) of the means at one’s disposal for data quality awareness. Moreover, in order to be able to set up and target data quality control and improvement activities where they are the most effective, it is important to know where data errors tend to propagate and have the worse consequences (on strategic decisions, for example). The motivation of this work directly comes from the works related to software dependability [4,5] and we apply the same concepts for tracing the propagation of data quality problems through data processing applications. We introduce the garbage-in garbage-out measure, noted GIGO and, based on it, we define a set of related measures that cumulatively provide an insight on the vulnerabilities of the applications related to data quality issues.
Illustrative Example
* Work conducted when visiting AT&T Labs-Research, supported by the Marie Curie International Fellowship within the 6th European Community Framework Programme (FP6-MOIF-CT-2006-041000).
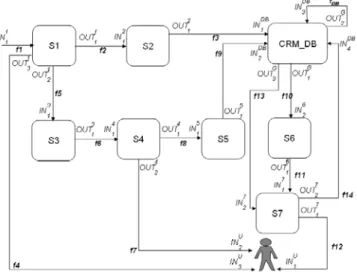
Customer Relationship Management (CRM) is a process used to learn more about customers’ needs and behaviors in order to develop stronger relationships with them and to identify, acquire, foster and retain loyal and profitable customers. Web-based CRM uses several softwares and applications that enable Web-based customer interaction, Web site analytics, Enterprise Marketing Automation (EMA) (e.g., for the enterprise’s electronic surveys, polls, questionnaires, and campaign management to understand customer preferences), and Sales Force Automation (SFA) (for helping executives and salespeople to correctly identify customers and execute sales methods). Call Center softwares or Help Desk softwares are also used for customer service (e.g., for automating emails, call logs, etc.). From a functional point-of-view, Figure 1 depicts a generic architecture of a large CRM application of an airline company consisting of 7 data processing units (S1, . . . , S7), 15 input/output data flows (f1, . . . , f14, fDB) exchanging information (e.g., flight reservation, reservation confirmation, e-ticket, etc.), the CRM database CRM DB, and Data Quality Control policies (DQCs). DQCs (e.g., DQC[S1], DQC[f5], DQC[CRM_DB], etc.) are applied to data flows, processors, and database. From the user perspective, a scenario involving this CRM solution could be the following one: the customer browses the airline Web site searching for a flight to a given destination and for a given time period. During the browsing process, the Web site analyzer (S2) collects information that identifies the customer and characterizes his profile (e.g., the customer may be a “gold” member of the frequent flyer program and what he is looking for during the current Web session may be of interest for the marketing team). Once the customer has chosen the appropriate flight, he may want to be called back (S3) by the online phone reservation service of the company in order to make the reservation and the payment by phone. Then, he will be called back by the Call Center (S4) and the information related to the customer, the call details and the reservation information will be entered into the CRM database by an operator using the back-office Help Desk (S5).
Figure 1: Data processing in the CRM example
The Enterprise Marketing Automation (EMA) service (S6) may then use the data stored in the CRM database to plan electronic surveys and trigger the actions of the airline marketing team and the commercial executives assisted by the Sales Force Automation (SFA) service (S7) in order to propose commercial offers or to prospect (by (e-)mail or phone) and finally, for the front-line personnel to provide differentiated services to the loyal and profitable customers (e.g., on board by flights attendants). Front-line personnel not only needs information to service the customers, but they can provide critical information and insight back to the organization from their personal contact with each individual (f12), and they may update the data describing the customers in the CRM database (f14) that will increase the CRM
knowledge and culture in the enterprise. Since processes and humans can introduce errors, data quality control procedures (DQCs) that can prevent and detect errors are an important component of the global system. They can be applied to data processing units or to data flows. They can eliminate data quality problems of completeness (C) (i.e., missing values), freshness (F) (i.e., obsolete values), uniqueness (U) (i.e., presence of duplicates), and valuation errors (V) (e.g., misspellings, outliers, inconsistencies, contradictions, constraints violations, etc.). Examples of DQCs are depicted in the table appearing within Figure 1. Each DQC policy may combine several techniques (such as ETL, Exploratory Data Mining, data sampling and tracking, etc.) for error detection and correction. Several (potentially overlapping or conflicting) pieces of information describing the customer may come from various data processing units through different paths.
Setting up systematically DQCs for each data flow and each service of the global system is cumbersome and impossible in practice. It is thus necessary to determine data quality hot-spots and vulnerabilities impacting data flows and identify the data processing units that generate and propagate data quality problems in order to choose the “best” path (less likely exposed to data quality problems) and target corrective actions depending on the costs they require.
2. O
VERVIEW OF THE
F
RAMEWORK
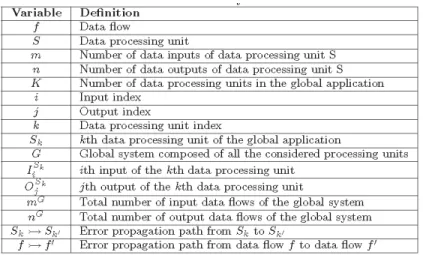
In this paper, we consider a large business application as a composition of data processing units, i.e., applications interacting to deliver the requisite functionality for processing, manipulating, transforming or exchanging data. A data processing unit is viewed as a black-box with multiple inputs and outputs. Units communicate with each other in some specified way using various forms of communication (e.g., data exchange, query posting/answering, shared memory, messaging, etc.). A unit performs data processing and management operations using the provided data inputs to generate the data outputs. A number of such units constitute a data-centered application and they are inter-linked as it is illustrated in Figure 2 that represents the CRM example: CRM_DB has four inputs coming from the outputs of three other units (e.g.,
S2, S5 and S7) and three outputs.
Figure 2: Data processing in the CRM example
- the garbage-in garbage-out measure is defined for input/output data flows as the conditional probability of an error occurring on the output data flow given that there is an error on the input data flow. The garbage-in garbage-out measure can also be defined for a data processing unit as the probability of a data error is permeated from the inputs of the data processing unit to its outputs. - the weight of error propagation path: when one output of a data processing unit is one of the inputs of
another data processing unit, errors in the input data flow can propagate along a path to the other processing unit output data flows.
- the data pollution exposure for a data processing unit is the mean of the weights of all the propagation paths of the incoming data flows from the initial inputs to the considered data processing unit. It indicates which units will most probably be the ones exposed to errors propagating through the global system.
- the data pollution impact of a data flow or of a data processing unit: if one could assume independence over all error propagation paths, the impact measure would be the conditional probability of an error in the data flow f propagating all the way to the jth output of data processing unit S. The general interpretation of this measure is that the higher the impact, the higher the risk of an error in the source input generating an error in the output of the data processing unit.
- the criticality of a data flow or a data processing unit on the global system: for cost-efficiency, one may wish to concentrate resources for data quality controls (DQCs) on the most critical output data flows and, therefore, needs to know which data flows that are “best” (in a loose sense) to monitor or clean. Each output data flow of the global system is assigned a criticality measure, which is a value between
0 and 1, where 0 denotes not at all critical and 1 denotes highest possible criticality.
3. M
ETRICS FOR
T
RACING
D
ATA
P
OLLUTION
We use the preliminary notations given in Table 1 for analyzing the propagation of data errors in data-centered applications.
3.1
The Garbage-In Garbage-Out Measure
Consider a pair of input and output data, the garbage-in garbage-out measure is defined as the conditional probability of an error occurring on the output given that there is an error on the input. Thus, for input i and output j, the garbage-in garbage-out measure is defined as follows:
Considering an input/output pair, this measure indicates how “permissive” or “retentive” a data processing unit is to errors occurring on that particular input. One characteristic of this definition is that it is independent of the probability of error occurrence on the input (as it is a conditional probability). On the other hand, GIGO measure is still dependent on the workload of the data processing unit as well as the type of the errors that can occur on the inputs. GIGO measure is defined at the data flow level, i.e., a GIGO value characterizes the error propagation from one input data to one output data. Going to the data processing unit level, we define the GIGO measure of a data processing unit S with m input data and n output data, to be:
Rather, it is an abstract measure that can be used to obtain a relative ordering across data processing units. If all inputs are assumed to be independent of each other and errors on one input data can only generate errors on one output data at a time, then this measure is the actual probability of an error on the input permeating to the output. Note that this does not necessarily reflect the overall probability that an error is permeated from the input of the data processing unit to the output. The larger this value is for a particular data processing unit, the more cleaning efforts have to be spent in order to increase the error detection and correction capabilities of that data processing unit (and decreasing consequently its GIGO measure).
3.2 Weighting an Error Propagation Path
As errors in a (source) input data flow can propagate along many different paths to the (destination) output data flow, we must consider this in our definition of the next measures. At the data processing unit level, we define the error propagation path from a data processing unit Sk to another data processing unit Sk′ of the global application, noted G, when one output of data processing unit Sk is one of the inputs of the other data processing unit Sk′. The error propagation path can also be redefined at the input/output data flow level, such as:
- is the error propagation path starting from the ith input of the Sk data processing unit and ending at the i′th input of the Sk′ data processing unit,
- is the error propagation path starting from the ith input of the Sk data processing unit and ending at the j′th output of the Sk′ data processing unit,
- is the error propagation path starting from the jth output of the Sk data processing unit and ending at the j′th output of the Sk′ data processing unit.
We define w(p) the weight of the error propagation path p, as the product of all the in garbage-out measures from the start to the end of the data processing through K units:
(1)
3.3
Measuring the Data Pollution Exposure
Earlier, we had defined the garbage-in garbage-out measures for data processing units, that only consider the GIGO values of data processing units and couplings across units are disregarded.
We now define a set of measures that explicitly consider coupling and aid determining the data quality weak spots and vulnerabilities of the global application. To find units most likely to be exposed to propagating errors, we want to have some knowledge of the “amount” of errors that a data processing unit may be subjected to. Considering all the i′th inputs of the global system G, we define the error exposure measure of a data processing unit S on its inputs as:
where m is the number of inputs of data processing unit S, mG is the total number of inputs of the global application.
The error exposure measure is the mean of the weights of all the propagation paths of the incoming data flows from the initial inputs to the considered data processing unit. This measure does not consider any correlation that may exist between two or more incoming data flows. The error exposure measure indicates which units will most probably be the ones exposed to errors propagating through the global application.
3.4
Measuring the Impact of Data Quality Problems
It may be insufficient to only take into account the propagation characteristics of data errors for a global application in order to identify data quality weaknesses. Errors that have a low probability of propagating may still have significant consequences. Taking this into account, we now define measures which let us analyze to what extent errors in data flows (inputs or intermediate data flows) affect the global system output, i.e., what the impact of errors on the output data flows of the global application is. We define the impact of (errors in) the data flow f on the jth output of data processing unit S, as:
where wp is the weight of each possible error propagation path from f to the jth output of data processing unit S. If one could assume independence over all paths, the impact measure would be the conditional probability of an error in f propagating all the way to the jth output of S. The general interpretation of this measure is that the higher the impact, the higher the risk of an error in the source input generating an error in the output of the data processing unit.
Thus, one may consider data flows which have a high impact even though they may have a low error exposure (meaning that errors in this data flows are relatively rare but, should they occur, are likely to be costly). If the data processing unit S has multiple outputs, the corresponding impact value of the flow f which considers all of its outputs can be defined as:
(3)
(4)
The impact of the data flow can be computed on the global output.
where n is the number of outputs of data processing unit S and nG is the total number of outputs of the global application.
3.5 Measuring the Criticality
The concept of impact as described above considers the impact on the output data flows generated by errors in input and intermediate data flows. However, when a system has multiple output data flows, these are not necessarily all equally important for the system, i.e., some output data flows may be more critical than others. For cost-efficiency, one may wish to concentrate efforts for data quality control and improvement (DQC) on the most critical output data flows and, therefore, needs to know which data flows that are “best” (in a loose sense) to monitor or to clean. Each global output data flow of the global application is assigned a criticality measure, which is a value between 0 and 1, where 0 denotes not at all critical and 1 denotes highest possible criticality. The criticality of a data flow f is then calculated relatively using the assigned criticality values of the global output data flows and the impact values calculated for the data flow f on the j′th output of the global application. The criticality of the data flow f is compared to the criticality of the jth output of the global application, as:
where
Once we have the criticality of f with regard to each output data flow of the global application, we can compute an overall criticality value. We define the criticality of the data flow f for the outputs of the global system as:
At the data processing unit level, the criticality of data processing unit S is defined using the criticality values of all output flows of S, as:
4 Selecting Locations for DQCs
Consider the case where a data processing unit has low exposure but a high criticality. The low exposure means that there is a low probability of errors propagating to that data processing unit. However, the high (6)
(7)
(8)
(9)
criticality means that, should an error find its way into that data processing unit, there is a high probability of that error having significant consequences. Thus, one may select data processing units with low exposure and high criticality for setting up data quality control and cleaning activities. From a cost viewpoint, taking care of high criticality events may not be worthwhile if these events have a very low probability of occurring. In this case, the data quality control and improvement policies will determine whether a low-probability event with high criticality will be taken care of or not.
Moreover, one may wish to set a minimum level of error detection, which can be accomplished by setting a maximum level on GIGO values and/or error exposure values. Thus, if a data processing unit or data flow exceeds these thresholds, this indicates that more resources have to be allocated to that data processing unit to increase its error detection and correction capabilities. A similar approach can be used for criticality (or impact). For example, a situation with low error exposure and high criticality (or impact) indicates that any error detection and cleaning mechanism in that location would have to be highly specialized as errors are infrequent and likely to be hard to detect. The opposite situation, i.e., high exposure and low criticality (or impact) indicates that a coarser error detection mechanism in that location may suffice.
Figure 3: Status of the data processing units in the CRM example
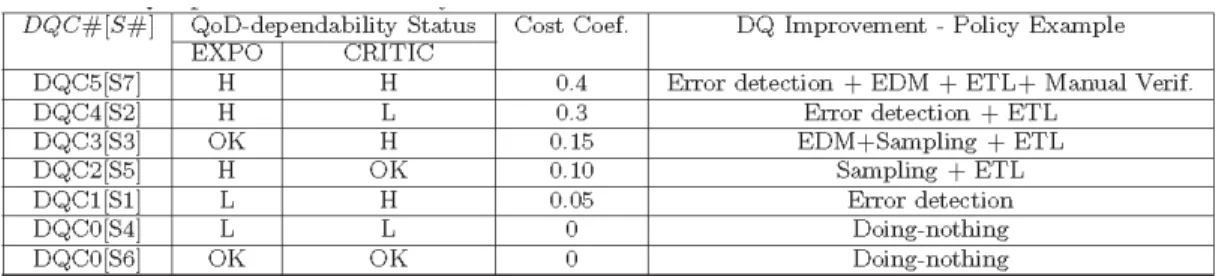
Figure 3 shows graphically the status in terms of exposure and criticality of the seven units of the CRM example. The arrows appearing in the figure represent the possible data quality control and improvement policies (DQC#[S#]) applied to data processing unit S# and based on a combination of several techniques as shown in Table 2 (e.g., ETL scenarios, Exploratory Data Mining analysis, error detection, etc.), in order to decrease the GIGO value of the considered data processing unit, and subsequently, decrease the exposure and/or criticality values to the acceptable range, i.e., between LQT - Lower Quality Tolerance and UQT - Upper Quality Tolerance thresholds.
Table 2: DQC policies ordered by cost factor and based on the status of the CRM units
We select now the optimal locations for data quality control mechanisms (DQC) based on the profiles obtained from the analysis of the global system. First, we present three basic methods for selecting the locations of these controls: the first one finds flows and units that have the high impact on error propagation, the second one finds flows and units with high exposure, and the last one finds flows and units with high criticality:
- Impact-driven method (M1): If we take into account the impact of the data processing units or data flows on the global system outputs, we only consider the data flows with high impact for being guarded by DQCs. Flows and units with zero or low impact will not be selected for DQCs.
- Exposure-driven method (M2): If the exposure of a data flow f is zero, it means that errors in the inputs of the emitting data processing unit are unlikely to propagate through the data processing unit S. Thus, although the GIGO may be quite high, we’ll not select the flow f as a location for a DQC. We don’t consider the units or data flows with low exposure values for being guarded by DQCs (i.e., lower than the LQTE threshold). We do not select recursive flows with zero or low exposure on an
output flow as well. We focus on flows and units with exposure higher than the UQTE threshold.
- Criticality-driven method (M3): If we take into account the criticality of the units and data flows on the global system outputs, we only consider the units or data flows with high criticality for being guarded by DQCs (i.e., greater than the UQTC threshold). Flows or units with zero or low criticality will not
be selected for DQC.
Each data quality control policy has a cost, noted cost(DQC). Table 2 gives the cost coefficients that are applied to the CRM example. DQC’s cost depends on the number, the processed data volume, and complexity of the techniques involved. When we predict that the data processing unit S introduces or propagates pollutions from its input data flows to its outputs, we need to consider the risk of this prediction because this may lead to set up non legitimate DQCs that have a non negligible cost. We can define empirically this notion based on Nobs observations, as a quadratic function, noted Improv describing the data quality improvement for the data processing unit S when a DQC is applied:
where Cost(DQC) is the total cost of the data quality control policy DQC applied to the data processing unit S, and GIGODQC[S] is the new GIGO value of the data processing unit S measured after the application of the DQC[S] policy to data processing unit S. Complementary to the methods M1, M2 and M3, our objective is to search for the locations on the data processing paths (i.e., data flows or data processing units) where DQCs have minimal cost and maximal improvement function in reducing the data quality problems.
Obtaining numerical values for the GIGO measures may prove to be quite difficult, given that many factors, such as error type, misclassification problem on error detection, have to be taken into account. Thus, an experimental method based on error injection for obtaining estimates of error GIGO values is used. Experimentally estimating values for GIGO of a data processing unit is done by injecting errors in the input data flows of the data processing unit and logging its output data flows. Suppose, for a global application such as the CRM example, we inject ninj distinct errors in input i and, at output j, we observe
nerr differences, then we can directly estimate the GIGO measure to be nerr/ninj. The values of the improvement function per data processing unit where one DQC is applied are computed using the cost factors listed in Table 2.
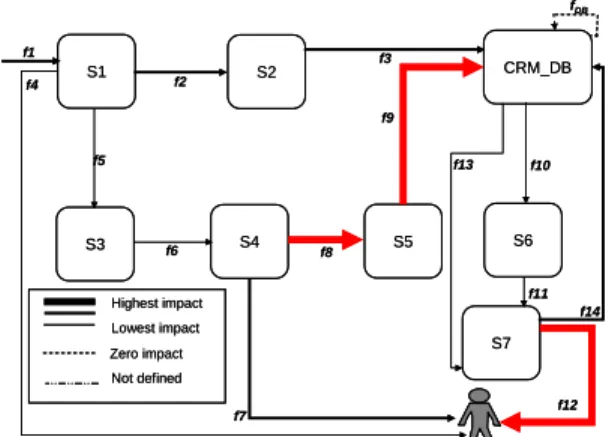
To illustrate our experiments on the synthetic data set of the CRM example, we’ve identified the most impacted, exposed and critical data processing paths and we found the most relevant DQC locations with minimal cost maximizing the improvement function for the different methods. Figure 4 illustrates for the CRM example the most impacted data processing paths. As an example, considering the impact-driven method (M1), the main DQC locations would be on f8, f9 and f12 data flows.
Figure 4: Impact of data pollution propagation through the CRM application
5.
R
ELATED
W
ORK
Data quality is a multidimensional, complex and morphing concept [3]. Since a decade [11-13], there has been a significant body of work in the area of information and data quality management initiated by several research communities (i.e., statistics, database, information system, workflow and project management, knowledge engineering and discovery from databases), ranging from various techniques in assessing information quality to building large-scale data integration systems over heterogeneous data sources and in improving data quality in databases [3], in information systems [9-13] or in cooperative information systems and in data warehouse systems. Various data quality definitions, metrics, models, methodologies, cleaning and Extraction-Transformation-Loading (ETL) tools have been proposed by practitioners and academics with the aim of tackling the following main classes of data quality problems (outliers, inconsistencies, duplicates, (disguised) missing values, obsolete data, etc.). Many surveys and empirical studies showed the importance of quality in the design of information systems. Many works in the fields of information systems and software engineering address the quality control and assessment for the information and for the processes which produce this information [2, 8], but very few focused on the dynamics of data quality problems propagation. Alternatively, Web service composition has been a very active research area recently focusing on the dynamic selection of services based on user requirements and on the quality of service. In [7], the authors propose the dynamic service composition using a global planning approach where the tasks (that can be accomplished by several potential Web services) are selected during the execution using the Multiple Attribute Decision Making method based on five quality criteria describing the service (e.g., execution price, execution duration, reputation, reliability, and availability). Our approach does not consider the dynamic composition of services. Instead, it focuses on analyzing and predicting the data pollution propagation and advocates the location of data quality controls to be integrated to the services. Our approach is initially proposed for the case where there are not several potential Web services available for processing a task, but it could be extended to dynamically select potential services based on their “data pollution retention” capabilities (i.e., low GIGO values). In the field of hard- and software engineering, a significant amount of research has been reported on the subject of dependability of computer systems, and a large number of analytical models and related approaches exist to predict reliability for such systems [4, 5, 6].
Because we believe that these models provide an excellent theoretical foundation for computing dependability, we applied the approach of Suri et al. [4, 5] to the problem of data pollutions propagation in complex data-centered application in order to optimally recommend adequate actions for detection and correction of the data quality problems. We introduce the notion of QoD-dependability and we compute an improvement function when DQCs are applied.
S1 S2 S4 CRM_DB S3 S5 S6 S7 f1 f2 f3 f5 f6 f7 f8 f4 f9 f13 f10 f11 f12 f14 Zero impact Highest impact Lowest impact Not defined fDB S1 S2 S4 CRM_DB S3 S5 S6 S7 f1 f2 f3 f5 f6 f7 f8 f4 f9 f13 f10 f11 f12 f14 Zero impact Highest impact Lowest impact Not defined fDB
6. C
ONCLUSION
This paper presents a framework for analysis of the propagation of data pollutions in a data processing unit composition. The proposed framework provides metrics for analyzing the data quality problems propagation for a given data processing unit composition and it allows the assessment of the vulnerability of data processing units and data flows to upcoming data quality problems. We introduced four measures both defined at the data processing unit and the data flow levels: 1) the garbage-in garbage-out measure, 2) the error exposure, 3) the error impact, and 4) the criticality of a data flow/data processing unit as a part of a complex data-centered application.
Based on the results of ongoing experiments on synthetic data and simulation of complex CRM application configurations, we have illustrated and how one may interpret the measurement results of the framework to determine potential data quality weaknesses in the global application.
R
EFERENCES
[1] Ballou, D.P., & Pazer, H., (2002). Modeling Completeness Versus Consistency Tradeoffs in Information Decision Contexts. IEEE Transactions on Knowledge and Data Engineering. 15(1), pages 240-243.
[2] Bobrowski, M., Marré, M., Yankelevich, D., (1998). A Software Engineering View of Data Quality, Proc. of the 2nd International Software Quality Week Europe (QWE'98). Brussels, Belgium.
[3] Dasu,T., & Johnson, T., (2003). Exploratory Data Mining and Data Cleaning. Wiley.
[4] M. Hiller, A. Jhumka, and N. Suri, (2004). EPIC: Profiling the Propagation and Effect of Data Errors in Software. IEEE Trans. Computers, 53(5):512–530.
[5] A. Johansson and N. Suri, (2005). Error propagation profiling of operating systems. In Proc. of the Int. Conf. on Dependable Systems and Networks (DSN), pages 86 – 95.
[6] M. Kaaniche, J.-C. Laprie, and J.-P. Blanquart, (2000). Dependability Engineering of Complex Computing Systems. In Proc. of the Sixth IEEE Int. Conf. on Engineering of Complex Computer Systems (ICECCS). [7] L. Zeng, B. Benatallah, M. Dumas, J. Kalagnanam, and Q. Z. Sheng, (2003). Quality Driven Web Services
Composition. In WWW, pages 411–421.
[8] Pipino, P., & Lee, Y.W., (2002). Data Quality Assessment. Communications of the ACM, 45(4): 211-218. [9] Redman, T., (1996). Data Quality For the Information Age, Artech House Publishers.
[10] Redman, T., (2001). Data quality: The Field Guide, Digital Press (Elsevier).
[11] Wang, R., Storey, V., Firth, C., (1995). A Framework for Analysis of Data Quality Research. IEEE Transactions on Knowledge and Data Engineering, 7(4): 670-677.
[12] Wang, R., (1998). A Product Perspective on Total Data Quality Management. Communications of the ACM, 41(2): 58-65.
[13] Wang, R., (2002). Journey to Data Quality. Vol. 23 of Advances in Database Systems, Kluwer Academic Press, Boston.