M E T H O D O L O G Y A R T I C L E
Open Access
Discrimination of three genetically close
Aspergillus species by using high resolution
melting analysis applied to indoor air as
case study
Xavier Libert
1,2, Ann Packeu
2, Fabrice Bureau
3, Nancy H. Roosens
1and Sigrid C. J. De Keersmaecker
1*Abstract
Background: Indoor air pollution caused by fungal contamination is suspected to have a public health impact. Monitoring of the composition of the indoor airborne fungal contaminants is therefore important. To avoid problems linked to culture-dependent protocols, molecular methods are increasingly being proposed as an alternative. Among these molecular methods, the polymerase chain reaction (PCR) and the real-time PCR are the most frequently used tools for indoor fungal detection. However, even if these tools have demonstrated their appropriate performance, some of them are not able to discriminate between species which are genetically close. A solution to this could be the use of a post-qPCR high resolution melting (HRM) analysis, which would allow the discrimination of these species based on the highly accurate determination of the difference in melting temperature of the obtained amplicon. In this study, we provide a proof-of-concept for this approach, using a dye adapted version of our previously developed qPCR SYBR®Green method to detect Aspergillus versicolor in indoor air, an important airborne fungus in terms of occurrence and cause of health problems. Despite the good performance observed for that qPCR method, no discrimination could previously be made between A. versicolor, Aspergillus creber and Aspergillus sydowii.
Methods: In this study, we developed and evaluated an HRM assay for the discrimination between A. versicolor, Aspergillus creber and Aspergillus sydowii.
Results: Using HRM analysis, the discrimination of the 3 Aspergillus species could be made. No false positive, nor false negatives were observed during the performance assessment including 20 strains of Aspergillus. The limit of detection was determined for each species i.e., 0.5 pg of gDNA for A. creber and A. sydowii, and 0.1 pg of gDNA for A. versicolor. The HRM analysis was also successfully tested on environmental samples.
Conclusion: We reported the development of HRM tools for the discrimination of A. versicolor, A. creber and A. sydowii. However, this study could be considered as a study case demonstrating that HRM based on existing qPCR assays, allows a more accurate identification of indoor air contaminants. This contributes to an improved insight in the diversity of indoor airborne fungi and hence, eventually in the causal link with health problems.
Keywords: Aspergillus, High resolution melting analysis, Indoor air, Public health, Molecular method
* Correspondence:sigrid.dekeersmaecker@wiv-isp.be
1Platform Biotechnology and Molecular Biology, Scientific Institute of Public
Health (WIV-ISP), J. Wytsmanstraat 14, 1050 Brussels, Belgium Full list of author information is available at the end of the article
© The Author(s). 2017 Open Access This article is distributed under the terms of the Creative Commons Attribution 4.0 International License (http://creativecommons.org/licenses/by/4.0/), which permits unrestricted use, distribution, and reproduction in any medium, provided you give appropriate credit to the original author(s) and the source, provide a link to the Creative Commons license, and indicate if changes were made. The Creative Commons Public Domain Dedication waiver (http://creativecommons.org/publicdomain/zero/1.0/) applies to the data made available in this article, unless otherwise stated.
Background
Today, the contamination of indoor air of buildings by fungi is suggested to be associated with public health problems [1]. However, the causal link between fungal air contamination and respiratory problems is still not well understood. This is partly due to the issues related to the detection and identification of fungal species in in-door air. Indeed classically, the detection and monitoring workflow of indoor fungal contamination are based on the microscopic identification of fungi obtained after a cultiva-tion step [2, 3]. This culture-dependent workflow leads to some bias in the diversity observed due to e.g., species competition on plate, uncultivable species or dead fungi [2–5]. However, these by classical workflow undetected species could affect human health [5]. To avoid this bias, the use of culture-independent, molecular techniques seems to be more advantageous than the classical work-flow [4, 6]. That is why PCR [7, 8] and real-time PCR (qPCR) are currently increasingly used for the monitoring of indoor airborne fungi [7, 9–12].
Although qPCR methods are specific and allow the identification up to species level, genetically close species are sometimes difficult to be discriminated using these molecular tools. For example, we previously proposed a qualitative qPCR SYBR®Green method targeting the ITS2 region (Aversi_ITS assay) for the detection of Aspergillus versicolor [13], an important indoor fungal contaminant [2, 14, 15]. Among the 10 species from the indoor air background that had been included in the specificity test, this tool developed for the specific detec-tion of A. versicolor resulted in false positives only for the DNA of 2 genetically close species, i.e., Aspergillus creber and Aspergillus sydowii, belonging to the same group of Versicolores.
As previously elaborated [13], these 3 species are difficult to be discriminated, both morphologically as genetically. The available Taqman assays of the United States Environ-mental Protection Agency (EPA) for the specific detection of A. versicolor and A. sydowii respectively, also amplify both species each time [11, 16]. For A. creber, no Taqman assays have been developed and/or tested yet. Nevertheless, it has been observed that closely related species could show different antifungal patterns, which is important informa-tion to choose the appropriate therapeutic regime [17]. Additionally, Jurjeciv et al. [18] reported that, in a same en-vironmental context, the different species belonging to this Aspergillus group (including A. creber and A. versicolor) produce different concentrations of sterigmatocystin, a precursor of the aflatoxin B1 which is a well-known carcinogenic mycotoxin. A. sydowii is known as a non-sterigmatocystin producer [19]. These observations indicate that these 3 genetically closely related species belonging to the Versicolores group could have a different effect on health. However, it has not yet been investigated what the
difference is concerning the impact of their presence in indoor air on public health. Hereto, a rapid, culture-independent discriminative method is currently lacking. Therefore, this is an interesting case study for the development of a molecular method that can discriminate genetically close species of indoor airborne fungi.
In the present study, we developed a molecular method based on our previously proposed SYBR®Green qPCR method for the detection of A. versicolor [13], for the discrimination of A. versicolor, A. sydowii and A. creber. Indeed, the advantage of SYBR®Green includes the possibility to discriminate different amplicons based on their melting temperature (Tm). However, despite
nucleotide variations between the 3 amplicons obtained for respectively A. versicolor, A. sydowii and A. creber, poor discrimination could be made with a classical melt-ing curve analysis [13]. In this context, the technology of high resolution melting (HRM) could offer a good alter-native method for the discrimination of species closely related at the genetic level. Unlike the SYBR®Green chemistry, the dye used for HRM analysis is a saturating dye, such as the Evagreen dye. Consequently, all ampli-cons obtained after the DNA template amplification are saturated by the dye improving the detection of nucleo-tide variations, in combination with a high resolution qPCR instrument allowing a very detailed analysis of the melting behavior [20]. Based on this particularity, genetic-ally closely related species can be distinguished with HRM analysis as it was shown for Candida species and some other invasive fungal species [21–23] including some As-pergillus species [24]. The HRM analysis groups together (i.e., clusters) samples with similarities in the shape of the melting curves, which is the outcome of an HRM experi-ment. By including positive controls for each of the ex-pected species, the discrimination in species-specific clusters can be done.
By taking 3 Aspergillus species closely related at the genetic level as a case study, we deliver the proof-of-concept that existing SYBR®Green qPCR methods can be further developed using HRM into more discriminating molecular methods. These offer the possibility to im-prove the identification of indoor airborne fungi, thereby eventually contributing to establishing the causal link between these contaminants and adverse health effects.
Methods
Strains, culturing and DNA isolation
All the species and strains used in this study were previ-ously used to develop the qPCR SYBR®Green Aversi_ITS assay [13]. All of these strains were purchased from the BCCM/IHEM collection (Brussels, Belgium) and are listed in Table 1, i.e., A. creber, A. sydowii, A. versicolor and P. chrysogenum. Culturing and the DNA extraction protocols were previously described in Libert et al. [13].
qPCR and high resolution melting (HRM) conditions
The HRM assays were performed using a CFX96 Touch™ Real-Time PCR Detection System and the CFX manager 3.1 software (Biorad, Temse, Belgium).
The qPCR program was previously described and opti-mized [13]. The following thermal cycling conditions were used i.e., 1 cycle at 95 °C for 2 min for the complete acti-vation of the hot-start DNA polymerase, 40 cycles at 95 ° C for 10 s for the denaturing step, followed by one step at 60 °C for 30 s (annealing and extension), and a final exten-sion at72 °C for 30 s. The PCR amplification was followed by the HRM analysis which is performed in 2 stages, adapted from the instruction manual for the Precision Melt Supermix (Biorad, Temse, Belgium). The first stage was the heteroduplex formation, i.e. 95 °C for 30 s and 60 °C for 1 min. The second step was the high resolution melting (HRM) itself between 63 and 95 °C with an incre-ment of 0.10 °C each 10 s.
As recommended by the manufacturer, the reaction mix (20 μl final volume) contained 10 μl of Precision Melt
Supermix with Evagreen dye (Biorad, Temse, Belgium), 1.2μl of Aversi_ITS f and Aversi_ITS r (Eurogentec, Liège, Belgium) at 300 nM final concentration each [13], and 2.6μl of Gibco® DNase, RNase, Protease free pure water (Life Technologies, Gent, Belgium). In each well, an equal amount of 5 μl of each genomic DNA (gDNA) template (1 ng per μl, so 5 ng gDNA in total per well) was added to the reaction mix. During the optimization phase of the HRM assay, 5 ng of gDNA was analyzed in duplicate, each in two independent runs. In each assay a non DNA template control (NTCwater) composed
of Gibco® DNase, RNase, Protease free pure water (Life Technology, Gent, Belgium) and 3 positive controls i.e., A. creberIHEM 2646 (5 ng of gDNA), A. versicolor IHEM 18884 (5 ng of gDNA) and A. sydowii IHEM 20347 (5 ng of gDNA) were added.
HRM data analysis
The melt-curve data were analyzed with the Biorad Preci-sion Melt Analysis software 1.2 (Biorad, Temse, Belgium).
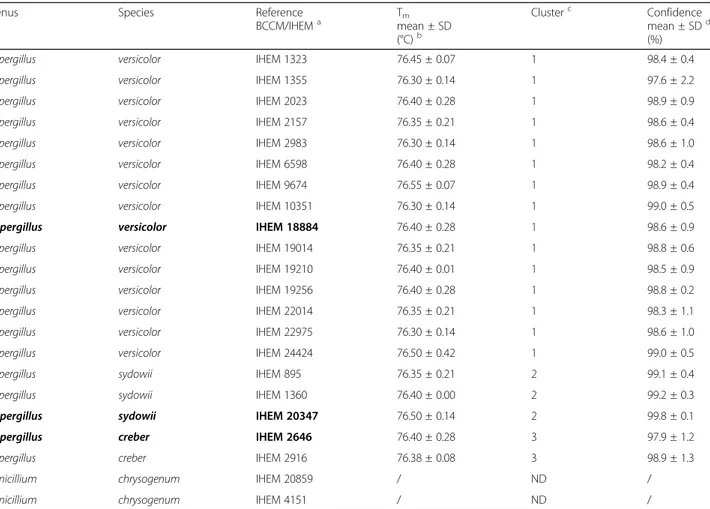
Table 1 Species discrimination by HRM analysis
Genus Species Reference
BCCM/IHEMa Tmmean ± SD
(°C)b
Clusterc Confidence
mean ± SDd
(%)
Aspergillus versicolor IHEM 1323 76.45 ± 0.07 1 98.4 ± 0.4
Aspergillus versicolor IHEM 1355 76.30 ± 0.14 1 97.6 ± 2.2
Aspergillus versicolor IHEM 2023 76.40 ± 0.28 1 98.9 ± 0.9
Aspergillus versicolor IHEM 2157 76.35 ± 0.21 1 98.6 ± 0.4
Aspergillus versicolor IHEM 2983 76.30 ± 0.14 1 98.6 ± 1.0
Aspergillus versicolor IHEM 6598 76.40 ± 0.28 1 98.2 ± 0.4
Aspergillus versicolor IHEM 9674 76.55 ± 0.07 1 98.9 ± 0.4
Aspergillus versicolor IHEM 10351 76.30 ± 0.14 1 99.0 ± 0.5
Aspergillus versicolor IHEM 18884 76.40 ± 0.28 1 98.6 ± 0.9
Aspergillus versicolor IHEM 19014 76.35 ± 0.21 1 98.8 ± 0.6
Aspergillus versicolor IHEM 19210 76.40 ± 0.01 1 98.5 ± 0.9
Aspergillus versicolor IHEM 19256 76.40 ± 0.28 1 98.8 ± 0.2
Aspergillus versicolor IHEM 22014 76.35 ± 0.21 1 98.3 ± 1.1
Aspergillus versicolor IHEM 22975 76.30 ± 0.14 1 98.6 ± 1.0
Aspergillus versicolor IHEM 24424 76.50 ± 0.42 1 99.0 ± 0.5
Aspergillus sydowii IHEM 895 76.35 ± 0.21 2 99.1 ± 0.4
Aspergillus sydowii IHEM 1360 76.40 ± 0.00 2 99.2 ± 0.3
Aspergillus sydowii IHEM 20347 76.50 ± 0.14 2 99.8 ± 0.1
Aspergillus creber IHEM 2646 76.40 ± 0.28 3 97.9 ± 1.2
Aspergillus creber IHEM 2916 76.38 ± 0.08 3 98.9 ± 1.3
Penicillium chrysogenum IHEM 20859 / ND /
Penicillium chrysogenum IHEM 4151 / ND /
The strains in bold are considered as a reference used for the assay development and are fully characterized as respectively A. creber, A. sydowii and A. versicolor.a
Pure strains from the BCCM/IHEM collection.b
Average of the Tm± standard deviation (SD) obtained for each strain analyzed in duplicate during 2 independent
runs.c
Cluster 1, 2 and 3 were defined with the Biorad Precision Melt Analysis software 1.2 (Temse, Belgium). ND: not detected.d
Average of the percentage of confidence (± standard deviation SD) from the mean of the cluster, defined with the Biorad Precision Melt Analysis software 1.2 (Temse, Belgium). The percentage of confidence threshold was defined as 95%, below this threshold the result is considered as not acceptable as a true positive
A sample is defined as positive for a specific species, if an amplicon is obtained, if the observed Tmcorresponds
to the Tm defined by Libert et al. [13] for A. versicolor
(i.e., 76.5 ± 0.18 °C) and if the sample is classified in the same cluster as the cluster defined for its respective positive control. The software also calculates a percent confidence. This value provides a percentage chance that a given well is correctly categorized within the assigned cluster. It is based on the number of standard deviations the sample is from the mean of the cluster. This assumes that the found “cluster means and standard deviations” are accurate descriptions of the real probability distributions of the data [25]. The threshold of the percent confidence was fixed at 95%. Below this limit, the sample was considered as not acceptable as a true positive.
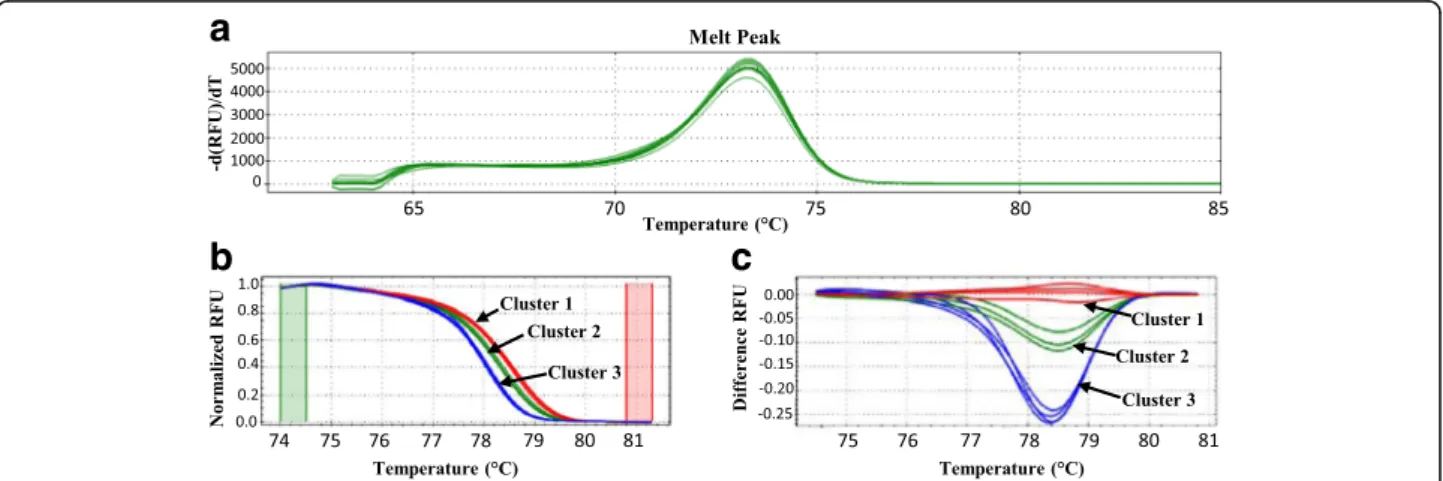
The clustering of each sample can be visualized by the software with different charts, e.g. the melt peak curve, the normalized melt curve chart and the difference curve chart. The melt peak curve (Fig. 1a) shows the derivative of the fluorescence versus temperature, indi-cating the Tm. The normalized melt curve (Fig. 1b)
shows a normalized view of the melt curve of each sam-ple (Pre-melt (initial) and post-melt (final) fluorescence signals of all samples are normalized to relative values of 100% and 0%, differences in background fluorescence between curves are eliminated) and plots their relative fluorescence unit (RFU) against the temperature. The difference curve (Fig. 1c) magnifies curve differences by subtracting each curve from the most abundant type or from a user-defined reference. By setting a baseline, small differences between the RFU obtained for each cluster become visible.
Sensitivity test: limit of detection
To evaluate the sensitivity of the use of the Aversi_ITS f/ r primers for the HRM application, a serial dilution of gDNA of A. creber BCCM/IHEM 2646, A. sydowii BCCM/IHEM 20347 and A. versicolor IHEM 18884, de-fined as a reference by Libert et al. [13] for the perform-ance assessment of the Aversi_ITS assay, was made and the limit of detection (LOD) was determined. A serial of 10 dilutions from 1000 to 0.01 pg (i.e., 1000, 500, 50, 10, 5, 1, 0.5, 0.1, 0.05, 0.01 pg) was analyzed in duplicate with 6 independent runs. To comply with the Precision Melt Supermix requirements on the minimum amount of DNA to be present in the well, all the dilutions were made in 10 ng deoxyribonucleic acid sodium salt from salmon testes i.e., salmon sperm DNA (Sigma-Aldrich, Diegem, Belgium). In each assay, a negative control (NTCsalmon sperm), i.e., 10 ng of salmon sperm DNA
(Sigma-Aldrich, Diegem, Belgium) and NTC (composed of Gibco® DNase, RNase, Protease free pure water) were added. The LOD was determined as the lowest amount of gDNA where for at least 11 out of the 12 repetitions the amplicon (with the correct Tm) and the correct
cluster (with confidence >95%) were obtained.
Symmetric and asymmetric DNA concentration test
In order to evaluate the discriminative power of the HRM assay, 12 mixes of gDNA of A. creber, A. sydowii and A. versicolor were analyzed in duplicate. The mixes’ composition is presented in the first part of Table 3. Briefly, first 5 ng of gDNA from a mix (A) containing an equal amount of gDNA from each targeted species (i.e., 5 ng of each species for 5μl of total volume of mix) that were mixed together (Table 3) was analyzed with HRM.
Fig. 1 High resolution melting analysis plots. HRM analysis results are illustrated with (a) melt peak curves, (b) the normalized melt curves and (c) the difference plots. Each cluster was defined with the Biorad Precision Melt Analysis software 1.2 (Temse, Belgium). The red curves correspond to A. versicolor strains, the green curves to A. creber strains and the blue curves to A. sydowii. gDNA of each strain, i.e., A. creber IHEM 2646 (5 ng of gDNA), A. versicolor IHEM 18884 (5 ng of gDNA) and A. sydowii IHEM 20347, was tested in duplicate in 2 independent runs. RFU: relative fluorescence units
To assess the capacity of the HRM assay to detect and discriminate the 3 targets in an imbalanced mix of gDNA, as it could occur in environmental samples, a second (B to G) set of mixes was analyzed (Table 3). In mixes B to D, 2 species were introduced with an equal amount of gDNA (i.e., 5 ng both for 5μl of total volume of mix) and a third one at the LOD; in mixes E to G, one species dominated the others (i.e., 25 ng for 5 μl of total volume of mix), while the 2 others were added at the same amount of gDNA (i.e., 5 ng both for 5 μl of total volume of mix). Each HRM analysis was performed in duplicate with 5μl of gDNA mix. The strains used for the mixes were the BCCM/IHEM 2646 for A. creber, the BCCM/IHEM 895 for A. sydowii and the BCCM/IHEM 10351 for A. versicolor.
In each assay, an NTC (no DNA) and 3 positive con-trols were added to the assay i.e., A. creber IHEM 2646 (5 ng of gDNA), A. versicolor IHEM 18884 (5 ng of gDNA) and A. sydowii IHEM 20347 (5 ng of gDNA). At the time of these experiments, the strain BCCM/IHEM 2646 was the only confirmed strain of A. creber available in the collection. During the redaction of this manu-script, a new A. creber strain (BCCM/IHEM 2916) was added to the BCCM/IHEM collection. To verify whether a correct discrimination could be done for this new strain, a test was performed following the conditions de-scribed in the sections qPCR and high resolution melt conditions and HRM data analysis (Table 1). The results matched with those previously obtained with the strain BCCM/IHEM 2646. Therefore it was decided that the strain A. creber BCCM/IHEM 2646 could be used as a representative for A. creber in the symmetric and asymmetric concentration tests.
Specificity assessment
In order to verify that the discrimination of the 3 targeted species (A. creber, A. sydowii, A. versicolor) can be done in the presence of a non-targeted species (P. chrysogenum), 3 additional mixes (H to J, Table 3) were tested, where P. chrysogenum replaced one of the 3 As-pergillus species. The pure strain P. chrysogenum BCCM/IHEM 20849 was selected as a negative control. The mixes H, I and J have equal composition containing 5 ng per Aspergillus species and 25 ng for P. chryso-genum (Table 3). The mix K was introduced as a nega-tive control containing only 5 ng of P. chrysogenum gDNA extracted from the strain BCCM/IHEM 20849 (Table 3). In each assay, an NTCwater and 3 positive
controls were added i.e., A. creber IHEM 2646 (5 ng of gDNA), A. versicolor IHEM 18884 (5 ng of gDNA) and A. sydowii IHEM 20347 (5 ng of gDNA). The strains used for the mixes were the BCCM/IHEM 2646 for A. creber, the BCCM/IHEM 895 for A. sydowii and the BCCM/IHEM 10351 for A. versicolor.
Proof-of-concept using environmental air samples
To assess the performance of the Aversi_ITS assay to discriminate the 3 targeted Aspergillus spp. using the HRM technology, 4 environmental samples previously collected in a single contaminated house and previously analyzed with the Aversi_ITS assay and classical identifi-cation methods [13], were used. The sampling protocol, the classical method of identification (i.e., counting and microscopic identification) and the gDNA extraction have been previously described [13]. The HRM analysis was performed in duplicate in 4 independent repeats, as described above. In addition to using the DNA extracted from the environmental samples as such, in a second round of experiments, in order to avoid any issues with the HRM supermix, 10 ng of salmon sperm DNA was added to all DNA mixtures prior to HRM analysis. As mentioned above, each HRM analysis included a positive control for each of the species to be discriminated (25 ng of gDNA).
To be sure that no inhibition occurs during the HRM analysis and in order to verify that all the 3 species can be detected and discriminated with the HRM analysis, two sets of gDNA from pure cultures were spiked into one environmental sample where A. versicolor was not detected by classical nor qPCR methods (i.e., sample 3). A first set contained 25 ng gDNA extracted from pure culture (A. creber 2646 IHEM/BCCM, A. sydowii 895 and A. versicolor 10,351) spiked into the DNA extracted from the environmental sample 3. In addition, spikes were made with an amount of DNA for each of the targeted species at the LOD in order to verify whether a very small amount could be detected in this environ-mental sample. Similarly to what was done with the ‘pure’ environmental samples, a second set of sample was made with an addition of salmon sperm DNA (10 ng) into the spiked samples in order to increase the DNA amount available for the supermix (cfr. The sensi-tivity test). As mentioned above, in each assay, a NTCwater, a NTCsalmon spermand 3 positive controls were
added i.e., A. creber IHEM 2646 (25 ng of gDNA), A. versicolor IHEM 18884 (25 ng of gDNA) and A. sydowii IHEM 20347 (25 ng of gDNA).
Results
HRM assay development
The HRM analysis reported in this study is based on a previously published qPCR SYBR®Green assay [13], called Aversi_ITS. In that study [13], during the perform-ance assessment, the specificity was tested for 10 species frequently found in indoor air i.e., Alternaria alternata, A. creber, Aspergillus fumigatus, A. sydowii, A. versicolor, Cladopsorium cladosporioides, Cladosporium herbarum, Penicillium chrysogenum, Stachybotrys chartarum and Ulocladium botrytis. This test showed to be specific for
A. versicolor, i.e. no amplification for the non-targeted species, with the exception of A. creber and A. sydowii which yielded an amplicon with the same Tm than the
one observed for A. versicolor (i.e., 76.5 °C).
Therefore, the species discrimination using the Aver-si_ITS assay was optimized using the HRM approach as elaborated in Materials and Methods for the species for which amplification was obtained with the Aversi_ITS assay. Hereto, firstly, the HRM assays were performed in duplicate using gDNA extracted from pure strains acting as reference strains in Libert et al. [13] i.e., the BCCM/IHEM strain 18,884 for A. versicolor, the BCCM/IHEM strain 20,347 for A. sydowii and the BCCM/IHEM strain 2646 for A. creber. The 3 reference strains showed an expected melt-ing temperature (Tm) ranging between 76.40 ± 0.28 and
76.50 ± 0.14 and could be classified each in a different clus-ter (Fig. 1a, b, c ; Table 1). Clusclus-ter 1 grouped together all the replicates of the A. versicolor BCCM/IHEM 18884 with a confidence of 98.6 ± 0.9. Cluster 2 was defined by all the replicates from the A. sydowii BCCM/IHEM 20347 strain with a confidence of 99.8 ± 0.1. Finally, all the replicates from the A. creber BCCM/IHEM strain 2646 were classi-fied in cluster 3 with a confidence of 97.9 ± 1.2.
Subsequently, all other strains available in the BCCM/ IHEM collection and belonging to the species A. creber, A. versicolor or A. sydowii were tested. The Tm of the
ob-tained amplicon was determined to verify the PCR amplifi-cation step. As previously reported [13], gDNA of all species tested resulted in an amplicon with a Tm around
76.5 ± 0.18 °C (Table 1). No amplification was observed in any of the NTCs added to the assays. All the strains of A. versicolorwere grouped in cluster 1 defined by the refer-ence strain BCCM/IHEM 18884 with a confidrefer-ence defined between 97.6 ± 2.2% and 99.0 ± 0.5%. Those of A. sydowii were grouped in cluster 2 defined by the reference strain BCCM/IHEM 20347 with a confidence ranging between 99.1 ± 0.4% and 99.2 ± 0.3% and those of A. creber in clus-ter 3 defined by the reference strain BCCM/IHEM 2646 with 98.9 ± 1.3% of confidence. In Additional file 1, the normalized melt curves and difference curves for each of the tested strain have been depicted to illustrate the inter-and intra-species variabilities. These results are in line with what was expected based on the alignment of the ampli-fied region in each of the strain tested (Additional file 2).
P. chrysogenum was tested as negative control because of its phylogenetic proximity with the Aspergillus genus [26] and its importance in indoor air contamination [10, 27]. Two different strains were included, but they did not yield an amplicon as expected based on the selectivity previously determined for the Aversi_ITS assay [13].
Sensitivity test: limit of detection
To define the lowest amount of gDNA that can be discriminated with the HRM analysis, a serial dilution,
from 1000 to 0.01 pg in 10 steps repeated in duplicate in 6 independent runs was tested (Table 2). Because the HRM supermix cannot be used with an amount of input DNA lower than 0.1 ng, all the dilutions were made in salmon sperm DNA. No amplification was observed in the nega-tive controls i.e., NTCwater and NTCsalmon sperm(data not
shown). For A. versicolor, the LOD of the Aversi_ITS qPCR assay was previously defined at 1 copy of gDNA [13] which corresponds to 0.05 pg of gDNA. In the HRM assay, A. versicolor was amplified until 0.1 pg of gDNA with 12/12 positive detection events and until 0.05 pg of gDNA with 10/12 positive detections, i.e. correct amplicon and cluster and confidence >95%. Below this limit of 0.05 pg, no amplification was observed for A. versicolor in the tested concentrations. A. creber and A. sydowii were de-tected with minimum 11/12 positive detection events until 0.5 pg of gDNA (Table 2). As shown in Table 2, the dis-crimination in the 3 different clusters could be made with HRM until 0.5 pg of gDNA, under this limit no discrimin-ation could be made between A. creber and A. sydowii. Based on these observations, the LOD for the HRM assay was defined at 0.5 pg of gDNA for A. creber and A. sydowii and at 0.1 pg for A. versicolor (Table 2).
Symmetric and asymmetric DNA concentration test
The capacity to detect and to discriminate the 3 Asper-gillus species when they are mixed, was tested with two different types of mix composition i.e., a symmetric mix including an equal amount of gDNA from each targeted species (A. creber, A. sydowii and A. versicolor) and a asymmetric mix composed of a different amount of gDNA from the 3 Aspergillus species, including one species present at LOD, and mixes that contained the negative control P. chrysogenum.
The HRM analysis of the symmetric mix A (i.e., a mix of 5 ng of gDNA of each Aspergillus species) yielded 3 different peaks in the Melt Peak Chart, reflecting the presence of the 3 targeted Aspergillus species (Table 3). The melting profiles were clustered in another cluster than the ones corresponding to the positive controls where only one target species was present, each time with a confidence % above 95% (Table 3).
In the 3 first asymmetric mixes (i.e., mixes B, C and D, Table 3), the amount of gDNA from one of the 3 Asper-gillus species was taken at the LOD previously defined i.e., 0.1 pg for A. versicolor and 0.5 pg for the 2 others. The results obtained were similar (i.e., 3 peaks, correct cluster, confidence % in the same range) to those observed with the symmetric mix, even when the amount of gDNA was at the LOD (Table 3). In the mixes E, F and G, one of the 3 species was added in a higher amount than that of the other 2. Once again, the 3 peaks and the cluster corresponding to the mixed species were found with high confidence with all mix configurations (Table 3).
Table 2 Limit of detection of HRM assay Para meter Ge nus Specie s a Cluster b gDNA amoun t (pg) 1000 500 50 10 5 1 0.5 0.1 0.05 0.01 Detect ion c Asp er gillus crebe r 3 12/12 12/12 12/12 12/1 2 12 /12 12/1 2 11/12 6/12 0/ 12 0/12 Asp er gillus sydowi i 2 12/12 12/12 12/12 12/1 2 12 /12 12/1 2 11/12 9/12 0/ 12 0/12 Asp er gillus versicolor 1 12/12 12/12 12/12 12/1 2 12 /12 12/1 2 12 /12 12/12 10/1 2 0/12 Conf idenc e (%) d Asp er gillus crebe r 3 97.98 ± 1.28 96.66 ± 1.54 99.03 ± 0.59 99.30 ± 0.29 99 .70 ± 0.02 97.99 ± 0.53 96 .65 ± 0.36 97.99 ± 0.53 . / / Asp er gillus sydowi i 2 98.72 ± 0.39 99.25 ± 0.26 99.28 ± 1.66 99.67 ± 1.12 98 .840 ± 2.34 96.83 ± 3.11 95 .63 ± 1.63 95.83 ± 3.11 / / Asp er gillus versicolor 1 98.99 ± 0.26 99.23 ± 0.35 99.49 ± 2.01 98.93 ± 0.60 99 .76 ± 096 98.52 ± 2.32 97 .49 ± 0.11 97.60 ± 1.06 96.3 7 ± 1.540 / agDNA extracted from pure strains from the BCCM/IHEM collection. BCCM/IHEM strains used as reference: A. creber IHEM 2646, A. sydowii IHEM 26347, A. versicolor IHEM 18884 bCluster defined with the Biorad Precision Melt Analysis software 1.2 (Temse, Belgium) cDetection: Number of positive signals i.e., correct cluster and confidence >95%, observed for each dilution, the LOD for each species is indicated in bold dConfidence (%) is the average and standard deviation (±SD)
Table 3 Symmetric, asymmetric and specificity assessment of different mixes Para meter Sp ecies a Mi x AB C D E F G H I J K DNA amou nt (ng ) b,c A. creber 5 LOD c 55 2 5 55 05 5 0 A. sydowii 55L O D 552 5 55 050 A. versicolor 555 LO D 55 2 5 5 500 P . chr ysogen um 000 000 02 5 2 5 2 5 5 Cluster d 444 444 45 67N D Peak s in Melt Peak Chart obse rved e 72 .40 ± 0.00 72.40 ± 0.00 72.40 ± 0.00 72 .40 ± 0.00 72.40 ± 0.00 72.50 ± 0. 14 72.5 0 ± 0.14 78.40 ± 0.00 77 .20 ± 0.28 78.10 ± 0.14 ND 80 .60 ± 0.00 80.60 ± 0.00 80.60 ± 0.00 80 .60 ± 0.00 80.60 ± 0.00 80.60 ± 0. 00 80.6 0 ± 0.00 81.60 ± 0.00 85 .00 ± 0.00 82.40 ± 1.41 85 .40 ± 0.00 85.40 ± 0.00 85.60 ± 0.00 85 .60 ± 0.00 85.50 ± 0.14 85.40 ± 0. 00 85.4 0 ± 0.00 Conf idenc e (%) f 99 .85 ± 0.07 99.75 ± 0.07 99.55 ± 0.35 96 .65 ± 2.33 99.85 ± 0.07 99.85 ± 0. 07 99.2 5 ± 1.06 99.30 ± 0.00 99 .60 ± 0.00 99.10 ± 0.56 ND agDNA extracted from pure strains from the BCCM/IHEM collection bEach assay contained 4 pure strains i.e., BCCM/IHEM 2646 for A. creber , BCCM/IHEM 895 for A. sydowii , BCCM/IHEM 10351 for A. versicolor , and BCCM/IHEM 4151 for P. chrysogenum . The former 3 were used as positive control and resulted in cluster 1 (A. versicolor ), cluster 2 (A. sydowii ) and cluster 3 (A. creber ). For P. chrysogenum , used as negative control, no amplification and hence no cluster was obtained. Each HRM reaction was done with 5 μ l of mix cLOD defined as the limit of detection defined for each species i.e., 0.1 pg for A. versicolor and 0.5 pg for A. creber and A. sydowii dDetection parameters i.e., clusters defined with the Biorad Precision Melt Analysis software 1.2 (Temse, Belgium). ND: no amplicon obtained, no clu ster detected ePeak observed in the Melt Peak chart given by the Biorad Precision Melt Analysis software 1.2 (Temse, Belgium) – this does not correspond to the Tm of each separate amplicon of the different species fConfidence (%) is the average of each percentage of confidence defined with the Biorad Precision Melt Analysis software 1.2 (Temse, Belgium) obtaine d for each repetition and standard deviation (±SD)
Specificity assessment
Although the Aversi_ITS assay was previously shown to be specific for A. versicolor, as evaluated for the 10 most frequent species from the indoor air background, the discrimination between A. versicolor, A. creber and A. sydowii was not observed in classical qPCR [13]. To evaluate that the discrimination of these 3 Aspergillus species by the HRM method is not influenced by the presence of non-targeted species, even at a dominant concentration, 3 others mixes were made and analyzed with HRM.
In mixes H, I and J, one of the targeted species was removed from the mix (Table 3), and replaced by 25 ng of P. chrysogenum gDNA and analyzed with the Aversi_ITS HRM method. For each of the mixes, we obtained 2 peaks in the Melt Peak Chart (Table 3). Each of the mixes was assigned another cluster than the one obtained for the positive controls or the mixes with 3 species, each time with a confidence above 95% (Table 3). For mix K, where P. chrysogenum was the only spe-cies present, no amplification was obtained, and hence no cluster was assigned (Table 3). This was expected based on the results of Libert et al. [13].
Proof-of-concept
In order to verify whether this HRM analysis could be used on real-life samples, 4 environmental air samples, previously analyzed by classical methods (i.e., plate counting and microscopic identification) and by qPCR for the detection of A. versicolor [13], were re-analyzed with the Aversi_ITS HRM assay.
As summarized Table 4, the Aversi_ITS HRM analysis defined 3 different clusters for the 3 positive controls with or without the addition of salmon sperm DNA. The 2 NTCs (NTC water and NTC salmon sperm) did not yield
an amplicon.
Three environmental samples (i.e., samples 1, 2 and 4), with or without the addition of salmon sperm DNA, gave a positive signal for A. versicolor and were all classified in only one cluster corresponding to the one of the A. versi-colorpositive control. The number of positive detections (i.e., amplification and classification in the correct cluster and confidence above 95%) of the 8 repetitions was between 5/8 and 8/8 with a confidence ranging between 98.58 ± 0.55 and 99.76 ± 0.01 (Table 4). The lowest number of positive detections and the lowest confidence were obtained for a sample without the addition of salmon sperm DNA. These results were in accordance with those previously obtained by classical methods and qPCR where A. versicolor was found on plate and detected by qPCR [13]. No amplification and consequently no cluster, was observed for the sample 3. This result was also obtained with the classical analysis [13], where no A. versicolor was detected on plate (Table 4).
Based on the above described results, it could be concluded that the 3 environmental samples contained the A. versicolor species, and not one of the 2 species closely related at the genetic level belonging to the same Versicolores group. However, in order to verify that if one of the other 2 species would have been present, it would have been possible to be detected in the environ-mental sample, a spike test with each of the targeted species was performed as described in Methods. At the highest gDNA concentration, with or without salmon sperm DNA, all the species were detected and classified in the correct cluster defined by the corresponding posi-tive control (Additional file 3). The same observations were made for all spikes at LOD with a confidence be-tween 97.70 ± 1.56% and 99.08 ± 1.14% and a positive rate between 5 and 8 for the 8 repetitions depending on the addition of salmon sperm DNA (Additional file 3: Table).
Discussion
Currently, an increasing amount of studies are focused on fungal indoor contamination and its impact on public health [9, 10, 15, 28–32]. To rapidly detect and identify the fungal contaminants, qPCR holds a great potential in comparison to the classical methods based on plate coun-ting and microscopy. Indeed, this molecular technique is rapid, sensitive, easy to use and culture independent [4]. However, some issues could occur especially for the discrimination of species closely related at the genetic level. This problem was highlighted by Libert et al. [13] during the development of a SYBR®Green qPCR tool for the detection of A. versicolor (Aversi_ITS), an important contaminant of indoor environment. Even if this Aversi_ITSassay is fast, efficient, sensitive and specific for A. versicolor as evaluated for the 10 most frequently occurring fungal species in indoor air, no discrimination between A. versicolor, A. creber and A. sydowii could be previously made. Indeed the insufficient variation of nu-cleotides inside their respective amplicons yielded a too similar Tm value impeding discrimination by qPCR [13].
Nevertheless, the accurate identification of fungal conta-minants is important to eventually determine the causal link between indoor airborne fungal pollution and respira-tory health problems.
In this context, to improve the specific detection of A. versicolor in indoor air and to discriminate it from the other targets A. creber and A. sydowii, a post-qPCR HRM was optimized on the basis of the Aversi_ITS assay [13]. The HRM analysis developed in this study showed the possibility to improve the Aversi_ITS qPCR assay by the discrimination of A. versicolor from A. creber and A. sydowii. All the strains for the 3 species that were available in the BCCM/IHEM collection were not only detected
but also classified with a high confidence in 3 different clusters (Table 1, Fig. 1a, b, c), demonstrating the inclusi-vity and discriminative power of the assay.
The absence of amplification when using gDNA of the 2 P. chrysogenum negative controls (Table 1) confirms the exclusivity of the primers of the Aversi_ITS assay. These results confirmed those previously shown by Libert et al. [13], during an exclusivity test on 10 species selected as the most detected fungal species in indoor air where no amplification was obtained for the non-targeted species.
During this study, a total of 20 strains of Aspergillus were tested, including all strains available for each species in the BCCM/IHEM collection i.e., 2 strains for A. creber, 3 for A. sydowii, and 15 for A. versicolor. In our previous study on the Aversi_ITS development [13],
we made a sequence alignment with all the sequences of A. creber, A. sydowii and A. versicolor available in the NCBI database at the date of analysis, which corre-sponds to the alignment with the sequences of all A. creber, A. sydowii and A. versicolor strains used during the development of the HRM assay (Additional file 2). In this study, because these Aspergillus species are genetically grouped in the Versicolores group, primer exclusivity was also verified using an alignment of primers sequences and all the ITS sequences available in the NCBI database for all the species from this group, i.e. Aspergillus amoenus, Aspergillus austroafricanus, Aspergillus cvjetkovicii, Aspergillus fructus, Aspergillus jensenii, Aspergillus protuberus, Aspergillus puulaauensis, Aspergillus subversicolor, Aspergillus tabacinus, Aspergillus
Table 4 Environmental test
Sample Sample type Speciesa Amount of
DNA/HRM analysis (ng)b Salmon spermc Cluster d Percentage of
confidence (%)d Number ofpositive
detectionse
Control
NTCwater water only water only 0 No N/A /
NTCsalmon sperm Salmon sperm only Salmon sperm only 10 Yes N/A /
Positive control Pure culture A. creber 25 No 3 95.74 ± 7.07 4/4
Positive control Pure culture A. creber 25 Yes 3 97.32 ± 3.90 4/4
Positive control Pure culture A. sydowii 25 No 2 97.91 ± 3.26 4/4
Positive control Pure culture A. sydowii 25 Yes 2 98.89 ± 0.97 4/4
Positive control Pure culture A. versicolor 25 No 1 99.16 ± 0.49 4/4
Positive control Pure culture A. versicolor 25 Yes 1 97.99 ± 2.38 4/4
Environmental sample
Sample 1 Indoor air sample A. versicolor 19.8 No 1 99.15 ± 0.08 6/8
Yes 1 99.76 ± 0.01 7/8
P. chrysogenum
Sample 2 Indoor air sample A. versicolor 21.7 No 1 98.10 ± 0.88 5/8$
Yes 1 98.93 ± 0.45 7/8
A. glaucus P. chrysogenum yeast (undetermined)
Sample 3 Indoor air sample P. chrysogenum 53.3 No N/A
Yes N/A
Sample 4 Indoor air sample A. versicolor 50 No 1 98.81 ± 1.90 5/8$
Yes 1 98.58 ± 0.55 8/8
infertile mycelium P. chrysogenum
$
At least one repetition is considered as negative due to a confidence below the 95 % threshold
a
Determined with classical methods i.e. plate culture and microscopic analysis (determination and counting) in Libert et al. [13]
b
Amount of DNA extracted from air samples of 1.5 m3
; DNA amount determined with a Nanodrop® 2000; 5μl of extracted DNA (5 ng/μl) were used in a 20 μl -HRM analysis
c
Salmon sperm (salmon sperm) DNA carrier added (10 ng)
d
Cluster and % of confidence ± standard deviation (SD) defined with the Biorad Precision Melt Analysis software 1.2 (Temse, Belgium)
e
A sample is defined as positive for a specific species, if an amplicon is obtained, if the observed Tmcorresponds to the Tm defined by Libert et al. [13] for A.
tennesseensisand Aspergillus venenatus. As these showed several nucleotide variations, i.e. more than 3 as is the case for A. versicolor, A. creber and A. sydowii, inside the amplicon (primers annealing site included) defined by the primers sequences, these species should be able to be discriminated from A. creber, A. sydowii and A. versi-color(based on the Tm) (Additional files 4 and 5).
The sensitivity for the HRM assay was also tested by defining the LOD for discrimination for each species. For A. versicolor, the LOD was previously determined for the Aversi_ITS qPCR assay at 1 or 2 copies of gDNA [13], corresponding to 0.05 pg of gDNA of A. versicolor. The LOD observed for A. versicolor in the HRM assay was determined at 0.1 pg of gDNA. This difference is due to the confidence threshold applied in this study (i.e., 95%). The dissimilarity observed between the LOD for the qPCR and HRM could be explained by the fact that an HRM analysis needs a higher amount of DNA templates to discriminate with high confidence. Accor-ding to the user guide for the HRM analysis [25], the threshold for an HRM discrimination is observed around 30 Cq(corresponding to 0.5 pg of DNA of A. versicolor).
Above this Cq limit, the results are too variable. As no
LOD was defined in the previous study for A. creber and A. sydowii, a sensitivity test was performed for the HRM assay and the LOD for these two species was defined at 0.5 pg of gDNA (Table 2). Thus, as observed by Libert et al. [13] with the SYBR®Green chemistry, the Aversi_ITS primers are more efficient for the amplifi-cation of gDNA of A. versicolor than for the two other species. This difference of sensitivity could im-pact the level of detection in real-life samples where some species could be present in very low concentra-tion. However, in addition to the sensitivity assess-ment, HRM assays were performed on gDNA mixes from pure cultures of A. creber, A. sydowii and A. versicolor, present at different amounts, including at the LOD. The results obtained during these tests demonstrated that the HRM technology can be used to detect a mix of species, even when the gDNA mix is not equilibrated (Table 3). By including the appropriate positive controls (single target and different mixes of 2 and 3 pure strains) the species can be discriminated. However, it has to be mentioned that in real-life samples, the chances to find a mix of the 3 species, i.e. A. versicolor, A. creberand A. sydowii are rather small.
Sensitivity and discrimination were also observed for the environmental, i.e. indoor air samples containing gDNA from these 3 species. One of those samples, which was demonstrated to be negative for A. versicolor based on classical methods and qPCR [13], was used to spike the 3 targeted species for HRM analysis. No inhibition from the environmental sample matrix on the detection and discrimination of the 3 species was detected. The
discrimination between the 3 species could be made, even if one of them was present at the LOD or if a non-targeted species was present (e.g., P. chrysogenum) (Table 4 and Additional file 3).
In the other non-spiked indoor air samples, A. versicolor was detected, in accordance with the previous results obtained with classical methods based on culture and microscopic determination (Table 4). In each of these positive samples, A. versicolor was present with other common indoor air species (i.e., A. glaucus and P. chryso-genum) or with undetermined strains. This however did not affect the HRM-based detection, with a detection and discrimination of A. versicolor in each of the samples where the SYBR®Green Aversi_ITS qPCR method previ-ously detected A. versicolor [13]. However, based on the classical detection methods [13], it was observed that the level of contamination by A. versicolor in sample 2 was close to the LOD of the qPCR (i.e., 0.05 pg of gDNA). This could explain why the level of positive repetitions in the HRM analysis varied between 62.5% (5/8, without salmon sperm DNA added) and 100% (8/8, with salmon sperm DNA added) (Table 4). This might also indicate that adding salmon sperm DNA to the HRM reactions improves the performance of this assay, as a similar trend was observed for the other environmental samples. However, no statistical evidence could be obtained for this observation due to the low amount of total extracted DNA available per environmental sample for the analysis which limited the number of repetition which could be made.
In comparison to other powerful discriminatory methods such as high-throughput sequencing, the advantage of the HRM analysis is that is a faster (only 1 step, in comparison to multiple steps for sequencing) and more cost-effective method to highly accurately screen a large amount of samples for the presence of specific targets. In our study, HRM allowed to discrimi-nate 3 closely related Aspergillus species, thereby offer-ing a tool to investigate in future studies the specific impact of each species on health issues, which was until now not possible with the currently used methods. The HRM method can be easily implemented in a public health laboratory, with an instrument that is not that ex-pensive as and more user-friendly than a sequencer, and it does not require bioinformatics expertise which in contrast is needed to analyze high-throughput sequencing data. Additionally, sequencing errors can have an impact on the interpretation of high-throughput sequencing-based identi-fication methods, especially when the discrimination is based on a single nucleotide difference. So for our applica-tion, the HRM analysis is more advantageous than sequen-cing. For other applications, such as the determination of the diversity in a sample, high-throughput sequencing might be more suited.
Conclusions
Conclusively, our study, by taking 3 Aspergillus genetically closely related species as a case study, demonstrated that HRM analysis, based on existing qPCR methods, could be used to more accurately detect and identify indoor fungal contamination. HRM analysis offers the advantage to eas-ily discriminate genetically close species which are difficult to be distinguished. This increase in accuracy will improve data on indoor air fungal contamination. This is especially important for currently difficult to be discriminated spe-cies, but that could however diverge in terms of toxicity, allergenicity or pathogenicity. In this study, the proof of concept was delivered for the 3 species from the Versico-lores group based on a SYBR®Green Aversi_ITS qPCR method previously developed for A. versicolor [13]. In the future, other existing SYBR®Green qPCR assays could be adapted for HRM by using a saturating dye for other spe-cies, to improve the discrimination of genetically close species. Eventually, the use of HRM in routine analysis performed in the framework of monitoring activities will contribute to the insight in the causal link between indoor fungal contamination and public health.
Additional files
Additional file 1: Normalized melt curves and difference curves obtained for each Aspergillus strain used during the development of the HRM assay (XLSX 105 kb)
Additional file 2: Alignment of the 20 Aspergillus strains used for the HRM development (XLSX 3516 kb)
Additional file 3: Spike test results (XLSX 12 kb)
Additional file 4: Alignment of the 9 Versicolores species and the Aversi_ITS primers (XLSX 3495 kb)
Additional file 5: Melting temperature obtained for the species from the Versicolores group (XLSX 11 kb)
Abbreviations
EPA:Environmental Protection Agency; gDNA: genomic DNA; HRM: high
resolution melting; ITS: internal transcribed spacer; LOD: limit of detection; NTC: No Template Control; PCR: polymerase chain reaction; qPCR: real-time
PCR; RFU: relative fluorescence units; Tm: melting temperature
Acknowledgements
We thank Dr. Camille Chasseur and his team from the Environment and Health service at the Scientific Institute of Public Health (WIV-ISP) for their excellent work on classical analysis. We gratefully acknowledge Maud Delvoye for her HRM expertise.
Funding
This work was supported by RP/PJ WIV-ISP (mycoMOLAIR), project number W4044.0105.1.
Availability of data and materials
All data generated or analyzed during this study are included in this published article.
Authors’ contributions
XL, NR and SDK designed the experiments. XL has performed the
experiments. AP and FB contributed materials and analysis tools. XL, SDK, NR and AP interpreted the data. XL and SDK drafted the manuscript. All the authors read and approved the final manuscript.
Competing interests
The authors declare that they have no competing interests. Consent for publication
Not applicable.
Ethics approval and consent to participate Not applicable
Publisher’s Note
Springer Nature remains neutral with regard to jurisdictional claims in published maps and institutional affiliations.
Author details
1Platform Biotechnology and Molecular Biology, Scientific Institute of Public
Health (WIV-ISP), J. Wytsmanstraat 14, 1050 Brussels, Belgium.2Mycology and
Aerobiology, Scientific Institute of Public Health (WIV-ISP), J. Wytsmanstraat
14, 1050 Brussels, Belgium.3Cellular and Molecular Immunology, Groupe
Interdisciplinaire de Génoprotéomique Appliquée (GIGA), Université de Liège
(ULg), Avenue de l’Hôpital, 1 (B34), 4000 Sart-Tilman, Belgium.
Received: 1 November 2016 Accepted: 30 March 2017
References
1. World Health Organization. WHO guidelines for indoor air quality: dampness
and mould. Copenhagen: World Health Organization for Europe; 2009.
2. Beguin H, Nolard N. Mould biodiversity in homes. I. Air and surface analysis
of 130 dwellings. Aerobiologia. 1994;10:157–66.
3. Nolard N, Chasseur C, Marlier M, Lognay G. Validation des méthodes
microbiologiques et chimiques de contrôle des lieux de travail. 2004. http:// www.belspo.be/belspo/organisation/publ/pub_ostc/PS/rPS19_fr.pdf. Accessed 20 Mar 2016.
4. Pitkaranta M, Meklin T, Hyvarinen A, Nevalainen A, Paulin L, Auvinen P, et al.
Molecular profiling of fungal communities in moisture damaged buildings before and after remediation-a comparison of culture-dependent and culture-independent methods. BMC Microbiol. 2011;11:235.
5. HUD. Controlling and preventing household mould and moisture problems,
lessons learned and strategies for disseminating best practices. Report to Congress. April 1, 2005. US HUD. 2006. Healthy Homes Issues: Residential Assessment.
6. Vesper S. Traditional mould analysis compared to a DNA-based method of
mould analysis. Crit Rev Microbiol. 2011;37(1):15–24.
7. Martin K, Rygiewicz P. Fungal-specific PCR primers developed for analysis of
the ITS region of environmental DNA extracts. BMC Microbiol. 2005;5:28.
8. Zhou G, Whong W-Z, Ong T, Chen B. Development of a fungus-specific PCR
assay for detection low-level fungi in an indoor environment. Mol Cell
Probes. 2000;14:339–48.
9. Bellanger AP, Reboux G, Roussel S, Grenouillet F, Didier-Scherer E, Dalphin JC,
et al. Indoor fungal contamination of moisture-damaged and allergic patient
housing analysed using real-time PCR. Lett Appl Microbiol. 2009;49(2):260–6.
10. de Ana SG, Torres-Rodriguez JM, Ramirez EA, Garcia SM, Belmonte-Soler J.
Seasonal distribution of Alternaria, Aspergillus, Cladosporium and Penicillium species isolated in homes of fungal allergic patients. J Investig Allergol Clin
Immunol. 2006;16(6):357–63.
11. Haugland RA, Varma M, Wymer LJ, Vesper SJ. Quantitative PCR analysis of
selected Aspergillus, Penicillium and Paecilomyces species. Syst Appl
Microbiol. 2004;27(2):198–210.
12. Morrison J, Yang C, Lin K-T, Haugland R, Neely A, Vesper S. Monitoring
Aspergillus species by quantitative PCR during construction of a multi-storey
hospital building. J Hosp Infect. 2004;57:85–7.
13. Libert X, Bladt S, Chasseur C, Bureau F, Roosens NH, De Keersmaecker SCJ.
Development and performance assessment of a qualitative SYBR®green real-time PCR assay for the detection of Aspergillus versicolor in indoor air.
Appl Microbiol Biotechnol. 2015;99(17):7267–82.
14. Andersen B, Frisvad J, Rasmussen IS, Larsen L. Association between fungal
species and water-damaged building materials. Appl Environ Microbiol.
2011;77(12):4180–8.
15. Packeu A, Chasseur C, Bladt S, Detandt M. The role of indoor pollution in
the development and maintenance of chronic airway inflammation in
16. United States Environmental Protection Agency. EPA Technology for Mold Identification and Enumeration. 2012. http://www.epa.gov. Accessed 2 June 2014.
17. Jurjevic Z, Peterson SW, Horn BW. Aspergillus section Versicolores: nine new species
and multilocus DNA sequence based phylogeny. IMA Fungus. 2012;3(1):59–79.
18. Jurjevic Z, Peterson SW, Solfrizzo M, Peraica M. Sterigmatocystin production
by nine newly described Aspergillus species in section Versicolores grown on
two different media. Mycotoxin Res. 2013;29(3):141–5.
19. Rank C, Nielsen KF, Larsen TO, Varga J, Samson RA, Frisvad JC. Distribution
of sterigmatocystin in filamentous fungi. Fungal Biol. 2011;115:405–20.
20. Reed GH, Kent JO, Wittwer CT. High-resolution DNA melting analysis for simple
and efficient molecular diagnostics. Pharmacogenomics J. 2007;8(6):597–608.
21. Nemcova E, Cernochova M, Ruzicka F, Malisova B, Freiberger T, Nemec P.
Rapid identification of medically important Candida isolates using high resolution melting analysis. PLoS One. 2015;10(2):e0116940.
22. Lengerova M, Racil Z, Hrncirova K, Kocmanova I, Volfova P, Ricna D, et al.
Rapid detection and identification of Mucormycetes in bronchoalveolar lavage samples from immunocompromised patients with pulmonary
infiltrates by use of high-resolution melt analysis. JCM. 2014;52(8):2824–8.
23. Somogyvari F, Horvath A, Serly J, Majoros H, Vagvolgyi C, Peto Z. Detection
of invasive fungal pathogens by real-time PCR and high-resolution melting
analysis. In vivo. 2012;26:979–84.
24. Alonso M, Escribano P, Guinea J, Recio S, Simon A, Peláez T, et al. Rapid
detection and identification of Aspergillus from lower respiratory tract specimens by use of combined probe-high-resolution melting analysis. JCM.
2012;50(10):3238–43.
25. Biorad. Precision melt analysis™ : Instruction manuel.2012 http://www.
bio-rad.com/webroot/web/pdf/lsr/literature/Bulletin_10014811.pdf. Accessed Mar 2016.
26. van den Berg M, Albang R, Albermann K, Badger J, Daran J-M, Driessen A,
et al. Genome sequencing and analysis of the filamentous fungus
Penicillium chrysogenum. Nat Biotechnol. 2008;26:1161–8.
27. Hyvarinen A, Vahteristo M, Melkin T, Jantunen M, Nevalainen A, Mougel C.
Temporal and spatial variation of fungal concentrations in indoor air.
Aerosol Sci Technol. 2001;35:688–95.
28. Benndorf D, Müller A, Bock K, Manuwald O, Herbarth O, von Bergen M.
Indentification of spore allergens from the indoor mould Aspergillus
versicolor. Allergy. 2008;63:454–60.
29. Reboux G, Bellanger AP, Roussel S, Grenouillet F, Sornin S, Piarroux R, et al. Indoor
mold concentration in eastern France. Indoor Air. 2009 Dec;19(6):446–53.
30. Jones R, Recer GM, Hwang SA, Lin S. Association between indoor mold and
asthma among children in buffalo. New York Indoor Air. 2011 Apr;21(2):156–64.
31. Meheust D, Le CP, Reboux G, Millon L, Gangneux JP. Indoor fungal
contamination: health risks and measurement methods in hospitals, homes
and workplaces. Crit Rev Microbiol. 2014;40(3):248–60.
32. Vesper SJ, Wymer L, Kennedy S, Grimsley LF. Decreased pulmonary function
measured in children exposed to high environmental relative moldiness
index homes. Open Respir Med J. 2013;7:83–6.
• We accept pre-submission inquiries
• Our selector tool helps you to find the most relevant journal • We provide round the clock customer support
• Convenient online submission • Thorough peer review
• Inclusion in PubMed and all major indexing services • Maximum visibility for your research
Submit your manuscript at www.biomedcentral.com/submit