HAL Id: hal-00295925
https://hal.archives-ouvertes.fr/hal-00295925
Submitted on 23 May 2006
HAL is a multi-disciplinary open access
archive for the deposit and dissemination of
sci-entific research documents, whether they are
pub-lished or not. The documents may come from
teaching and research institutions in France or
abroad, or from public or private research centers.
L’archive ouverte pluridisciplinaire HAL, est
destinée au dépôt et à la diffusion de documents
scientifiques de niveau recherche, publiés ou non,
émanant des établissements d’enseignement et de
recherche français ou étrangers, des laboratoires
publics ou privés.
aromatic hydrocarbons in Mexico City
L. C. Marr, K. Dzepina, J. L. Jimenez, F. Reisen, H. L. Bethel, J. Arey, J. S.
Gaffney, N. A. Marley, L. T. Molina, M. J. Molina
To cite this version:
L. C. Marr, K. Dzepina, J. L. Jimenez, F. Reisen, H. L. Bethel, et al.. Sources and transformations of
particle-bound polycyclic aromatic hydrocarbons in Mexico City. Atmospheric Chemistry and Physics,
European Geosciences Union, 2006, 6 (6), pp.1733-1745. �hal-00295925�
© Author(s) 2006. This work is licensed under a Creative Commons License.
Chemistry
and Physics
Sources and transformations of particle-bound polycyclic aromatic
hydrocarbons in Mexico City
L. C. Marr1,2, K. Dzepina3, J. L. Jimenez3, F. Reisen4, H. L. Bethel4, J. Arey4, J. S. Gaffney5, N. A. Marley5, L. T. Molina2, and M. J. Molina2,*
1Dept. of Civil and Environmental Engineering, Virginia Polytechnic Inst. and State Univ., Blacksburg, Virginia, USA 2Dept. of Earth, Atmospheric, and Planetary Sciences, Massachusetts Inst. of Technology, Cambridge, Massachusetts, USA 3Dept. of Chemistry and Biochemistry, and Cooperative Inst. for Research in Environmental Sciences (CIRES), Univ. of
Colorado, Boulder, Colorado, USA
4Air Pollution Research Center and Department of Environmental Sciences, Univ. of California, Riverside, USA 5Argonne National Laboratory, Illinois, USA
*now at: Dept. of Chemistry and Biochemistry, Univ. of California, San Diego, USA
Received: 18 October 2005 – Published in Atmos. Chem. Phys. Discuss.: 13 December 2005 Revised: 9 March 2006 – Accepted: 21 March 2006 – Published: 23 May 2006
Abstract. Understanding sources, concentrations, and trans-formations of polycyclic aromatic hydrocarbons (PAHs) in the atmosphere is important because of their potent muta-genicity and carcinomuta-genicity. The measurement of particle-bound PAHs by three different methods during the Mex-ico City Metropolitan Area field campaign in April 2003 presents a unique opportunity for characterization of these compounds and intercomparison of the methods. The three methods are (1) collection and analysis of bulk samples for time-integrated gas- and particle-phase speciation by gas chromatography/mass spectrometry; (2) aerosol photoion-ization for fast detection of PAHs on particles’ surfaces; and (3) aerosol mass spectrometry for fast analysis of size and chemical composition. This research represents the first time aerosol mass spectrometry has been used to measure ambi-ent PAH concambi-entrations and the first time that fast, real-time methods have been used to quantify PAHs alongside tradi-tional filter-based measurements in an extended field cam-paign. Speciated PAH measurements suggest that motor ve-hicles and garbage and wood burning are important sources in Mexico City. The diurnal concentration patterns captured by aerosol photoionization and aerosol mass spectrometry are generally consistent. Ambient concentrations of particle-phase PAHs typically peak at ∼110 ng m−3during the morn-ing rush hour and rapidly decay due to changes in source activity patterns and dilution as the boundary layer rises, al-though surface-bound PAH concentrations decay faster. The more rapid decrease in surface versus bulk PAH
concentra-Correspondence to: L. C. Marr
(lmarr@vt.edu)
tions during the late morning suggests that freshly emitted combustion-related particles are quickly coated by secondary aerosol material in Mexico City’s atmosphere and may also be transformed by heterogeneous reactions.
1 Introduction
Polycyclic aromatic hydrocarbons (PAHs) are a class of semi-volatile compounds formed as a byproduct of incom-plete combustion and emitted by sources such as motor ve-hicles, coal-fired power plants, wood fires, and cigarettes. Many PAHs are potent mutagens and carcinogens, and they account for the majority of mutagenic potency attributable to specific compounds in ambient particulate matter (Han-nigan et al., 1998). The PAH benzo[a]pyrene has been di-rectly linked to lung cancer through its selective formation of adducts along a tumor suppressor gene (Denissenko et al., 1996).
Transformations of PAHs on particles have the potential to affect the particles’ toxicity through the formation of species that are more toxic, e.g. nitro-PAH (Sasaki et al., 1997), or less toxic. Heterogeneous reactions of particulate PAHs (Bertram et al., 2001; Esteve et al., 2003, 2004, 2006) may serve as surrogates for heterogeneous chemistry of many types of organics; such reactions could change the particles’ hydrophilicity and thus their potential to act as cloud con-densation nuclei (Jones et al., 2004). A second mechanism of transformation is coating of freshly emitted particles by condensation of secondary aerosol components formed by gas-phase reactions. Through this type of transformation,
PAHs that are initially present on the surface of particles may become less accessible for heterogeneous reactions and less bioavailable. PAHs are associated with black carbon, and coating of such particles has significant implications for ra-diative forcing and climate change (Chandra et al., 2004; Co-nant et al., 2003; Jacobson, 2001).
In the spring of 2003, a multinational team of over 100 atmospheric scientists from 30 Mexican, US, and European institutions conducted an intensive five-week field campaign in the Mexico City Metropolitan Area (MCMA) (de Foy et al., 2005). The overall goals of the effort were to contribute to the understanding of the air quality problem in Mexico City and to serve as a model for the study of other megac-ities in the developing world. Recent studies of PAHs in Mexico City have reported concentrations there to be among the highest measured anywhere in the world. Median to-tal particle-bound PAH concentrations along Mexico City’s roadways range from 50 to 910 ng m−3, equivalent to smok-ing 0.4 cigarettes per hour or a lung cancer risk level of 2×10⁻⁵for 10 h per week of exposure over 40 years (Marr et al., 2004; Velasco et al., 2004). The extremely high ambient concentrations in Mexico City provide a stronger signal for the analysis of diurnal patterns and comparison against con-centrations of related pollutants. Comparison of PAH versus elemental carbon and active surface area concentrations in Mexico City suggests that surface PAH concentrations may diminish rapidly with particle aging (Marr et al., 2004). Be-cause of the serious health effects of PAHs, it is important to understand their sources and losses under ambient condi-tions.
The measurement of particle-bound PAHs by three differ-ent methods – filters, aerosol photoionization, and aerosol mass spectrometry – during the five-week MCMA field cam-paign allows a more comprehensive characterization of these compounds in ambient air than has been possible in the past. Combined with measurements of numerous other species, including gas-phase PAHs, the data present a unique op-portunity to characterize ambient concentrations, sources, and atmospheric processing of PAHs. This research repre-sents the first time aerosol mass spectrometry has been used to measure ambient PAH concentrations and the first time that two fast, real-time methods have been used to quantify PAHs alongside traditional filter-based measurements in an extended field campaign. The objectives of this research are to (1) compare and contrast the three measurement methods, (2) describe the ambient concentrations and sources of PAHs in Mexico City, and (3) explain the differences in diurnal pat-terns observed in PAH versus other species concentrations.
2 Experimental
The measurements took place on the rooftop (12 m above ground level) of a three-story building at the Universidad Aut´onoma Metropolitana in Iztapalapa (UAM-I),
approxi-mately 10 km southeast of downtown Mexico City, whose elevation is 2240 m. The building houses the National Cen-ter for Environmental Research and Education, and the site is known by its Spanish acronym, CENICA. The site is lo-cated in a mixed-used medium-income neighborhood with light traffic. The nearest major roads are at least 1 km away.
The five-week field campaign took place toward the end of the dry season during April 2003. It included Holy Week, which ended with Easter Sunday on 20 April. During the holiday week, many businesses closed and residents left on vacation. The average temperature during the field cam-paign was 21◦C, with an average daily low of 15◦C and high of 29◦C. Winds were often northerly in the morning and southerly in the evening, with an average speed of 2 m s−1.
Rain occurred, usually briefly and in the afternoon and early evening, on 7, 8, 10, 12, 20, 22, 25, and 28 April.
Particle-bound PAHs were measured by three methods: (1) filter collection and analysis by gas chromatography/mass spectrometry (GC/MS), (2) aerosol photoionization, and (3) aerosol mass spectrometry. The “total” particulate PAH con-centrations, defined in Table 1, measured by each method are referred to as FPAH, SPAH, and APAH, respectively. The method intercomparison focuses on a three-day period, 27– 30 April. The filter sampler and photoionization aerosol sen-sor were located on opposite sides of an experimental plat-form, approximately 3 m apart and 4 m above the rooftop. The aerosol mass spectrometer was housed in a temperature-controlled storage building at the opposite end of the rooftop, approximately 50 m from the experimental platform. Due to physical limitations of the site, a shared sampling line was not feasible, so long tubing with its potential for diffusional losses of particles was not a factor in this intercomparison. Although the three methods were located at different points on the rooftop, they were believed to be sampling from the same air mass, as verified by the simultaneous detection of short-term spikes in ambient concentrations by the two real-time instruments located at opposite ends of the building. 2.1 Time-integrated sampling and speciated analysis For the speciation of PAHs by GC/MS, time-averaged bulk samples were collected on 27–30 April. A high-volume (Hi-vol) air sampler equipped with a Teflon-impregnated glass fiber filter (20 cm×25 cm) and two polyurethane foam plugs (PUFs) in series beneath the filter and without a size-selective inlet was used to collect semi-volatile and particle-associated PAHs at a flow rate of ∼0.6 m3min−1. Gas-phase naphtha-lene and alkyl-naphthanaphtha-lenes were simultaneously collected on replicate Tenax-TA solid adsorbent cartridges at a flow rate of 200 cm3 min−1. Samples were collected over four
sampling intervals per 24-h period: 07:00–11:00, 11:00– 16:00, 16:00–21:00, and an overnight sample from 21:00– 07:00.
The filter and PUF samples were spiked with deuter-ated internal standards, Soxhlet extracted overnight in
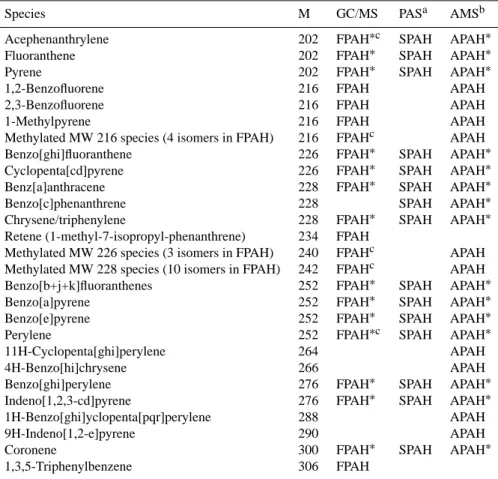
Table 1. Particulate PAHs quantified by each method.
Species M GC/MS PASa AMSb
Acephenanthrylene 202 FPAH∗c SPAH APAH∗
Fluoranthene 202 FPAH∗ SPAH APAH∗
Pyrene 202 FPAH∗ SPAH APAH∗
1,2-Benzofluorene 216 FPAH APAH
2,3-Benzofluorene 216 FPAH APAH
1-Methylpyrene 216 FPAH APAH
Methylated MW 216 species (4 isomers in FPAH) 216 FPAHc APAH
Benzo[ghi]fluoranthene 226 FPAH∗ SPAH APAH∗
Cyclopenta[cd]pyrene 226 FPAH∗ SPAH APAH∗
Benz[a]anthracene 228 FPAH∗ SPAH APAH∗
Benzo[c]phenanthrene 228 SPAH APAH∗
Chrysene/triphenylene 228 FPAH∗ SPAH APAH∗
Retene (1-methyl-7-isopropyl-phenanthrene) 234 FPAH
Methylated MW 226 species (3 isomers in FPAH) 240 FPAHc APAH Methylated MW 228 species (10 isomers in FPAH) 242 FPAHc APAH Benzo[b+j+k]fluoranthenes 252 FPAH∗ SPAH APAH∗
Benzo[a]pyrene 252 FPAH∗ SPAH APAH∗
Benzo[e]pyrene 252 FPAH∗ SPAH APAH∗
Perylene 252 FPAH∗c SPAH APAH∗
11H-Cyclopenta[ghi]perylene 264 APAH
4H-Benzo[hi]chrysene 266 APAH
Benzo[ghi]perylene 276 FPAH∗ SPAH APAH∗
Indeno[1,2,3-cd]pyrene 276 FPAH∗ SPAH APAH∗
1H-Benzo[ghi]yclopenta[pqr]perylene 288 APAH
9H-Indeno[1,2-e]pyrene 290 APAH
Coronene 300 FPAH∗ SPAH APAH∗
1,3,5-Triphenylbenzene 306 FPAH
∗These species are included in the modified FPAH∗and APAH∗totals which are intended for comparison to SPAH.
aThe PAS response, denoted SPAH here, has been calibrated against the sum of these PAHs. The signal is influenced by ionization potential
and molecular size (Niessner, 1986).
bThe AMS response includes [M], [M-H
n] (where n=1-4), and [M+1] ions but does not differentiate between isomers. Thus, the PAHs shown as contributing to APAH are only examples of those at a certain M that should be detectable by this method.
cIdentifications are based upon retention indices for these species. In all other cases, individual standards were available to determine
retention times and mass spectra.
dichloromethane, fractionated by high performance liquid chromatography (HPLC) on a semipreparative Silica col-umn, and the PAH-containing fractions were analyzed by GC/MS. The PUFs were spiked with phenanthrene-d10,
fluoranthene-d10and pyrene-d10prior to extraction and were
analyzed by positive ion/chemical ionization GC/MS with selected ion monitoring (SIM) using a DB-17 column in an Agilent 5973 mass selective detector (MSD). Filters were spiked with pyrene-d10, benzo[b]fluoranthene-d12 and
benzo[a]pyrene-d12 prior to extraction and were analyzed
by electron impact (EI) GC/MS-SIM using a DB-5MS col-umn in a Hewlett Packard 5971A MSD. The Tenax samples were spiked with naphthalene-d8and
1-methylnaphthalene-d10prior to thermal desorption and EI GC/MS-SIM analysis
as described previously (Reisen and Arey, 2005). Table 1 lists the particle-phase species identified on filters (FPAH).
2.2 Aerosol photoionization
The main advantages of aerosol photoionization are its sen-sitivity and ability to perform continuous, real-time measure-ments with a response time of less than 10 s. In this method, the aerosol sample is exposed to ultraviolet light from an ex-cimer lamp at 207 nm, which causes PAHs on the surface of particles to photoemit electrons. An electric field removes the ejected electrons, and the positively charged particles are trapped on a filter, generating a current that is measured by an electrometer.
The photoelectric aerosol sensor (PAS 2000 CE, EcoChem Analytics, Texas, and Matter Engineering AG, Switzerland) reports results as total particle-bound PAHs. Because our experience suggests that the instrument is most sensitive to PAHs on the surfaces of particles and less sensitive to those buried under other aerosol compounds, we henceforth use
Fig. 1. Concentrations (gas + particle phases) of benzo[ghi]perylene (BghiP), indeno[1,2,3-cd]pyrene (IndPy), coronene (Cor), pyrene (Py), methylphenanthrenes (Mphen), retene (1-methyl-7-isopropylphenanthrene), and 1,3,5-triphenylbenzene (TPBz) on 29 April 2003. Also shown is the ratio of methylphenan-threnes to phenanthrene (Mphen/Phen), an indicator of the relative contribution of diesel versus gasoline vehicle exhaust. BghiP, IndPy and Cor are markers of gasoline vehicle exhaust, retene of soft wood combustion and TPBz of garbage burning.
“SPAH” to refer to particle-bound surface PAHs detected by the photoionization sensor. “PAH” will continue to re-fer to the class of compounds more generally. The instru-ment is factory-calibrated for SPAH concentrations up to 1000 ng m−3, and it is expected to give a linear response up
to 5000 ng m−3. The response is calibrated against
filter-based analyses of PAHs, including species with molecular masses 202, 226, 228, 252, 276, and 300 (Hart et al., 1993; McDow et al., 1990). Because the energy associated with the PAS lamp (6.0 eV) is less than the ionization energy of solid-phase naphthalene (6.4 eV) (Seki, 1989), the instru-ment does not detect naphthalene. Previous studies have shown a strong correlation between photoelectric charging and independently measured PAH concentrations for a vari-ety of aerosols: oil burner exhaust, cigarette smoke, parking garage air, and ambient urban air in different cities (Sieg-mann and Sieg(Sieg-mann, 2000). The sensor’s response has also been reported to be linearly correlated (r2=0.82) with bacte-rial genotoxicity (Wasserkort et al., 1996).
During this study, we cross-calibrated four photoioniza-tion sensors against the ensemble mean while sampling can-dle soot and ambient air at concentrations of 20–3000 ng m−3
for 5–30 min on four separate occasions. All instruments re-ported a concentration of zero with a zero-air filter applied. Correction factors for the individual instruments ranged from 0.82 to 1.34. From our experience with the PAS in this and a previous field campaign (Marr et al., 2004), we estimate its uncertainty to be 20%. The manufacturer reports a limit of detection of 10 ng m−3for the analyzer.
2.3 Aerosol mass spectrometer
The Aerodyne Aerosol Mass Spectrometer (AMS) allows real-time, size and composition analysis of non-refractory submicron particles (Jayne et al., 2000; Jimenez et al., 2003). A summary of the main results from the AMS measurements
during this field campaign is given by Salcedo et al. (2006). A separate paper (Dzepina et al., 20061) describes in detail the algorithm for extracting particle-phase PAH concentra-tions from AMS spectra and its validation. Here, we report the total AMS PAH concentration (APAH), which represents the sum of the concentrations of PAHs between molecular weights of 202 and 300. While the AMS can identify PAHs by their molecular masses, it does not differentiate between isomers.
We also report a modified total APAH (APAH*) to facil-itate comparison against SPAH. The modified total includes only PAHs with molecular masses of 202, 226, 228, 252, 276, and 300, as shown in Table 1. It excludes signals at molecular masses of 216, 240, 242, 264, 266, 288, and 290 that correspond to alky-PAHs and/or PAHs with partially saturated rings (such as, 11H–cyclopenta[ghi]perylene), be-cause the photoionization instrument’s calibration does not account for such species. This modification also excludes benzofluorenes, but their contribution is at most 3% of the FPAH total.
The limit of detection, estimated as three times the stan-dard deviation of the reported concentrations when the AMS was sampling ambient air through a filter, is 36 ng m−3for to-tal APAH and 24 ng m−3for the modified total APAH* over
a 4-min measurement period. Detection limits scale with the inverse of the square root of the averaging time, so over 15-min periods, these limits will be 19 and 12 ng m−3for APAH and APAH*, respectively. Uncertainties in the method due to systematic and random errors, described in greater detail in Dzepina et al. (2006), are +45% and −35% of the reported concentration.
2.4 Additional measurements
Black carbon and PAHs form during the same combustion processes. Their concentrations are correlated in ambient air, and are impacted by a variety of combustion sources, in-cluding traffic, cooking, and wood smoke (Marr et al., 2004; Schauer et al., 2003; Wallace, 2000; Watson and Chow, 2002; Zielinska et al., 2004a). A meteorological station lo-cated on the experimental platform recorded temperature, hu-midity, pressure, and wind velocity every minute. The site was part of a routine air quality monitoring network that measured concentrations of criteria pollutants, including sul-fur dioxide, carbon monoxide, ozone, nitrogen dioxide, and particulate matter. Black carbon was measured at 4-min fre-quency by optical attenuation using an aethalometer (Magee Scientific AE-31, Berkeley, California).
1Dzepina, K., Salcedo, D., Marr, L. C., Arey, J., Worsnop, D.
R., and Jimenez, J. L.: Detection of particle-phase polycyclic aro-matic hydrocarbons (PAHs) in Mexico City using an Aerosol Mass Spectrometer, Int. J. Mass Spectrometry, submitted, 2006.
250 200 150 100 50 0 Particulate PAH (ng m -3) 00:00 27/4 12:00 00:00 28/4 12:00 00:00 29/4 12:00 00:00 30/4 12:00 Local time
FPAH FPAH* (modified total for comparison with SPAH) SPAH
APAH APAH* (modified total for comparison with SPAH)
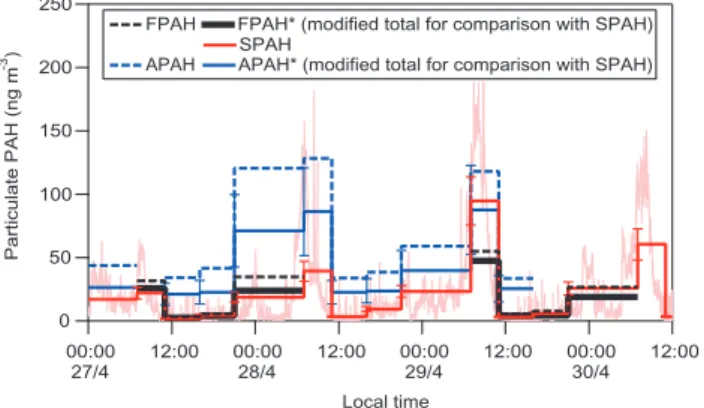
Fig. 2. Particulate PAH concentrations measured using filters (FPAH), photoionization (SPAH), and the AMS (APAH). The back-ground time series shows 1-min SPAH.
3 Results
Figure 1 shows concentrations of selected PAHs (gas + par-ticle phases) determined by GC/MS on Tuesday 29 April. These PAHs are shown because of their association with specific sources. As PAHs are semi-volatile, some of the particle-phase compounds may have been emitted origi-nally as gases in hot exhaust and then may have con-densed onto existing particles as the mixture cooled. Stud-ies of vehicle emissions have shown that larger PAHs, in particular benzo[ghi]perylene, indeno[1,2,3-cd]pyrene, and coronene, are emitted in gasoline-fueled vehicle exhaust (Marr et al., 1999; Miguel et al., 1998; Zielinska et al., 2004b), while alkylated phenanthrenes are associated with diesel vehicles (Benner et al., 1989). Concentrations of benzo[ghi]perylene and methylphenanthrenes are highest in the morning, although the diurnal patterns of these two PAHs differ. Benzo[ghi]perylene concentrations are 36 times higher in the morning compared to the afternoon and evening, while methylphenanthrene concentrations are only 1–2 times higher in the morning. As seen in Fig. 1, the diur-nal patterns of indeno[1,2,3-cd]pyrene and coronene are sim-ilar to that of benzo[ghi]perylene.
A GC/MS total ion chromatogram of the PAH-containing HPLC fraction from a filter sample revealed a retene peak and also a large peak from a MW 306 species. Retene has been suggested as a marker for soft wood combustion (Ram-dahl, 1983). The MW 306 species was subsequently identi-fied to be 1,3,5-triphenylbenzene by matching its mass spec-tra and retention time on two different GC columns with those of an authentic standard. This compound has recently been suggested to be a potential marker for the burning of refuse, including plastics (Simoneit et al., 2005). In contrast to the other PAHs, which are all considered markers of ve-hicle exhaust, the 1,3,5-triphenylbenzene and retene concen-trations are highest in the nighttime rather than morning or daytime samples. 150 100 50 0 Particulate PAH (ng m -3) 12:00 AM 6:00 AM 12:00 PM 6:00 PM 12:00 AM Local time Weekday SPAH Weekend SPAH Weekday APAH* Weekend APAH*
Fig. 3. Non-holiday weekday and weekend diurnal cycles of SPAH
and APAH* at 15-min resolution. The shaded area highlights the peak rush hour period between 06:30–08:30. Error bars of one stan-dard deviation are shown at 1-h intervals for the weekday time se-ries.
Figure 2 shows total particulate PAH concentrations mea-sured by all three methods during the three days when they were operating simultaneously, 27–30 April. Not all meth-ods were operating during the entire interval. Filter measure-ments are not available for 28 April, and the AMS was not sampling continuously during this period. All PAHs identi-fied as part of the FPAH total were also seen by the AMS, except for retene and 1,3,5-triphenylbenzene.
In the figure, heavy solid and dotted lines show time-integrated averages corresponding to the filter sampling pe-riods. To illustrate the fine temporal structure of PAH con-centrations, the figure also shows 1-min SPAH in the back-ground. Total (FPAH, SPAH, APAH) and modified (FPAH* and APAH*) results represent, respectively, all PAHs de-tected by each method and a modified total, delineated in Table 1 and intended to facilitate comparison against SPAH. The 1-min SPAH time series shows a strong diurnal pat-tern in ambient PAH concentrations, with concentrations generally starting to rise at ∼05:00, peaking at ∼08:00, and then dropping throughout the late morning. Peak concentra-tions often exceed 100 ng m−3, and concentrations usually
remain below 50 ng m−3 throughout the remainder of the
day. However, on the first day shown in the figure, a Sun-day, peak concentrations are about 50% lower compared to the other days.
To facilitate interpretation of future studies using the PAS or AMS for measurement of PAHs, we compare total PAH concentrations determined by all three methods in Table 2. The totals shown for FPAH and APAH include all particle-phase PAHs detected by the filter and AMS methods, respec-tively. The table also shows ratios of SPAH and APAH to the more traditional FPAH. The ratio SPAH/FPAH falls in the range 0.5–1.0, except for one period on a weekday morning when the ratio is 1.7. The ratio APAH/FPAH ranges between 2.1–10, with the poorest agreement when PAH concentra-tions are low.
Table 2. Total particle-phase PAH concentrations (ng m−3) measured by filters (FPAH), aerosol photoionization (SPAH), and aerosol mass spectrometry (APAH).
Time FPAHa SPAHa APAHb SPAH/FPAH APAH/FPAH 27 April (Sun) 07:00-11:00 32±6 22±4 N/A 0.69±0.20 N/A 11:00-16:00 3±1 2±0c 34±14 0.6±0.2 10±5 16:00-21:00 6±1 5±1c 42±17 0.9±0.2 7±3 21:00-7:00 35±7 19±4 121±48 0.55±0.15 3.5±1.6 29 April (Tue) 07:00-11:00 55±11 95±19 118±47 1.7±0.5 2.1±1.0 11:00-16:00 6±1 3±1c 33±13 0.5±0.2 6±3 16:00-21:00 8±2 6±1c N/A 0.8±0.2 N/A 21:00-7:00 27±5 26±5 N/A 1.0±0.3 N/A
aOverall uncertainty is estimated to be 20%. bOverall uncertainty is estimated to be 40%. cBelow detection limit.
250 200 150 100 50 0 SPAH (ng m -3 ) 10 8 6 4 2 0 CO (ppm) SPAH = 18.7±0.2 * CO 2 R = 0.70
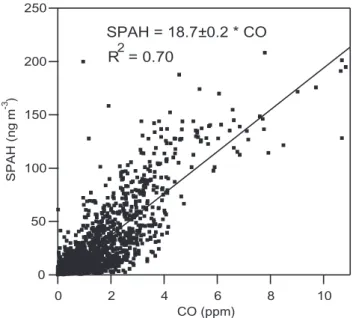
Fig. 4. SPAH versus CO concentrations, 15-min averages. The
uncertainty in the measurements is estimated to be 20% for SPAH and 0.1 ppm for CO.
Figure 3 shows the diurnal profiles (15-min averages) of SPAH and APAH* averaged over weekdays (20 days) and weekends (8 days) separately, excluding Thursday 17 April through Easter Sunday 20 April, when traffic and ambient pollutant concentrations were significantly lower than usual. Error bars in the figure show one standard deviation at 1-h intervals for t1-he weekday time series. We 1-have isolated weekdays because motor vehicle activity, thought to be a major source of PAHs, is expected to differ significantly be-tween weekdays and weekends (Marr et al., 2002). The
tem-poral patterns of SPAH and APAH* are similar, with con-centrations beginning to increase at 05:00, peaking at 08:00, and then falling off; but their absolute values differ dur-ing most hours of the day. On weekdays, SPAH is usu-ally lower than APAH* by ∼20 ng m−3, except during the peak period (06:30–08:30), when the two signals are com-parable in magnitude. Linear, least-squares regression of the weekday diurnal profiles of APAH* against SPAH produces a slope of 0.86±0.03 (standard deviation) and intercept of 21±1 ng m−3 with r2=0.87. An additional difference be-tween the two is that APAH* does not seem to decay as fast as SPAH in the late morning.
The differences in weekday versus weekend concentra-tions are opposite for the two measurements of PAH con-centration. Weekend SPAH concentrations are ∼30% lower compared to weekday SPAH during the peak morning rush hour period, but weekend APAH* concentrations are up to two times higher compared to weekday APAH* between
midnight and 11:00. Weekend APAH* is approximately
twice as high as weekend SPAH, with a regression slope of 1.85±0.09, intercept of 21±3 ng m−3, and r2=0.81. Because weekend days are fewer, the standard deviations of the week-end time series, not shown for reasons of legibility, overlap between SPAH and APAH*.
SPAH is strongly correlated with both CO and
gas-phase naphthalene. Figure 4 shows 15-min averages
of SPAH versus CO during the entire field campaign. The slope of the regression line, forced through zero, is 18.7±0.2 ng m−3 ppm−1, with r2=0.70. Figure 5
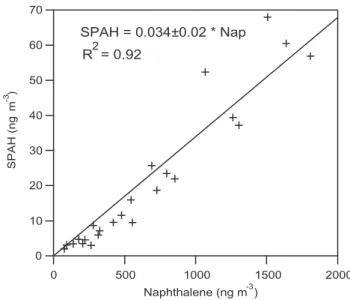
shows SPAH versus all available naphthalene measurements (n=24), which are time-integrated over 4- to 10-h periods. For the relationship between SPAH and naphthalene, the slope is 0.034±0.001 with r2=0.92.
4 Discussion
4.1 Method intercomparison
The three PAH measurement techniques have complemen-tary strengths. Collection of time-integrated samples with GC/MS analysis allows detailed, isomer-specific speciation and the ability to quantify both gas- and particle-phase concentrations. Aerosol photoionization is a sensitive and fast technique that detects total surface PAH concentra-tions. Aerosol mass spectrometry provides speciation by MW, estimated size distributions, and measures of other non-refractory submicron aerosol components at 4-min resolu-tion.
While the three methods generally report similar trends and the same order of magnitude for the concentrations, cer-tain disparities may emphasize methodological limitations, transformation of PAHs, and/or uncertainties in calibration. Figures 2 and 3 show that APAH* is generally higher than SPAH, except during the morning rush hour between 06:30– 08:30 when they are similar. The differences exceed the methodological uncertainty bounds during 7 of the 11 over-lapping periods in Fig. 2 and exceed one standard deviation in the diurnal averages between 03:00–05:00 and between 09:00–23:00 in Fig. 3. The likely cause of lower SPAH val-ues is the fact that the PAS responds only to surface-bound PAHs. The difference in mass loadings is also captured in the large intercept (∼21 ng m−3)of the correlation between APAH* and SPAH. As the particles are coated by condensa-tion of the products of the active photochemistry in Mex-ico City (Shirley et al., 2005; Volkamer et al., 2005), the photoionization sensor becomes blind to the “buried” PAHs while the AMS, which fully vaporizes the non-refractory por-tion of the particles (Slowik et al., 2004), continues to detect them. This leads to higher PAH measurements with the AMS when aged particles dominate, i.e. during most of the day ex-cept the morning rush hour.
An intriguing observation is that while SPAH concentra-tions are higher on weekdays than on weekends, APAH* concentrations are actually higher on weekends, particularly between midnight and 11:00. The difference may not be sig-nificant, as the standard deviations of these averages are large and do in fact overlap. Concentrations of carbon monox-ide (CO) and black carbon (BC), indicators of gasoline and diesel engine activity, respectively, are not higher on Friday and Saturday nights and are not significantly different on weekends versus weekdays; so vehicle traffic does not ap-pear to be the cause of higher APAH* on weekends. Instead, sources of emissions that produce particles containing coated PAHs may be important on Friday and Saturday nights (Sat-urday and Sunday early mornings).
During periods with PAH loadings below 30 ng m−3, FPAH* and SPAH agree well, as shown in Fig. 1. During periods of elevated PAH loadings (07:00–11:00 on Sunday 27 April and 21:00–07:00 on 27–28 April), FPAH* is higher
70 60 50 40 30 20 10 0 SPAH (ng m -3 ) 2000 1500 1000 500 0 Naphthalene (ng m ) -3 SPAH = 0.034±0.02 * Nap R = 0.922
Fig. 5. SPAH versus naphthalene (gas-phase) concentrations. The
uncertainty in SPAH is estimated to be 20%. Naphthalene was col-lected on Tenax in replicate with an average relative standard devi-ation of 8%.
than SPAH, except during one period dominated by fresh emissions (07:00–11:00 Tuesday 29 April). Again, SPAH may be lower because it does not include PAHs on aged par-ticles that have been coated by secondary aerosol. During the period of fresh emissions when SPAH is higher, the PAHs captured on the filters are exposed to several hours of am-bient air during the MCMA’s most photochemically active period, i.e. weekday mornings; and the PAHs may be sub-ject to reaction artifacts in the sampler. This type of degra-dation can reduce PAH concentrations by 50% for 1–2 day sampling periods with 70–80 ppb ozone levels (Schauer et al., 2003). The susceptibility to artifactual degradation dur-ing FPAH sampldur-ing varies among individual PAH species (Arey, 1998; Sanderson and Farant, 2005), and lower FPAH v. APAH values for certain PAHs have been found (Dzepina et al., 20061). The real-time SPAH and APAH measurements are much less susceptible to such artifacts. A second source of uncertainty in the FPAH measurements is volatilization of PAHs from particles captured on the filters. The amount of PAHs captured on PUFs varies between 15–70% of the total FPAH concentration.
In spite of considerable uncertainties, the three meth-ods often report similar PAH concentrations, and dispari-ties likely reflect methodological differences. While SPAH and APAH* agree at higher concentrations, SPAH is con-sistently lower than APAH* at lower loadings. In contrast, SPAH and FPAH* agree better at lower concentrations. Due to sampling uncertainties, FPAH should be considered as a lower limit due to the potential for PAH degradation and volatilization during sampling. Likewise, SPAH represents a lower limit of total particle-phase concentrations; the method
appears to be sensitive only to those PAHs that are present on particles’ surfaces. Finally, uncertainty remains in APAH quantification due to the need to subtract the non-PAH or-ganic background from the AMS signal. The reasons for the disparities are not fully known, and laboratory calibration ex-periments are needed to explore the differences further.
4.2 PAH sources
The limited number of samples and lack of precise informa-tion about Mexican source profiles in this study preclude a quantitative source apportionment. However, evidence sug-gests that motor vehicles are the major source of PAH emis-sions in Mexico City. Motor vehicles are responsible for 99% of CO emissions in the area (Secretar´ıa del Medio Ambiente, 2003), and PAH and CO concentrations are correlated, as shown in Fig. 4. The strong correlation between SPAH and gas-phase naphthalene, shown in Fig. 5, may also indicate that vehicles are a key source of particulate PAHs, if Mexico City follows the pattern of Southern California, where vehi-cles are responsible for 53% of naphthalene emissions (Lu et al., 2004).
These results provide insight into the diurnal patterns of gasoline- versus diesel-powered vehicles in the MCMA. Benzo[ghi]perylene can be used as a marker of gasoline-powered vehicle activity, as it has the highest particle-phase emission factor of the 16 priority PAHs in light-duty ve-hicle exhaust but is not detected in heavy-duty diesel ex-haust (Marr et al., 1999). During the 07:00–11:00 period, benzo[ghi]perylene accounts for 25% of the total particle-phase PAHs; and during the three remaining periods, it ac-counts for only 7–8% of the total. This result suggests that gasoline-powered vehicles are an especially significant source of PAHs during the morning rush hour.
On the other hand, methylphenanthrene can be used as an indicator of diesel exhaust (Westerholm et al., 1991). The relative contribution from diesel exhaust appears to increase during 11:00–16:00 relative to the earlier period, as reflected in methylphenanthrene levels that are of similar magnitude (Fig. 1) or increasing (27 April, data not shown), while con-centrations of other PAHs except retene decrease signifi-cantly, presumably in response to a rising mixing height and reduced source activity.
The ratio of methylphenanthrenes to phenanthrene (Mphen/Phen) has been utilized in source apportionment studies to estimate the relative contributions of gasoline ver-sus diesel emissions (Lim et al., 1999; Nielsen, 1996). For diesel vehicles, Mphen/Phen ratios of 1.5 for gas-phase emis-sions (Westerholm et al., 1991) and 1.4–8 for particle-phase emissions (Lim et al., 1999; Takada et al., 1990; Wester-holm et al., 1991; Zielinska et al., 2004b) have been reported, while for gasoline vehicles, ratios of 0.2–0.7 (Takada et al., 1990; Westerholm et al., 1988) and most recently a ratio of approximately 1.0 for five in-use “normal particulate matter emitters” (Zielinska et al., 2004b), have been reported. While
there are significant variations in reported ratios, and operat-ing parameters such as the engine load are known to affect the ratio (Jensen and Hites, 1983), in general ratios >1 have been reported from diesel emission sources.
The major source of methyl-PAHs in emissions is likely to be unburned fuel (Tancell et al., 1995; Williams et al., 1986), and methylphenanthrene and dimethylnaphthalene concen-trations (µg g−1) in diesel fuel are at least an order of mag-nitude higher than in gasoline (Zielinska et al., 2004b). While naphthalene is the most abundant PAH in gasoline (Marr et al., 1999; Zielinska et al., 2004b), dimethylnaph-thalene concentrations are greater than naphdimethylnaph-thalene in diesel fuels. So an increase in the diesel contribution is likely to result in increased emissions of methylphenanthrenes and dimethylnaphthalenes and an increase in the ratio of Mphen/Phen and dimethylnaphthalenes/naphthalene. Fig-ure 1 shows that Mphen/Phen is <1 during the morning rush hour period and >1 during the rest of the day. In addition the dimethylnaphthalenes/naphthalene ratio shows a corre-sponding increase after the morning rush hour (dimethyl-naphthalenes/naphthalene=0.09, 0.29, 0.09 and 0.15 corre-sponding to the morning, day, evening and night time periods in Fig. 1). These observations are consistent with the dom-inant contribution of gasoline emissions to particle-phase PAH concentrations during the morning rush hour and with the increased importance of diesel emissions during the rest of the day.
Different diurnal traffic patterns of gasoline- and diesel-powered vehicles can explain these observations. In Cali-fornia, gasoline vehicle traffic peaks during the morning and evening rush hours (Marr et al., 2002). However, diesel ve-hicle traffic starts out slowly during the traditional morn-ing rush hour and then peaks durmorn-ing the late mornmorn-ing and early afternoon. If this pattern were also true in the MCMA, then we would expect emissions from gasoline vehicles to be higher during the 07:00–11:00 period compared to the 11:00–16:00 period and the opposite effect for diesel vehi-cles. The observed PAH concentrations support this hypoth-esis. Additionally Fig. 6 shows that BC, which is associated with diesel exhaust, peaks 1–2 h later in the morning com-pared to CO, which is associated with gasoline exhaust.
The diurnal patterns of individual PAH masses, shown by Dzepina et al. (2006)1, also suggest that activity patterns for gasoline versus diesel vehicles differ, with diesel vehicle traf-fic lagging the traditional early morning rush hour. The con-centrations of lighter MW PAHs (m/z=202 and 216) peak one hour later and do not decrease as rapidly compared to con-centrations of the heavier MW PAHs. Filter-based measure-ments of PAHs in a roadway tunnel have shown that gaso-line vehicles have higher emission factors of the larger PAHs and that diesel vehicles have higher emission factors of the smaller PAHs (Marr et al., 1999). This fact, combined with diesel vehicle traffic that peaks after the morning rush hour, would produce the observed pattern.
18 16 14 12 OOA ( µ g m -3 ) 00:00 03:00 06:00 09:00 12:00 15:00 18:00 21:00 00:00 16 14 12 10 8 6 4 HOA ( µ g m -3 ) 100 80 60 40 20 SPAH (ng m -3) 4 3 2 1 CO (ppm ) 9 8 7 6 5 4 3 BC ( µ g m -3 ) 100 80 60 40 20 APAH (ng m -3) SPAH APAH* CO BC HOA OOA
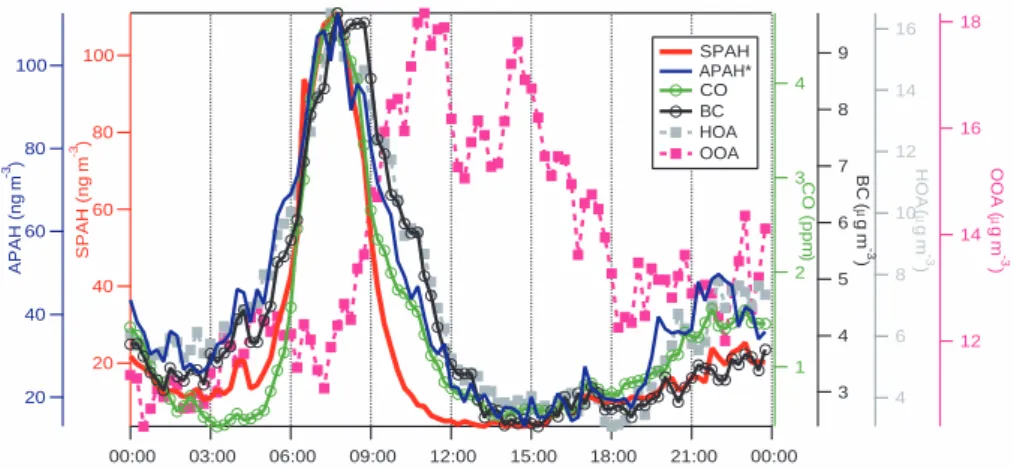
Fig. 6. Non-holiday weekday and weekend diurnal cycles of SPAH, APAH*, CO, BC, HOA, and OOA, each on its own scale.
The presence of triphenylbenzene and retene suggest that other sources also contribute to ambient PAHs in the MCMA. The high concentrations of triphenylbenzene at night are an indicator of garbage burning (Simoneit et al., 2005; Tong et al., 1984), a common nighttime activity in the MCMA. Concentrations of retene, a wood smoke marker (Ramdahl, 1983), are especially high on 27 April (not shown), when a forest fire burned for one hour on a nearby hill, Cerro de Estrella, starting at ∼18:00.
4.3 PAH transformations
Figure 6 shows diurnal cycles of SPAH, APAH∗, CO, BC, hydrocarbon-like organic aerosol (HOA), and oxidized or-ganic aerosol (OOA) averaged over 20 non-holiday week-days. HOA is an indicator of freshly emitted particles, which are likely to be primary combustion aerosols in Mexico City, while OOA is a highly oxygenated aerosol, which is likely to be secondary organic aerosols from the photooxidation of aromatics and other precursors (Zhang et al., 2005a, c). OOA may also be associated with biomass burning emissions during the latter part of the campaign. Note that the y-axes start at the background concentration of each pollutant, not at zero. While APAH∗, SPAH, CO, BC, and HOA concen-trations rise in concert starting at 06:00 each morning, SPAH falls off much more quickly and diverges from APAH∗, CO, and BC at 09:00.
There are two hypotheses that could most likely explain the faster decay of SPAH relative to other indicators of ve-hicle emissions. The timing of the decay in SPAH concen-trations, i.e. during the hours of the most active photochem-istry in Mexico City, suggests that a photochemical mecha-nism may be responsible. First, coating of PAH-containing particles by condensation of secondary inorganic or organic aerosol or of semi-volatile compounds that were emitted at high temperature, such as cooking oil, could shield the PAHs from detection by photoionization. Electron microscopy of individual particles collected during the field campaign
in-dicates that extensive processing of soot particles, including condensation of sulfate, can occur within 30 min to several hours (Johnson et al., 2005). For PAHs to be detected by pho-toionization, electrons must be ejected from the molecules and must be able to escape from the surface of the particle. Coating of PAH-containing particles could reduce the SPAH signal by making it less likely for PAHs to be photoionized or for ejected electrons to escape the particle.
Previous experiments have shown that paraffin coatings of 30–60 nm completely inhibit the photoionization signal (Niessner et al., 1990). Sufficient ammonium nitrate and secondary organic aerosol (SOA) may be produced in Mex-ico City’s atmosphere to coat primary particles and at least partially inhibit the detection of surface-bound PAHs by photoionization. The following analysis assumes that in-organic aerosol and SOA condense on preexisting parti-cles, rather than homogeneously nucleate, which is con-sistent with observations (Dunn et al., 2004). During the late morning, OOA reaches 6 µg m−3above its background value (Fig. 6). If we assume that OOA represents SOA and has a density of 1.1 g cm−3 (Bahreini et al., 2005), then the excess OOA is equivalent to a volume concentration of 6×10⁻¹²m3 m−3. Divided over a maximum aerosol sur-face area of 1×10⁻⁵cm2 cm−3 estimated from the AMS measurements, this amount of SOA can coat the particles to a thickness of 6 nm. Ammonium nitrate concentrations, which share a similar diurnal pattern to that of OOA, reach 12 µg m−3 above background in the late morning (Salcedo et al., 2006) and can contribute an additional 7 nm of thick-ness to the coating. The density of inorganic aerosol is as-sumed to be 1.7 g cm−3(Bahreini et al., 2005). The fractal
nature of primary particles (DeCarlo et al., 2004; Slowik et al., 2004; Zhang et al., 2005b) and unknown division of sur-face area between primary and secondary aerosol contribute uncertainty to this estimate. Although the total calculated coating thickness of 13 nm is only an approximation, it is of the order of magnitude needed to suppress, at least partially, the photoionization signal.
Additionally, we have performed an exploratory labora-tory experiment with the photoionization aerosol sensor and found that its response dropped by a factor of ten when soot particles were coated with oleic acid, while the AMS re-sponse did not change. The magnitude of surface coating and its relevance to ambient conditions were not characterized in this exploratory experiment.
The estimated size distributions of individual PAH masses, presented by Dzepina et al. (2006)1also support the idea that particles containing PAHs are coated, or at least grow in size, throughout the day. In the morning between 05:00 and 09:00, the modes of the size distributions of the PAHs at m/z’s 202 and 226 occur at 350 and 200 nm, respectively. In the after-noon between 14:00 and 18:00, the size distributions of these PAHs grow to larger diameters, 500–800 nm. The shift to larger diameters, which is observed for all species in the city, is likely due to coagulation and condensation of secondary aerosol on preexisting particles (Dzepina et al., 20061).
The second hypothesis is that heterogeneous reactions of PAHs on the surfaces of particles may be responsible for the faster decay of SPAH versus other related pollutants. In the gas phase, the dominant loss process of PAHs during the day-time is reaction with the OH radical (Arey, 1998; Atkinson and Arey, 1994). In the particle phase, PAHs may undergo photolysis or reaction with oxidants such as OH, ozone, ni-trogen oxides, and nitric acid; and the rate of reaction de-pends on the nature of the underlying particles and meteo-rological factors (Behymer and Hites, 1988; Calvert et al., 2002; Finlayson-Pitts and Pitts, 2000; Kamens et al., 1986, 1988, 1985). Recent laboratory experiments suggest that OH addition to pyrene and subsequent reactions can lead to its removal from particles, in the form of volatile products (Molina et al., 2004). The OH reactivities of 11 PAHs ad-sorbed on graphite particles have been found to be similar across the different species (Esteve et al., 2004), and hetero-geneous reaction with OH rather than NO2dominates losses
of particle-phase PAHs (Esteve et al., 2006). As reaction with OH is the dominant loss process of gas-phase PAHs (Atkin-son and Arey, 1994), we therefore investigate the heteroge-neous reaction rate of OH with particle-phase PAHs to deter-mine its role in the loss of PAHs in Mexico City. Heteroge-neous oxidation by ozone may also be an important sink for PAHs (Donaldson et al., 2005), so the results presented here represent a lower limit of their reactive decay.
The analysis focuses on the period 09:00–10:00, when SPAH concentrations diverge from the others (Fig. 6). The predicted heterogeneous reaction rate Rhetis
Rhet= ωγ
4 A[OH] (1)
where ω is the mean thermal velocity of OH (cm s−1), γ is the heterogeneous reaction probability, A is the surface area concentration of PAHs (cm2cm−3), and [OH] is the OH concentration (molec cm−3)(Bertram et al., 2001; Rav-ishankara, 1997). At 298 K, the mean thermal velocity of
OH is 66 100 cm s−1. We assume a reaction probability of
0.5, which is consistent with experimental data for PAHs (Bertram et al., 2001).
At 09:00, the typical weekday SPAH concentration is 50 ng m−3. Based on PAH speciation profiles during the morning hours, the average molecular mass of the mix-ture is 258 g mol−1, so the corresponding surface PAH den-sity is 1.2×10¹⁴molec m−3. Assuming a molecular cross section of 1 nm2corresponding to benzo[a]pyrene (Karcher and Fordham, 1987), whose molecular mass is close to the average, we obtain a surface area PAH concentration of 1.2×10⁻⁶cm2 cm−3. For comparison, this value is
∼10% of the total surface area estimated from the AMS of ∼10−5cm2 cm−3 during 09:00–10:00. Given a typical
OH concentration in Mexico City at 09:00 of 1.4×10⁶molec cm−3(Shirley et al., 2005; Volkamer et al., 2005), the
result-ing Rhetpredicted by Eq. (1) is 14 000 molec cm3s−1.
The ratio of the typical PAH concentration at 09:00 to Rhet
gives a characteristic lifetime of 2.3 h for heterogeneous re-action of OH with particulate PAHs. Given the uncertainty in reaction probability and other inputs to Eq. (1), we cannot rule out heterogeneous reactions as a mechanism for PAH loss. PAH reaction products, such as quinones, hydroxyl-PAHs, and nitro-PAHs were not found in the AMS signal (Dzepina et al., 20061), but at this point in its development, the AMS is not specific or sensitive enough to detect them at the very low expected concentrations. However, because APAH* does not also fall off at the same rate as SPAH at this time of day, coating of the particles is a more likely explana-tion for the rapid decay of SPAH.
Another factor to be considered in these analyses is the semi-volatile nature of PAHs and their ability to repartition between gaseous and particulate forms (Allen et al., 1996). Some PAHs present on the surfaces of freshly emitted com-bustion particles may slowly desorb from the particles as am-bient temperatures increase in the late morning. This phe-nomenon may contribute to the faster decay of the SPAH versus APAH* signal, if it involves PAHs that are detected by the PAS but not by the AMS, i.e. three-ring PAHs. Improved measurement techniques, especially at high time resolution for the smaller particle-phase PAHs, are needed to explore this hypothesis further.
5 Conclusions
Particulate PAH concentrations were measured by three dif-ferent methods in Mexico City in April 2003: analysis of time-integrated filters, aerosol photoionization, and aerosol mass spectrometry. Speciated measurements suggest that motor vehicles are the predominant daytime source of PAHs and that wood and garbage burning are important night-time sources. Particulate PAH concentrations are correlated with both CO and naphthalene. During the morning rush hour, total particulate PAH concentrations rise to a maximum
of ∼110 ng m−3 between 07:30–08:00 and then decrease
throughout the remainder of the morning to ∼20 ng m−3
in the afternoon. Overnight concentrations rise as high as 50 ng m−3. The more rapid decrease in surface versus bulk PAH concentrations during the late morning suggests that freshly emitted combustion-related particles are quickly coated by secondary aerosol material in Mexico City’s at-mosphere, and may also be transformed by heterogeneous reactions.
These results have important implications for public health and for climate. The diurnal pattern of ambient concentra-tions implies that exposure to PAHs will be much higher dur-ing the morndur-ing rush hour compared to the rest of the day. The rapid transformation of particle-phase PAHs during the morning suggests that the toxicity of fresh versus aged par-ticles may differ. If PAHs are coated by other compounds, their bioavailability may decrease. Likewise, rapid coating of primary soot particles suggests that internally mixed par-ticles containing black carbon cores will be prevalent in the outflow of Mexico City, which will lead to enhanced absorp-tion of radiaabsorp-tion and thus a larger perturbaabsorp-tion of the regional radiation balance by these particles.
Acknowledgements. We are grateful to R. Ramos of RAMA, S. Blanco and F. Angeles of CENICA, and R. Atkinson. This research was supported by funds from the Alliance for Global Sustainability and the Mexican Metropolitan Environmental Commission to the Integrated Program on Urban, Regional and Global Air Pollution at MIT. We also acknowledge funding from the NSF Atmospheric Chemistry Program, Grants ATM-0308748 and ATM-0528634, and from the DOE Atmospheric Sciences Program, Grant DE-FG02-05ER63981. K. Dzepina is a recipient of an Advanced Study Program (ASP) Fellowship from the National Center for Atmospheric Research.
Edited by: C. E. Kolb
References
Allen, J. O., Dookeran, N. M., Smith, K. A., Sarofim, A. F., Taghizadeh, K., and LaFleur, A. L.: Measurement of poly-cyclic aromatic hydrocarbons associated with size-segregated at-mospheric aerosols in Massachusetts, Environ. Sci. Technol., 30, 1023–1031, 1996.
Arey, J.: Atmospheric reactions of PAHs including formation of ni-troarenes, in: The Handbook of Environmental Chemistry, edited by: Neilson, A. H., vol. 3, part I, Springer, Berlin, 1998. Atkinson, R. and Arey, J.: Atmospheric chemistry of gas-phase
polycyclic aromatic hydrocarbons: formation of atmospheric mutagens, Environmental Health Perspectives, 102, 117–126, 1994.
Bahreini, R., Keywood, M. D., Ng, N. L., Varutbangkul, V., Gao, S., Flagan, R. C., Seinfeld, J. H., Worsnop, D. R., and Jimenez, J. L.: Measurements of secondary organic aerosol from oxidation of cycloalkenes, terpenes, and m-xylene using an Aerodyne aerosol mass spectrometer, Environ. Sci. Technol., 39, 5674–5688, 2005.
Behymer, T. D. and Hites, R. A.: Photolysis of polycyclic aromatic hydrocarbons adsorbed on fly ash, Environ. Sci. Technol., 22, 1311–1319, 1988.
Benner, B. A., Gordon, G. E., and Wise, S. A.: Mobile sources of atmospheric polycyclic aromatic hydrocarbons: A roadway tunnel study, Environ. Sci. Technol., 23, 1269–1278, 1989. Bertram, A. K., Ivanov, A. V., Hunter, M., Molina, L. T., and
Molina, M. J.: The reaction probability of OH on organic sur-faces of tropospheric interest, J. Phys. Chem. A, 105, 9415–9421, 2001.
Calvert, J. G., Atkinson, R., Becker, K. H., Kamens, R. M., Sein-feld, J. H., Wallington, T. J., and Yarwood, G.: The Mechanisms of Atmospheric Oxidation of Aromatic Hydrocarbons, Oxford University Press, New York, 2002.
Chandra, S., Satheesh, S. K., and Srinivasan, J.: Can the state of mixing of black carbon aerosols explain the mystery of ‘ex-cess’ atmospheric absorption?, Geophys. Res. Lett., 31, L19109, doi:10.1029/2004GL020662, 2004.
Conant, W. C., Seinfeld, J. H., Wang, J., Carmichael, G. R., Tang, Y. H., Uno, I., Flatau, P. J., Markowicz, K. M., and Quinn, P. K.: A model for the radiative forcing during ACE-Asia de-rived from CIRPAS Twin Otter and R/V Ronald H. Brown data and comparison with observations, J. Geophys. Res., 108, 8661, doi:10.1029/2003JD003260, 2003.
de Foy, B., Caetano, E., Maga˜na, V., Zitacuaro, A., C´ardenas, B., Retama, A., Ramos, R., Molina, L. T., and Molina, M. J.: Mexico City basin wind circulation during the MCMA-2003 field cam-paign, Atmos. Chem. Phys., 5, 2267–2288, 2005.
DeCarlo, P., Slowik, J. G., Worsnop, D. R., Davidovits, P., and Jimenez, J. L.: Particle morphology and density characterization by combined mobility and aerodynamic diameter measurements. Part I: theory, Aerosol Sci. Technol., 38, 1185–1205, 2004. Denissenko, M. F., Pao, A., Tang, M., and Pfeifer, G. P.: Preferential
formation of benzo[a]pyrene adducts at lung cancer mutational hotspots in P 53, Science, 18, 430–432, 1996.
Donaldson, D. J., Mmereki, B. T., Chaudhuri, S. R., Handley, S., and Oh, M.: Uptake and reaction of atmospheric organic vapours on organic films, Faraday Discuss., 130, 227–239, 2005. Dunn, M., Jimenez, J. L., Baumgardner, D., Castro, T.,
Mc-Murry, P. H., and Smith, J. N.: Measurements of Mexico City nanoparticle size distributions: observations of new par-ticle formation and growth, Geophys. Res. Lett., 31, L10102, doi:10.1029/2004GL019483, 2004.
Esteve, W., Budzinski, H., and Villenave, E.: Heterogeneous re-activity of OH radicals with phenanthrene, Polycyclic Aromatic Compounds, 23, 441–456, 2003.
Esteve, W., Budzinski, H., and Villenave, E.: Relative rate con-stants for the heterogeneous reactions of OH, NO2and NO
rad-icals with polycyclic aromatic hydrocarbons adsorbed on car-bonaceous particles. Part 1: PAHs adsorbed on 1–2 mm cali-brated graphite particles, Atmos. Environ., 38, 6063–6072, 2004. Esteve, W., Budzinski, H., and Villenave, E.: Relative rate con-stants for the heterogeneous reactions of NO2and OH radicals with polycyclic aromatic hydrocarbons adsorbed on carbona-ceous particles. Part 2: PAHs adsorbed on diesel particulate ex-haust SRM 1650a, Atmos. Environ., 40, 201–211, 2006. Finlayson-Pitts, B. J. and Pitts, J. N.: Chemistry of the Upper and
Lower Atmosphere, Academic Press, San Diego, CA, 2000. Hannigan, M. P., Cass, G. R., Penman, B. W., Crespi, C. L.,
Lafleur, A. L., Busby, W. F., Thilly, W. G., and Simoneit, B. R. T.: Bioassay-directed chemical analysis of Los Angeles air-borne particulate matter using a human cell mutagenicity assay, Environ. Sci. Technol., 32, 3502–3514, 1998.
Hart, K. M., McDow, S. R., Giger, W., Steiner, D., and Burthscher, H.: The correlation between in-situ, real-time aerosol photoemis-sion intensity and particulate polycyclic aromatic hydrocarbon concentration in combustion aerosols, Water, Air, Soil Pollut., 68, 75–90, 1993.
Jacobson, M. Z.: Strong radiative heating due to the mixing state of black carbon in atmospheric aerosols, Nature, 409, 695–697, 2001.
Jayne, J. T., Leard, D. C., Zhang, X., Davidovits, P., Smith, K. A., Kolb, C. E., and Worsnop, D. R.: Development of an aerosol mass spectrometer for size and composition analysis of submi-cron particles, Aerosol Sci. Technol., 33, 49–70, 2000.
Jensen, T. E. and Hites, R. A.: Aromatic diesel emissions as a func-tion of engine condifunc-tions, Anal. Chem., 55, 594–599, 1983. Jimenez, J. L., Jayne, J. T., Shi, Q., Kolb, C. E., Worsnop, D. R.,
Yourshaw, I., Seinfeld, J. H., Flagan, R. C., Zhang, X., Smith, K. A., Morris, J., and Davidovits, P.: Ambient aerosol sampling with an aerosol mass spectrometer, J. Geophys. Res., 108, 8425– 8438, 2003.
Johnson, K. S., Zuberi, B., Molina, L. T., Molina, M. J., Iedema, M. J., Cowin, J. P., Gaspar, D. J., Wang, C., and Laskin, A.: Processing of soot in an urban environment: case study from the Mexico City Metropolitan Area, Atmos. Chem. Phys., 5, 3033– 3043, 2005.
Jones, C. C., Chughtai, A. R., Murugaverl, B., and Smith, D. M.: Effects of air/fuel combustion ratio on the polycyclic aromatic hydrocarbon content of carbonaceous soots from selected fuels, Carbon, 42, 2471–2484, 2004.
Kamens, R. M., Fulcher, J. N., and Zhishi, G.: Effects of tempera-ture on wood soot PAH decay in atmospheres with sunlight and low NOx, Atmos. Environ., 20, 1579–1587, 1986.
Kamens, R. M., Guo, Z., Fulcher, J. N., and Bell, D. A.: Influence of humidity, sunlight, and temperature on the daytime decay of polyaromatic hydrocarbons on atmospheric soot particles, Envi-ron. Sci. Technol., 22, 103–108, 1988.
Kamens, R. M., Perry, J. M., Saucy, D. A., Bell, D. A., Newton, D. L., and Brand, B.: Factors which influence polycyclic aromatic hydrocarbon decomposition on wood smoke particles, Environ. Int., 11, 131–136, 1985.
Karcher, W. and Fordham, R. J.: Spectral Atlas of Polycyclic Aromatic Compounds, Kluwer Academic Publishers, Dordrecht, The Netherlands, 1987.
Lim, L. H., Harrison, R. M., and Harrad, S.: The contribution of traffic to atmospheric concentrations of polycyclic aromatic hy-drocarbons, Environ. Sci. Technol., 33, 3538–3542, 1999. Lu, R., Wu, J., Turco, R. P., Winer, A. M., Atkinson, R., Arey,
J., Paulson, S. E., Lurmann, F. W., Miguel, A. H., and Eiguren-Fernandez, A.: Naphthalene distributions and human exposure in Southern California, Atmos. Environ., 39, 489–507, 2004. Marr, L. C., Black, D. R., and Harley, R. A.: Formation of
photo-chemical air pollution in central California 1. Development of a revised motor vehicle emission inventory, J. Geophys. Res., 107, 4047, doi:10.1029/2001JD000689, 2002.
Marr, L. C., Grogan, L. A., Worhrnschimmel, H., Molina, L. T., Molina, M. J., Smith, T. J., and Garshick, E.: Vehicle traffic as a
source of particulate polycyclic aromatic hydrocarbon exposure in Mexico City, Environ. Sci. Technol., 38, 2584–2592, 2004. Marr, L. C., Kirchstetter, T. W., Harley, R. A., Miguel, A. H.,
Her-ing, S. V., and Hammond, S. K.: Characterization of polycyclic aromatic hydrocarbons in motor vehicle fuels and exhaust emis-sions, Environ. Sci. Technol., 33, 3091–3099, 1999.
McDow, S. R., Giger, W., Burthscher, H., Schmidt-Ott, A., and Siegmann, H. C.: Polycyclic aromatic hydrocarbons and com-bustion aerosol photoemission, Atmos. Environ., 24A, 2911– 2916, 1990.
Miguel, A. H., Kirchsetter, T. W., Harley, R. A., and Hering, S. V.: On-road emissions of particulate polycyclic aromatic hydrocar-bons and black carbon from gasoline and diesel vehicles, Envi-ron. Sci. Technol., 32, 450–455, 1998.
Molina, M. J., Ivanov, A. V., Trakhtenberg, S., and Molina, L. T.: Atmospheric evolution of organic aerosol, Geophys. Res. Lett., 31, L22104, doi:10.1029/2004GL020910, 2004.
Nielsen, T.: Traffic contribution of polycyclic aromatic hydrocar-bons in the center of a large city, Atmos. Environ., 30, 3481– 3490, 1996.
Niessner, R.: The chemical response of the photo-electric aerosol sensor (PAS) to different aerosol systems, J. Aerosol Sci., 17, 705–714, 1986.
Niessner, R., Hemmerich, B., and Wilbring, P.: Aerosol photoemis-sion for quantification of polycyclic aromatic hydrocarbons in simple mixtures adsorbed on carbonaceous and sodium chloride aerosols, Anal. Chem., 52, 2071–2074, 1990.
Ramdahl, T.: Retene-a molecular marker of wood combustion in ambient air, Nature, 306, 580–582, 1983.
Ravishankara, A. R.: Heterogeneous and multiphase chemistry in the troposphere, Science, 5315, 1058–1065, 1997.
Reisen, F. and Arey, J.: Atmospheric reactions influence seasonal PAH and nitro-PAH concentrations in the Los Angeles basin, En-viron. Sci. Technol., 39, 64–73, 2005.
Salcedo, D., Onasch, T. B., Dzepina, K., Canagaratna, M. R., Zhang, Q., Huffman, J. A., DeCarlo, P. F., Jayne, J. T., Mor-timer, P., Worsnop, D. R., Kolb, C. E., Johnson, K. S., Zuberi, B., Marr, L. C., Volkamer, R., Molina, L. T., Molina, M. J., Car-denas, B., Bernab´e, R. M., M´arquez, C., Gaffney, J. S., Marley, N. A., Laskin, A., Shutthanandan, V., Xie, Y., Brune, W., Lesher, R., Shirley, T., and Jimenez, J. L.: Characterization of ambient aerosols in Mexico City during the MCMA-2003 campaign with Aerosol Mass Spectrometry: results from the CENICA supersite, Atmos. Chem. Phys., 6, 925–946, 2006.
Sanderson, E. G. and Farant, J.-P.: Atmospheric size distribution of PAHs: evidence of a high-volume sampling artifact, Environ. Sci. Technol., 39, 7631–7637, 2005.
Sasaki, J. C., Arey, J., Eastmond, D. A., Parks, K. K., and Grosovsky, A. J.: Genotoxicity induced in human lymphoblasts by atmospheric reaction products of naphthalene and phenan-threne, Mutation Research – Genetic Toxicology and Environ-mental Mutagenesis, 393, 23–35, 1997.
Schauer, C., Niessner, R., and P¨oschl, U.: Polycyclic aromatic hy-drocarbons in urban air particulate matter: decadal and seasonal trends, chemical degradation, and sampling artifacts, Environ. Sci. Technol., 37, 2861–2868, 2003.
Secretar´ıa del Medio Ambiente, Inventario de Emisiones a la At-mosfera: Zona Metropolitana del Valle de Mexico 2000, Gob-ierno del Distrito Federal, Mexico, 2003.
Seki, K.: Ionization energies of free molecules and molecular solids, Mol. Cryst. Liq. Cryst., 171, 255–270, 1989.
Shirley, T. R., Brune, W. H., Ren, X., Mao, J., Lesher, R., Carde-nas, B., Volkamer, R., Molina, L. T., Molina, M. J., Lamb, B., Velasco, E., Jobson, T., and Alexander, M.: Atmospheric oxi-dation in the Mexico City Metropolitan Area (MCMA) during April 2003, Atmos. Chem. Phys. Discuss., 5, 6041–6076, 2005. Siegmann, K. and Siegmann, H. C.: Fast and reliable “in situ”
eval-uation of particles and their surfaces with special reference to diesel exhaust, SAE Technical Paper Series, 2000-01-1995, 1–7, 2000.
Simoneit, B. R. T., Medeiros, P. M., and Didyk, B. M.: Combus-tion products of plastics as indicators for refuse burning in the atmosphere, Environ. Sci. Technol., 29, 6961–6970, 2005. Slowik, J. G., Stainken, K., Davidovits, P., Williams, L. R., Jayne, J.
T., Kolb, C. E., Worsnop, D. R., Rudich, Y., DeCarlo, P. F., and Jimenez, J. L.: Particle morphology and density characteriza-tion by combined mobility and aerodynamic diameter measure-ments. Part 2: Application to combustion-generated soot aerosols as a function of fuel equivalence ratio, Aerosol Sci. Technol., 38, 1206–1222, 2004.
Takada, H., Onda, T., and Ogura, N.: Determination of polycyclic aromatic hydrocarbons in urban street dusts and their source ma-terials by capillary gas chromatography, Environ. Sci. Technol., 24, 1179–1186, 1990.
Tancell, P. J., Rhead, M. M., Pemberton, R. D., and Braven, J.: Sur-vival of polycyclic aromatic hydrocarbons during diesel combus-tion, Environ. Sci. Technol., 29, 2871–2876, 1995.
Tong, H. Y., Shore, D. L., Karasek, F. W., Helland, P., and Jel-lum, E.: Identification of organic-compounds obtained from incineration of municipal waste by high-performance liquid-chromatographic fractionation and gas-chromatography mass-spectrometry, J. Chromatography, 285, 423–441, 1984. Velasco, E., Siegmann, P., and Siegmann, H. C.: Exploratory study
of particle-bound polycyclic aromatic hydrocarbons in different environments in Mexico City, Atmos. Environ., 38, 4957–4968, 2004.
Volkamer, R., Molina, L. T., Molina, M. J., Shirley, T., and Brune, W. H.: DOAS measurement of glyoxal as an indicator for fast VOC chemistry in urban air, Geophys. Res. Lett., 32, L08806, doi:10.1029/2005GL022616, 2005.
Wallace, L.: Real-time monitoring of particles, PAH, and CO in an occupied townhouse, Applied Occupational and Environmental Hygiene, 15, 39–47, 2000.
Wasserkort, R., Hartmann, A., Widmer, R. M., and Burthscher, H.: Correlation between on-line PAH detection in airborne particle samples and their bacterial genotoxicity, Ecotoxicology and En-vironmental Safety, 40, 126–136, 1996.
Watson, J. G. and Chow, J. C.: A wintertime PM2.5episode at the
Fresno, CA supersite, Atmos. Environ., 36, 465–475, 2002. Westerholm, R. N., Almen, J., and Li, H.: Chemical and
biologi-cal characterization of particulate-, semivolatile-, and gas-phase-associated compounds in diluted heavy-duty diesel exhausts: a comparison of three different semi-volatile-phase samplers, En-viron. Sci. Technol., 25, 332–338, 1991.
Westerholm, R. N., Alsberg, T. E., Frommelin, A. B., Strandell, M. E., Rannug, U., Winquist, L., Grigoriadis, V., and Egeback, K.-E.: Effect of fuel polycyclic aromatic hydrocarbon content on the emissions of polycyclic aromatic hydrocarbons and other mu-tagenic substances from a gasoline-fueled automobile, Environ. Sci. Technol., 22, 925–930, 1988.
Williams, P. T., Abbass, M. K., Andrews, G. E., and Bartle, K. D.: Diesel particulate emissions: the role of unburned fuel, Combus-tion and Flame, 75, 1–24, 1986.
Zhang, Q., Alfarra, M. R., Worsnop, D. R., Allan, J. D., Coe, H., Canagaratna, M. R., and Jimenez, J. L.: Deconvolution and quan-tification of hydrocarbon-like and oxygenated organic aerosols based on aerosol mass spectrometry, Environ. Sci. Technol., 39, 4938–4952, 2005a.
Zhang, Q., Canagaratna, M. R., Jayne, J. T., Worsnop, D. R., and Jimenez, J. L.: Time and size-resolved chemical compo-sition of submicron particles in Pittsburgh – implications for aerosol sources and processes, J. Geophys. Res., 110, D07S09, doi:10.1029/2004JD004649, 2005b.
Zhang, Q., Worsnop, D. R., Canagaratna, M. R., and Jimenez, J. L.: Hydrocarbon-like and oxygenated organic aerosols in Pittsburgh: insights into sources and processes of organic aerosols, Atmos. Chem. Phys., 5, 3289–3311, 2005c.
Zielinska, B., Sagebiel, J., Arnott, W. P., Rogers, C. F., Kelly, K. E., Wagner, D. A., Lighty, J. S., Sarofim, A. F., and Palmer, G.: Phase and size distribution of polycyclic aromatic hydrocarbons in diesel and gasoline vehicle emissions, Environ. Sci. Technol., 38, 2557–2567, 2004a.
Zielinska, B., Sagebiel, J., McDonald, J. D., Whitney, K., and Lawson, D. R.: Emission rates and comparative chemical com-position from selected in-use diesel and gasoline-fueled vehi-cles, Journal of the Air and Waste Management Association, 54, 1138–1150, 2004b.
![Fig. 1. Concentrations (gas + particle phases) of benzo[ghi]perylene (BghiP), indeno[1,2,3-cd]pyrene (IndPy), coronene (Cor), pyrene (Py), methylphenanthrenes (Mphen), retene (1-methyl-7-isopropylphenanthrene), and 1,3,5-triphenylbenzene (TPBz) on 29 April](https://thumb-eu.123doks.com/thumbv2/123doknet/14708428.566905/5.892.71.428.100.239/concentrations-particle-phases-perylene-coronene-methylphenanthrenes-isopropylphenanthrene-triphenylbenzene.webp)