HAL Id: hal-02057957
https://hal.archives-ouvertes.fr/hal-02057957
Submitted on 5 Mar 2019HAL is a multi-disciplinary open access archive for the deposit and dissemination of sci-entific research documents, whether they are pub-lished or not. The documents may come from teaching and research institutions in France or
L’archive ouverte pluridisciplinaire HAL, est destinée au dépôt et à la diffusion de documents scientifiques de niveau recherche, publiés ou non, émanant des établissements d’enseignement et de recherche français ou étrangers, des laboratoires
bridge
Lucas Bourreau, Véronique Bouteiller, Franck Schoefs, Laurent Gaillet, Benoit
Thauvin, Julien Schneider, Samuel Naar
To cite this version:
Lucas Bourreau, Véronique Bouteiller, Franck Schoefs, Laurent Gaillet, Benoit Thauvin, et al.. Un-certainty assessment and decision from concrete electrical resistivity measurements on a coastal large bridge. 40th IABSE Symposium : Tomorrow’s Megastructures, Sep 2018, NANTES, France. 6 p. �hal-02057957�
1
Uncertainty assessment and decision from concrete electrical
resistivity measurements on a coastal large bridge
Lucas Bourreau
SIXENSE Concrete, Agence Ouest, F44115 Haute-Goulaine, France
Véronique Bouteiller
Université Paris-Est, MAST, EMGCU, IFSTTAR, 77447 Marne-la-Vallée, France
Franck Schoefs
Université Bretagne Loire, Université de Nantes, GeM, UMR CNRS 6183, Research Institute in Civil
Engineering and Mechanics, France, IUML FR CNRS 3473, Sea and Littoral research Institute,
Nantes, France
Laurent Gaillet
Université Bretagne Loire, IFSTTAR, MAST, SMC, F44344 Bouguenais, France
Benoit Thauvin
Cerema Ouest, F22015 Saint-Brieuc, France
Julien Schneider
Cerema Ile-de-France, F77171 Sourdun, France
Samuel Naar
SIXENSE Concrete, Agence Ouest, F44115 Haute-Goulaine, France
Contact: franck.schoefs@univ-nantes.fr
Abstract
For RC structures exposed to marine environments, chloride-induced corrosion leads to deteriorations that can be associated to different exposure conditions: tidal, splash and atmospheric. The on-site assessment of the corrosion condition of the reinforcement in concrete relies on a corrosion diagnosis which consists in different techniques and among them non destructive techniques such as half-cell potential, resistivity and corrosion measurements. Although the two first techniques are commonly used, variability and uncertainties in NDT condition assessment remain factors that need to be better understood in order to increase the reliability of the diagnosis particularly in the case of marine structures (in comparison with atmospheric structures for which literature is more important).
The objectives of the Project DéCoF-Ré (2014-2017) were to study both the concrete durability and the corrosion state of the piers of the Ile de Ré bridge which is located in the French Atlantic coast. Concerning the corrosion study, visual inspections, rebar localization, half-cell potential mapping, electrical concrete resistivity mapping and corrosion rate measurements were performed during three years in order to analyse the influence of the measurement procedures, the investigated zones (pier number, side, height) and the environments (tide level, climatic conditions). This paper focuses on the resistivity measurements conducted
with a four electrodes arrangement probe (Wenner type) on the piers of the Ile de Ré bridge using a vessel. Although resistivity values cannot directly provide an information on the passive/active state of the rebar because the measurement qualifies the electrical resistivity of the concrete cover (and not the resistivity of the steel/concrete interface which is usually obtained by Linear Polarisation Resistance measurements), it is a useful non destructive technique to point out the areas where the corrosion might be strongest. The purpose of this paper is to outline the errors made while measuring the resistivity given the uncertainty assessment based on both (i) the repeatability tests and (ii) the material local anisotropy and measurement's variability. Moreover, a model based on the evaluation of Probability of Wrong Assessment is proposed to help the owner of the bridge in taking a decision.
Keywords:
reinforced concrete, bridge, marine environment, resistivity NDT measurements,
uncertainty
1 Introduction
In Europe, most civil engineering reinforced concrete (RC) structures have been built during the last 60 years and their ageing is becoming a great challenge in terms of deterioration assessment, repair decision and management strategy [1, 2]. For RC structures exposed to marine environments, chloride-induced corrosion leads to deteriorations that can be associated to different exposure conditions: tidal, splash and atmospheric. On-site, the assessment of the corrosion condition of the reinforcement in concrete relies on a corrosion diagnosis which consists in different techniques [3, 4-6] and among them non destructive techniques such as half-cell potential [7], resistivity [8, 9] and corrosion measurements [10]. Although the two first techniques are commonly used, variability and uncertainties in NDT condition assessment remain factors that need to be better understood in order to increase the reliability of the diagnosis [11, 12] particularly in the case of marine structures (in comparison with atmospheric structures for which literature is more important).
The objectives of the Project DéCoF-Ré (2014-2017) were to study both the concrete durability and the corrosion state of the piers of the Ile de Ré bridge which is located in the French Atlantic coast. Concerning the corrosion study, visual inspections, rebar localization, half-cell potential mapping [13],
during three years in order to analyse the influence of the measurement procedures, the investigated zones (pier number, side, height) and the environments (tide level, climatic conditions). This paper focuses on the resistivity measurements conducted with a four electrode arrangement probe (Wenner type) on the piers of the Ile de Ré bridge (Figure 1) using a vessel. Although resistivity values cannot directly provide an information on the passive/active state of the rebar [14] because the measurement qualifies the electrical resistivity of the concrete cover, it is a useful non destructive technique to point out the areas where the corrosion might be strongest. The purpose of this paper is to outline the errors made while measuring the resistivity given the uncertainty assessment based on the repeatability tests. Another issue was analysed: the material local anisotropy and measurement's variability. It is not detailed but the key results are reminded in the conclusion.
3 Figure 1: Figure 1: Mesh and position of the probe for repeatability measurements.
2.2
Concrete resistivity assessment
with a 4 electrode probe on the bridge
The resistivity measurements were performed using a Proceq RESIPOD® probe which follows the Wenner technique. This probe is composed of four equally spaced electrodes which ensure the electrical contact with the concrete surface. A small alternative current I is passed between the outermost electrodes trough the concrete cover and the resultant potential difference V is measured between the two inner electrodes. The concrete electrical resistivity ρ for a semi-infinite geometry is given by (1), where "a" is the electrode spacing (5cm for the Resipod probe).
ρ = 2π ∗ a ∗
𝑉
𝐼
(1)In the case of measurements performed on samples in the laboratory, the error of measurements coming from the device itself, as given by the constructor is
ξρ,dev=3* σρ,dev =2.4 kΩ.cm.
Corrosion diagnosis was performed on 15 piers (14 offshore and 1 onshore). The measurements were carried out on two opposite sides of the piers: side C was more exposed to dominant winds and daily sunshine leading to a stronger action of wetting/drying cycles whereas side G was less exposed (Figure 2). The dimensions of the investigated zones were 3m height and 1.85 m width. Measurements were carried out between +3.95 m and +6.95 m Chart Datum (CD). Chart Datum fixes an absolute sea level reference along the French coast and in this paper, La Rochelle – La Pallice harbour was considered as the reference. As the objective of the paper was to assess and to model uncertainty of resistivity measurements, the influence of the corrosion was disregarded, considering a pier, which was diagnosed passive on both sides. Measurements were performed during the rising tide on one non-damaged pier, thus allowing the concrete to dry and to oxygenate during about 2-3 hours for the bottom part (1m
high) and about 6-7 hours for the higher part (2-3 meters).
Figure 2: Top view of the pier and exposure sides C and G.
2 Protocols and results
2.1 Procedure for the repeatability test
The objective was to determine the repeatability of the resistivity measurements when performed on-site. For this purpose, the probe was always positioned according to direction II (in Red, Figure 3) and 35 consecutive measurements (not readings) on the same location were carried out in each mesh. The twelve meshes of sides C and G were investigated.
Figure 3: Mesh and position of the probe for repeatability measurements.
NORTH
G
C WEST
2.2 Results of measurements
The mean value μρ,rep and the standard deviation
σρ,rep were computed from the 35 measurements in
each mesh. For each of the 13 meshes of side C (Figure 4), Figure 5 (a) plots the 35 resistivity values measured in one mesh with its mean resistivity value inside the same mesh. Similarly, Figure 5 (b) plots the results for the 13 meshes of side G. For both exposures (sides C and G), results showed that for resistivity measurements in the range 10-160 kΩ.cm, the scatter increases when the mean resistivity increases (10-150 kΩ.cm range).
Figure 4: Position of steel rebars and of the meshes for sides C (left) and G (right).
(a)
(b)
Figure 5: Repeatability test: sides C (a) and G (b).
2.3 Uncertainty modelling of the state
dependant unvertainty
To quantify this trend, the evolution of the standard deviation with the mean resistivity is presented in Figure §. All the values were fitted with a linear relation (2) which regression coefficient was equal to 0.96. Linear fitting parameters were 0.13 (coefficient of variation) for the slope and near zero for the y-intercept (-2,05 kΩ.cm), which was in the same range of magnitude of the error of the device (+/-2.4 kΩ.cm) indicating that the measurements are not biased. These results mean that when performing resistivity measurements on-site, the scattering of the measurements increases with the mean resistivity value by a factor of about 50. To our knowledge, this result has not been published yet.
5
σ𝛒,rep = 0,13. µ𝛒,rep− 2,05 (2)
3 Discussion on the protocol
Les us consider now other orientations of electrodes than the one plotted on Figure 3. That is a measure of the effect of material variability on the measurement. We propose here the protocol and the results.
3.1 Protocols for material variability
assessment
According to the 4 positions plotted on Figure 6, tests have been carried out to cover the whole surface (10 measurements).
Figure 7: Scheme of the mesh and positions (I, II, III and IV) of the probe.
3.2 Modelling
Standard deviation was computed from the 40 measurements on each mesh (4 positions x10 tests) and liked to the condition state.
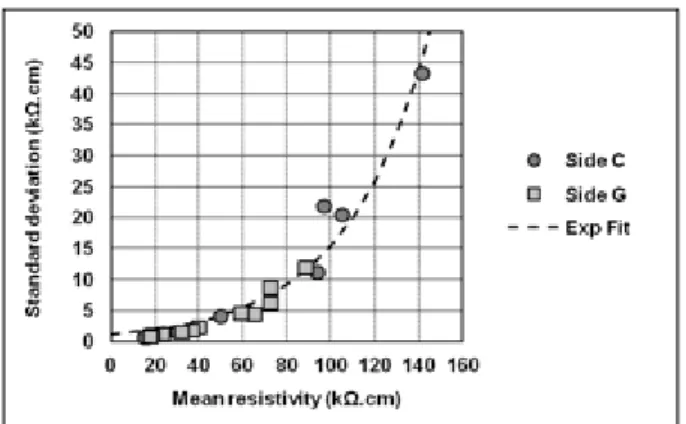
It is plotted on Figure 8.
Figure 8: Evolution of standard deviation with mean resistivity for material and measurement variability's.
As presented in Figure 8, the scattering of the resistivity measurements was not increasing with the mean resistivity following a linear relation but an exponential relation (R²=0.96). The equation of the exponential fitting relation given in (3)Erreur ! Source du renvoi introuvable. covers a mean resistivity range from 10 to 140 k.cm.
σ
𝛒,𝑡𝑜𝑡= 1.16 𝑒
0.026.μ𝛒,𝑡𝑜𝑡 (3)4 Conclusions
This paper aims to evaluate several sources of on-site error based on a dedicated campaign of concrete electrical resistivity measurements performed on a bridge in a marine environment. It is shown that errors of assessment from the resistivity measurements are not negligible. The repeatability error increases linearly with the resistivity and the local anisotropy of the material affects strongly the assessment for high resistivity values (ρ≥80 kΩ.cm): the coefficient of variation of total error reaches 30% around 140 kΩ.cm.
Acknowledgements
The authors would like to thank the team of the DéCoF-Ré Project: B. Godart, W. Traverst, P. Boujard, N. Coulaty-Chin, A. Orcesi, Y. El Rabbih, X. Derobert, M. Sissoko (IFSTTAR); R. Queguiner, S. Pasquiet, P. Boulaire, M. Rebours, C. Naudat (Cerema Ouest); F. Landrin and V. Queyrat (Cerema Ile de France), J-F. Barthélémy (Cerema Dtech ITM); M. Roche, O. Amiri (Nantes University); M. Brouxel,
S. Naar (SIXENSE-Concrete), A. Audouin-Dubreuil, F. Lavoute, M. Barbier (Département de la Charente-Maritime); F. Gazet (Dekra). They also thank the marine team for their help with the vessel.
References
[1] Broomfield JP. Corrosion of steel in concrete - Understanding, investigation and repair. London: E&FN SPN; 1997.
[2] R. Cigna, C. Andrade, U. Nürnberger, R. Polder, R. Weydert, Seitz E, et al. COST 521 - Corrosion of steel in reinforced concrete structures - Final Report: European Communities, Luxembourg, EUR 20599; 2003.
[3] Montemor, M. F., Chloride-induced corrosion on reinforcing steel: from the fundamentals to the monitoring techniques, Cem Concr Compos 25 [4] ASTM C876-91, Standard test method for half-cell potentials of uncoated reinforcing steel in concrete, American Society for Testing and Materials, USA (1999)
[5] Cox RN, Cigna R, Vennesland O, Valente T, (Eds). COST 509 - Corrosion and protection of metals in contact with concrete - Final Report: European Commission, Directorate General Science, Research and Development, Brussels, EUR 17608 EN; 1997
[6] ASTM C876-09, Standard test method for half-cell potentials of uncoated reinforcing steel in concrete, American Society for Testing and Materials, USA (2009)
[8] Gonzalez, J. A. et al, Considerations on reproducibility of potential and corrosion rate measurements in reinforced concrete, Corr Sci 46 (2004), 2467-2485
[9] Hussain, R.R., Underwater half-cell corrosion potential bench mark measurement of corroding steel in concrete influenced by a variety of material science and environmental engineering variables, Measurement 44 (2011), 274-280
[10] Caliński T. and Harabasz J., A dendrite method
[11] Breysse D, Yotte S, Salta M, Schoefs F, Ricardo J, Chaplain M. Accounting for variability and uncertainties in NDT condition assessment of corroded RC-structures. European Journal of Environmental and Civil Engineering. 2009;13(5):573-91.
[12] Breysse D, Abraham O. Méthodologie d'évaluation non destructive de l'état d'altération des ouvrages en béton. Presses de l'Ecole Nationale des Ponts et Chaussées ed2005.
[13] Bourreau L, Bouteiller V, Schoefs F, Gaillet L, Thauvin B, Schneider J, et al. On-site corrosion monitoring - reliability. Materials, Systems and Structures in Civil Engineering Conference, Segment on Electrochemistry in Civil Engineering. Technical University of Denmark, Lyngby, Denmark 2016.
[14] Hornbostel K, Larsen CK, Geiker MR. Relationship between concrete resistivity and corrosion rate – A literature review. Cement and Concrete Composites. 2013;39(0):60-72.