Publisher’s version / Version de l'éditeur:
Vous avez des questions? Nous pouvons vous aider. Pour communiquer directement avec un auteur, consultez la première page de la revue dans laquelle son article a été publié afin de trouver ses coordonnées. Si vous n’arrivez pas à les repérer, communiquez avec nous à PublicationsArchive-ArchivesPublications@nrc-cnrc.gc.ca.
Questions? Contact the NRC Publications Archive team at
PublicationsArchive-ArchivesPublications@nrc-cnrc.gc.ca. If you wish to email the authors directly, please see the first page of the publication for their contact information.
https://publications-cnrc.canada.ca/fra/droits
L’accès à ce site Web et l’utilisation de son contenu sont assujettis aux conditions présentées dans le site LISEZ CES CONDITIONS ATTENTIVEMENT AVANT D’UTILISER CE SITE WEB.
Client Report (National Research Council of Canada. Construction), 2016-12-23
READ THESE TERMS AND CONDITIONS CAREFULLY BEFORE USING THIS WEBSITE. https://nrc-publications.canada.ca/eng/copyright
NRC Publications Archive Record / Notice des Archives des publications du CNRC :
https://nrc-publications.canada.ca/eng/view/object/?id=154d665d-8e15-4c58-b7c6-e43979ae3b05 https://publications-cnrc.canada.ca/fra/voir/objet/?id=154d665d-8e15-4c58-b7c6-e43979ae3b05
For the publisher’s version, please access the DOI link below./ Pour consulter la version de l’éditeur, utilisez le lien DOI ci-dessous.
https://doi.org/10.4224/23002874
Access and use of this website and the material on it are subject to the Terms and Conditions set forth at
Evaluation of thermal and moisture response of highly insulated
wood-frame wall assemblies: Part II: parametric numerical simulation
evaluation for risk of condensation
Construction
Evaluation of Thermal and Moisture
Response of Highly Insulated Wood
Frame Wall Assemblies
– Part II
Parametric Numerical Simulation Evaluation
for Risk of Condensation
Report: A1-006035.2
Travis V. Moore, Michal Bartko and Michael A. Lacasse
Table of Contents
Table of Contents ... iii
List of Figures ...iii
List of Tables ...iii
Executive Summary ... v
1 Background ... 1
2 Approach ... 2
2.1 Introduction ... 2
2.2 Implementation of numerical model ... 2
2.2.1 Configuration of numerical model ... 2
2.2.2 Initial and Boundary Conditions ... 7
Initial conditions — ... 7
Interior boundary conditions — ... 7
Exterior boundary conditions — ... 7
2.3 Method for assessment of condensation resistance ... 8
2.3.1 Numerical simulation to assess condensation resistance of wall assemblies .. 8
2.4 Response of wall components to transient boundary conditions ... 10
3 Description of numerical simulation model ... 10
4 Simulation Results ... 10
4.1 Comparison to Experiment ... 10
4.2 Parametric Analysis ... 11
4.2.1 Temperature Comparison ... 13
4.2.2 Moisture Content/Relative Humidity Comparison ... 16
4.2.3 Relative Humidity Comparison ... Error! Bookmark not defined. 4.3 RHT92, Mould Growth Decay Factor Results ... 16
List of Figures
Figure 1: Wall 1 Geometry, Air leakage path (blue arrows), and location of performance
comparison (red box). ... 3
Figure 2: Wall 2 Geometry, Air leakage path (blue arrows), and location of performance comparison (red box). ... 5
Figure 3: Wall 3 Geometry, Air leakage path (blue arrows), and location of performance comparison (red box). ... 7
Figure 4: Model comparison to Experimental Results for Wall 1, comparison of results for location just above the OSB slit. ... 12
Figure 5: Model comparison to Experimental Results for Wall 1, comparison for location just above the OSB slit. ... 12
Figure 6: Temperature Comparison Vancouver, BC ... 14
Figure 7: Temperature Comparison Yellowknife, NT ... 14
Figure 8: Temperature Comparison Edmonton, AB ... 15
Figure 9: Temperature Comparison St. John’s, NL ... 15
Figure 10: Moisture Content Comparison Vancouver, BC... 17
Figure 11: Moisture Content Comparison Yellowknife, NT ... 17
Figure 12: Moisture Content Comparison Edmonton, AB ... 18
Figure 13: Moisture Content Comparison St. John’s, NL ... 18
Figure 14: Relative Humidity Comparison Vancouver, BC ... 19
Figure 15: Relative Humidity Comparison Yellowknife, NT ... 19
Figure 16: Relative Humidity Comparison Edmonton, AB ... 20
Figure 17: Relative Humidity Comparison St. John’s, NL ... 20
List of Tables
Table 1: Wall 1 XPS (R29) - Constructed vs. Modeled Geometry ... 3Table 2: Wall 2 Passiv Haus (R43) Constructed vs. Modeled Geometry... 5
Table 3: Wall 3 OSB (R29) ... 6
Table 4 - Design indoor relative humidity, Simplified Method‡ ... 7
Table 5 - Maximum Overall Thermal Transmittance (W/m2·K) of Above‐ground Opaque Building Assemblies ... 8
Executive Summary
In this report are results for Project A1-006035 Evaluation of Thermal and Moisture Response of Highly Insulated Wood-Frame Walls. The first report1 provides a description of and results
from an experimental program, undertaken in the NRC’s Field Exposure of Walls test Facility, in which the response of three different highly insulated wood frame wall assemblies subjected to local climate conditions of Ottawa was monitored over an 9-month period between January and September 2017. In this report, results are provide from numerical simulations used to determine the hygrothermal performance of the same three wall assemblies as were evaluated in the experimental program. The walls were subjected to the yearly climate loads of four locations in Canada: Vancouver, BC, Yellowknife, NT, Edmonton, AB, and St. John’s, NL. The hygrothermal performance of each wall assembly was evaluated numerically using the hygrothermal simulation tool hygIRC 2D, to determine the risk for the formation of
condensation within the wall due to diffuse air leakage. The numerical simulation tool was first validated by comparing results derived from simulation to those from experiment, the
experimental results provided in the first report.
The hygrothermal performance of the three wall assemblies when subjected to the climate conditions of four Canadian locations were derived from numerical simulations on the basis of the response of wall components within the respective wall assemblies to the imposed transient climate loads. Simulation results were provided in terms of temperature, moisture content and relative humidity for a region of focus within the wall susceptible to moisture accumulation due to the simultaneous effects of diffuse air leakage across the assembly and cold surface temperatures of the bottom plate in proximity to the exterior sheathing panel of the wall. When considering this region of focus , the results indicate that condensation does not occur in sufficient quantity to cause wood deterioration in any of the wall assemblies, as indicated by the computed values for RHT9 index, mould growth index, and α decay factor.
Further investigation of hygrothermal performance indicated that W2 generally had a colder exterior bottom plate temperature, owing to its increased R-value, and W1 and W3 had very similar thermal performance. Correspondingly the results for moisture content indicate that W2 had higher moisture content than W1 and W3, likely due to the colder temperature of the exterior sheathing panel causing increased risk to condensation on this surface. However, although the moisture content of the bottom plate of W2 was higher than that of either W1 or W3, levels were not sufficiently high to suggest that there was a risk to wood deterioration.
1Bartko, M. et al.(2016); Evaluation of Thermal and Moisture Response of Highly Insulated Wood Frame Walls –
Part I - Experimental Trials in the Field Exposure of Walls Test Facility; Report A1-006035.01; National Research Council Canada; Ottawa; October 2016; 31 pgs.
REPORT A1-006035.2 vi
In two locations Vancouver and St. John’s the performance between W and W was
indistinguishable. However, in Edmonton and Yellowknife, locations of much colder average annual temperatures, the hygrothermal performance indicated that W3, as compared to W1, could more readily dissipate any accumulated moisture and dry out; the rate of decrease in moisture content over time was greater for W3 than W1. The two primary reasons for this are: (i) W3 (OSB) as compared to W1 (OSB+XPS), has fewer and more vapour permeable components through which water vapour can dissipate from the region of focus to the exterior; (ii) there is a difference between the vapour barrier used for W1 (conventional polyethylene sheet) , and W3 (OSB). Excess water vapour in W3 may be taken up by either of two OSB panels; the one acting as vapour barrier and the other as exterior sheathing panel. The addition of an OSB panel to the interior appears to offer some buffering capacity in the stud cavity; this could warrant further investigation.
Building Regulations for Market Access Program
Evaluation of Thermal and Moisture Response of Highly
Insulated Wood Frame Wall Assemblies
– Part II
Parametric Numerical Simulation Evaluation for Risk of
Condensation
Authored by:
Travis V. Moore, Michal Bartko and Michael A. Lacasse
A Report for the
Canadian Wood Council
ATT: Dr. Robert Jonkman
National Research Council Canada Ottawa ON K1A 0R6 Canada
23 December 2016
This report may not be reproduced in whole or in part without the written consent of the National Research Council Canada and the Client
Evaluation of Thermal and Moisture Response of
Highly Insulated Wood Frame Walls
Parametric Numerical Simulations for Risk of Condensation Authored by
Travis V. Moore, Michal Bartko and Michael A. Lacasse
1 Background
This report details the results from a parametric analysis of highly insulated wood frame wall assemblies for condensation resistance in cold climate locations in Canada. The method of analysis consists of comparing the performance of three highly insulated wood frame wall assemblies using a two dimensional hygrothermal (heat air and moisture) simulation software; hygIRC 2D. The report details the validation of the hygrothermal software by comparing experimental results for the three wall assemblies with results generated by the hygrothermal software. Details of these experiments are provided in Bartko 1. Thereafter the validated
software is used to determine the performance of the highly insulated wood frame wall assemblies when subjected to simulated weather conditions for various locations across
Canada. The evaluated locations consist of Vancouver BC, Yellowknife, NT, Edmonton, AB, and St. John’s, NL.
In this report, information is provided on the:
Details of the approach used in and the implementation of the numerical simulations; includes defining the initial conditions and interior and exterior boundary conditions; Method for assessment of moisture performance; that comprises (i) defining types of
process to be modelled; (ii) characterizing the response of the model elements to imposed conditions and; (iii) describing the method of analysis of simulation results; Response of wall components to transient boundary conditions showing the locations in
the wall assembly having a propensity to deterioration due to moisture accumulation; Description of the numerical model and of the wall configurations simulated;
REPORT A1-006035.2 2
2 Approach
2.1 Introduction
The method to assess the resistance of the wall assembly to deterioration due to moisture can be attributed to two main factors, risk of condensation on the interior surface of the exterior
sheathing board, and moisture ingress from precipitation to the wall assembly through water penetration beyond the cladding. Generally, moisture ingress beyond the cladding, and thereby into the wall assembly, can be attributed to a cladding installation feature. As this study is concerned with the performance of highly insulated wall assemblies, and not necessarily
cladding, the performance criteria selected for comparison of the wall assemblies was the risk to formation of condensation on the interior surface of the exterior sheathing board. From
previous studies conducted2 for risk to condensation it was determined that the highest risk to
condensation occurs as a result of diffuse air leakage.
Thus the method to assess the resistance of the wall assembly to the formation of condensation is to employ a numerical model for which the following elements of the model are to be
defined:
• Configuration of numerical model • Interior boundary conditions • Exterior boundary conditions • Initial conditions
To permit an appreciation of the implementation of the numerical model, each of these elements is described in turn.
2.2 Implementation of numerical model
2.2.1 Configuration of numerical modelThe numerical model is to be configured so as to determine the risk to condensation that occurs due to diffuse air leakage. Diffuse Air leakage assumes that leakage occurs through openings in the air barrier the size of which are chosen to ensure an equivalent air leakage of 0.1 L/s-m2 at a pressure difference of 75Pa.
The wall configurations as implemented in the two dimensional model, are described in the following sections. The constructed wall configurations are described in more detail in report A1-006035.1 (Bartko et. al).
2Ojanen, T. ; Kumaran, M. K. (1995), Effect of exfiltration on the hygrothermal behaviour of a residential wall assembly : Results
from calculations and computer simulations, International Symposium on Moisture Problems in Building Walls, Porto, Portugal, September 11-13, 1995, pp. 157-167; NRCC-38783
2.2.1.A.1 Wall 1 – XPS
The as constructed details and the as modeled details of Wall 1 (W1) are described in Table 1, and Figure 1. The continuous exterior insulation layer of the first wall (W1 XPS) was created by adding a 25 mm (1 in) thick board of extruded polystyrene (XPS) onto the 11 mm (7/16 in.) thick oriented strand board (OSB) with polymer-based sheathing membrane. The OSB board was attached to the 38 mm x 140 mm (1.5 x 5.5 in.) wood-frame wall and friction-fit glass fibre batt insulation of R-24 was added accordingly from the interior. The interior side of the wall 1
consisted of polyethylene air and vapour barrier (6 mil thick), and a 12.7mm (0.5 in) thick interior drywall. The overall nominal thermal resistance for W1 (XPS) was R29. The modeled air leakage path (blue arrows) and location for comparative analysis (red box) are shown in Figure 1.
Table 1: Wall 1 XPS (R29) - Constructed vs. Modeled Geometry
2.2.1.A.2 Wall 2 – Passiv Haus
The as constructed and as modeled details of Wall 2 (W2) are described in
As Constructed As Modeled Label
Figure 1 Vinyl Siding (3mm) Vinyl Siding (3mm) 1 19mm Strapping & air space Airspace (19mm) 2
XPS (25mm) XPS (25mm) 3
Sheathing membrane Spunbonded Olefin (0.15mm) 4 OSB Sheathing (11mm) OSB Sheathing (11mm) 5
Wood Studs (5.5in) Pine (140mm) 6
R24 Glass-fibre insulation (Stud cavity insulation)
Low Density Glass Fibre
(140mm) 7
6 mil poly air/vapour barrier Polyethylene (0.15mm) 8 1/2in –painted drywall Primed Gypsum (12.7mm) 9
Figure 1: Wall 1 configuration; showing air leakage path (blue arrows), & region of focus
permitting performance comparisons (red box)
1
2
3
4
5
6
7
8
9
REPORT A1-006035.2 4
Table 2. The primary insulation for the second wall (W2 PH- Passive Haus) was wood fiber batt placed in between 38 x 230mm (1.5 x 9.125 in) wood frame against 24mm (1 in.) wood based exterior diffusion board. Secondary interior wood frame 38 x 90mm (1.5 x 3.5 in), with distances between studs altering from the locations of the primary ones to eliminate thermal bridging, was also filled with wood fiber batt insulation. The 11 mm (7/16 in.) thick OSB between the two stud-wall layers acts as a vapor retarder; the 12.7mm (0.5 in) thick interior drywall formed the interior side. For W2 the wood fiber insulation provided a nominal R-value of R43.
Table 2: Wall 2 Passiv Haus (R43) Constructed vs. Modeled Geometry
As Constructed As Modeled Label in
Figure 2
Vinyl Siding (3mm) Vinyl Siding (3mm) 1
19mm Strapping and Air Space Airspace (19mm) 2
XPS (25mm) XPS (25mm) 3
Sheathing Membrane Spun-bonded Polyolefin (0.15mm) 4 Diffusion Board (24mm) Diffusion Board (24mm) 5
Wood Studs (254mm) Pine (254mm) 6
Wood Fibre Insulation (stud
cavity) –( 254mm) Wood fibre Insulation (254mm) 7
OSB sheathing (11mm) OSB (11mm) 8
Wood Studs (89mm) Pine (89mm) 9
Wood Fibre Insulation (89mm) Wood Fibre Insulation (89mm) 10 1/2in –painted drywall Primed Gypsum (12.5mm) 11
Figure 2: Wall 2 configuration showing air leakage path (blue arrows), & region of focus permitting performance comparisons (red box)
1
2
3
4
5
6
7
8
9
REPORT A1-006035.2 6
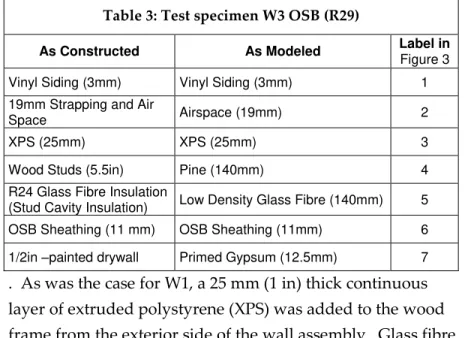
2.2.1.A.3 Test specimen W3 – OSB
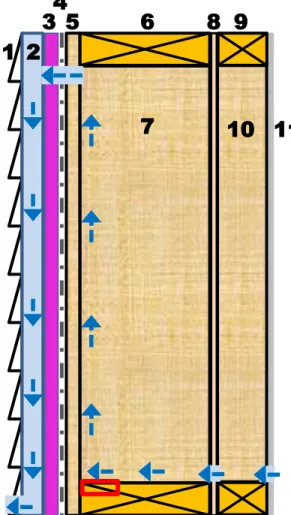
Test specimen W3 (W3 OSB), consisted of the same components as test specimen W1, with the difference being that the order of layers was rearranged as provided in
. As was the case for W1, a 25 mm (1 in) thick continuous layer of extruded polystyrene (XPS) was added to the wood frame from the exterior side of the wall assembly. Glass fibre batt insulation (R-24) was installed between the vertical studs of the wood frame and an 11 mm (7/16 in.) thick OSB panel, having taped joints, was affixed to the frame; the OSB panel was intended to act as a smart vapour barrier. The interior finish was 12.7mm (0.5 in) thick gypsum drywall panel. The overall nominal thermal resistance of W3 was R29.
Table 3: Test specimen W3 OSB (R29)
As Constructed As Modeled Label in
Figure 3 Vinyl Siding (3mm) Vinyl Siding (3mm) 1 19mm Strapping and Air
Space Airspace (19mm) 2
XPS (25mm) XPS (25mm) 3
Wood Studs (5.5in) Pine (140mm) 4
R24 Glass Fibre Insulation
(Stud Cavity Insulation) Low Density Glass Fibre (140mm) 5 OSB Sheathing (11 mm) OSB Sheathing (11mm) 6 1/2in –painted drywall Primed Gypsum (12.5mm) 7
Figure 3: W3 configuration showing air leakage path (blue arrows), & location of region of
focus to permit comparing performance (red box). Table 3: Test specimen W3 OSB (R29)
As Constructed As Modeled Label in
Figure 3 Vinyl Siding (3mm) Vinyl Siding (3mm) 1 19mm Strapping and Air
Space Airspace (19mm) 2
XPS (25mm) XPS (25mm) 3
2.2.2 Initial and Boundary Conditions
Values for the interior and exterior boundary conditions as well as initial simulation
conditions were the same when assessing either the
condensation resistance in respect to diffusion or to diffuse air leakage; the respective descriptions for interior and exterior boundary conditions and initial simulation conditions are given below.
Initial conditions —All materials in the assembly were
initiated having 10% RH and 20°C; simulations were initiated in January of the simulation year.
Interior boundary conditions —Interior conditions were those given in the ASHRAE Standard 160-2009, Simplified Method3;
the simplified method is a function of average daily outdoor temperature as given in Table 4.
Table 4 - Design indoor relative humidity, Simplified Method‡
Daily Average Outdoor Temperature Design RH (Based on °C) Below -10°C 40% -10°C < To, daily < 20°C 40% + (To, daily + 10°C) %°C Above 20°C 70%
Where To, daily (°C) is the daily average outdoor temperature.
Exterior boundary conditions —Exterior boundary conditions were selected to ensure a cold climate where condensation would occur, and a climate in which drying would also occur. The maximum overall thermal transmittance for an
above-ground opaque wall assembly for the respective NECB defined climate zones is given in Table 5. The simulation boundary conditions were selected to cover two weather years, the first year (conditioning year) being the average weather year, and the second year (evaluation year) is the 10th percentile cold year, as prescribed in ASHRAE Std-160-20093. Each wall configuration was
exposed to simulated weather conditions for the following locations: Vancouver, BC, Yellowknife, NT; Edmonton, “” and St. John’s, NL.
3
ASHRAE Standard 160-2009, Criteria for Moisture-Control Design Analysis in Buildings; B-3 R24 Glass Fibre Insulation
(Stud Cavity Insulation) Low Density Glass Fibre (140mm) 5 OSB Sheathing (11 mm) OSB Sheathing (11mm) 6 1/2in –painted drywall Primed Gypsum (12.5mm) 7
Figure 3: W3 configuration showing air leakage path (blue arrows), & location of region of
focus to permit comparing performance (red box).
1
3
5
6
4
7
2
REPORT A1-006035.2 8
With respect to wall orientation, the direction of the normal outward from the wall was north, i.e. the wall faced north. This direction was chosen to minimize the amount of solar radiation on the wall and thus maintain the exterior surface temperature of the wall lower than that of walls facing other directions and thereby increase the potential for condensation within the assembly.
Table 5 - Maximum Overall Thermal Transmittance (W/m2·K) of
Above‐ground Opaque Building Assemblies4
Heating Degree-Days of Building Location, Celsius Degree-Days Zone 4: <3000 Zone 5: 3000 to 3999 Zone 6: 4000 to 4999 Zone 7A: 5000 to 5999 Zone 7B: 6000 to 6999 Zone 8: ≥ 7000 Wall U-value (R-value) 0.315 (R18)* 0.278 (R20) 0.247 (R23) 0.210 (R27) 0.210 (R27) 0.183 (R31) Location of interest (HDD) Prince Rupert, BC (3900) Three Rivers, QC (4990) Winnipeg, MB (5670) Ft. Nelson, BC (6710) Iqaluit, NU (9980) Jan 1% Tdesign (°C) -15 -28 -35 -42 -40
* R-values are equivalent effective imperial thermal resistance values
2.3 Method for assessment of condensation resistance
To assess the condensation resistance of wall assemblies, numerical simulations were
undertaken to determine the hygrothermal response of the wall assemblies to the interior and exterior boundary conditions for each climate location. The numerical simulation is first validated to experimental results for the three wall assemblies evaluated, and then each wall assembly is simulated in each climate location, as described in the previous section. Thereafter, and on the basis of the results derived from simulation, an analysis of results permitted
assessing the performance of each wall assembly for the given climate location. The approach to simulation is first described followed by the method of analysis of simulation results.
2.3.1 Numerical simulation to assess condensation resistance of wall assemblies
The numerical simulations were undertaken using the interior and exterior boundary
conditions, and initial conditions as earlier defined; the simulation was completed over a two (2) year period for the selected climate locations and the response of the wall to climate loads was determined over the final year of simulation.
The simulations were calculated on an hourly basis, with results derived for daily averages of values for temperature and RH for each material in the wall assembly. For this evaluation, wall performance according to condensation resistance was determined based on the moisture accumulation in the stud cavity at the bottom plate and on that portion of the plate closet to the exterior sheathing panel; at these locations focus was on moisture accumulation on the
4
uppermost horizontal surface of the wood plate are marked in red (~2mm x 2mm region of focus ) for W1, W2, and W3, respectively, in Figure 1, Figure 2 and Figure 3. The wall
performance was determined by averaging the temperature and moisture content within the region of focus . Wall performance for any given climate location may be compared by
calculating the performance in the region of focus based on the average values of temperature and %RH derived from simulation at this 2mm x 2mm section, and in accordance with the following criteria:
(1)
Activation factor, or α-factor The α-factor (0 < α ≤ is defined as a relative measure ofthe presumed condition state of wood at the initiation of a process of wood mass loss due to the presence of wood rot fungi. According to Viitanen et al5, the value of α-factor is
generally representative of the onset of irreversible wood decay, and is based on an empirical regression equation for decay development in untreated pine sapwood under constant temperature and relative humidity conditions. The value of the α-factor is initially 0 and gradually increases to a limiting value of 1 at which the mass loss (degradation) is thought to be initiated.
(2) The onset of mould growth, as calculated according to that given in Saber et. al.6, and
referred to as either the: (i) RHT(92) index, or; Mould index (M).
The empirical relations, described in (1) above, are based on work earlier carried out by
Viitanen focused on modelling the time factor in the development of mould fungi in wood7 and
more specifically on the time for the development of brown rot decay in pine and spruce 8. The
RHT index, as described by Kumaran et al.9 has been used a basis for evaluating the
performance of several other wall assemblies, whereas the mould growth index, presented in (2), and as developed by Saber et al.6, is also based on the work of Viitanen10.
The rationale for the selection of these performance criteria is provided in Lacasse et al.11
5
Viitanen; H.; Toratti, T.; Makkonen, L.; Peuhkuri, R.; Ojanen, T.; Ruokolainen, L.; Räisänen, J. (2010), Towards modelling of decay risk of wooden materials, Eur. J. Wood Prod. (2010) 68: 303–313
6
Saber, H. H. and M. A. Lacasse (2015) Performance Evaluation of Proprietary Drainage Components and Sheathing Membranes when Subjected to Climate Loads – Task 6 – Hygrothermal Performance of NBC-Compliant Reference Wall for Selected Canadian Locations; Research Report; National Research Council Canada; Ottawa, ON; 59 pgs.
7
Viitanen, H (1997a) Modelling the time factor in the development of mould fungi in wood—the effect of critical humidity and temperature conditions. Holzforschung 51(1):6–14
8
Viitanen, H (1997b); Critical time of different humidity and temperature conditions for the development of brown rot decay in pine and spruce. Holzforschung 51(2):99–106
9
Kumaran, M. K.; Mukhopadhyaya, P.; Cornick, S. M.; Lacasse, M. A.; Maref, W.; Rousseau, M. Z.; Nofal, M.; Quirt, J. D.; Dalgliesh, W. A. (2002), A Methodology to develop moisture management strategies for wood-frame walls in North America: application to stucco-clad walls; 6th Symposium on Building Physics in the Nordic Countries: 17 June 2002, Trondheim, Norway; pp. 651-658
10
Viitanen, H. (2011), Moisture and Bio-Deterioration Risk of Building Materials and Structures, Chapter 25, in: Mass Transfer - Advanced Aspects; Edited by Hironori Nakajima, ISBN 978-953-307-636-2, 836 pages, Publisher: InTech, November 04, 2011; DOI: 10.5772/1432
11
Lacasse et al. (2016), Development of criteria for assessing the long-term performance (durability) of wood frame wall assemblies, NRC Internal Report, October, 2016.
REPORT A1-006035.2 10
2.4 Response of wall components to transient boundary conditions
The response of components within the wall assemblies to imposed hygrothermal loads and as derived from the results of simulation are reflected from the values of temperature and relative humidity (or moisture content) that are generated for all discrete elements of which the wall is configured in the model. The specific locations of interest within the wall assembly were those notionally more at risk to the formation of condensation. As such, simulation results (i.e. Temperature, °C and %RH / % Moisture content) were retrieved over the simulation period for the region of focus , i.e., the uppermost horizontal surface of the bottom plate and closet to the exterior sheathing panel.
3 Description of numerical simulation model
The 2-D hygrothermal simulation model hygIRC-2D was used to complete the numerical simulations; a brief description of this model is given in the report prepared by Hens12.
4 Simulation Results
The simulation results are presented in two sections; first the simulation results of each wall assembly are compared to the experimental results given by ”artko in the Evaluation of Thermal and Moisture Response of Highly Insulated Wood Frame Walls – Part I”1; this permits validation of
the numerical simulation to the experimental results. Thereafter, the results from the
parametric study are given for each wall subjected to the climate conditions of the 4 different locations selected for the study (i.e. Vancouver, BC; Yellowknife, NT; Edmonton, AB; and St. John’s, NL .
4.1 Comparison of simulation results to those of the experiment
To ensure that the hygrothermal model adequately captures the performance of wall
assemblies, the model was compared to experimental results. The experimental results were generated in the Field Exposure of Walls Facility (FEWF) at the National Research Council in Ottawa. The experiments were conducted on a mock-up of each wall assembly and the results derived from the temperature, RH, moisture content and heat flux sensors were used to determine the hygrothermal response of each wall assembly when exposed to local weather conditions. Full details of the experiments are given in the report by BartkoError! Bookmark not defined..
he comparison of numerical simulation to experimental results was carried out for Wall 1, by comparing the temperatures of the OSB sheathing board above and below the purposely made
12
Hens, H. (1996), Modelling - Final Report, Volume 1, Part 1; Belgium, KU Leuven, Laboratorium Bouwfysica, Departement Burgerlijke Bouwkunde, 1996, 90 pp
opening in the air barrier (horizontal slit) and through which air leakage across the wall assembly occurred.
Experimental as well as the results from modelling for the temperature on the OSB panel just above (Figure 4) and below (Figure 5) the horizontal slit are given for a period of about 1400 hours, and specifically representative of the conditions prevailing in the months of June and July 2016 (hour 0 June 1 at 12:32am). Results from this comparison are intended to
demonstrate the capability of the model to predict the thermal response of the wall assemblies when exposed to hygrothermal loads.
4.2 Parametric Analysis
Subsequent to the comparison between experimental and numerical simulation results, the model was then used to determine the relative performance of wall assemblies when subjected to the climate of different locations across Canada, and that included: Vancouver BC,
Yellowknife, NT, Edmonton, “”, and St. John’s, NL. The performance of the wall assemblies was determined by focusing on the (~2mm x 2mm) region of focus , the uppermost horizontal surface of the bottom plate (exterior bottom plate in the case of Wall 2). The average
temperature, average moisture content, and average relative humidity for that portion of the bottom plate were determined for each geographic location for which simulations were completed. From this data values for the decay factor α , RHT9 index and mould growth
REPORT A1-006035.2 12
Figure 4: Model comparison to Experimental Results for Wall 1, comparison of results for location just above the OSB slit
Figure 5: Model comparison to Experimental Results for Wall 1, comparison for location just below the OSB slit
index were then calculated. The figures that follow are three sets of results, the first of which relates to average temperature, the second to average moisture content, and the third to average relative humidity at the region of focus in the wall where there is risk to the formation of mould or rot. Each of respective set of results is given in relation to the climate location; thus results for average temperature in the region of focus are provided for Vancouver BC, Yellowknife, NT, Edmonton, AB, and St. John’s, NL, respectively, in Figure 6 to Figure 9; for average moisture content for the same 4 climate locations, respectively, in Figure 10 to Figure 13, and; for average relative humidity in the region of focus in Figure 14 to Figure 17.
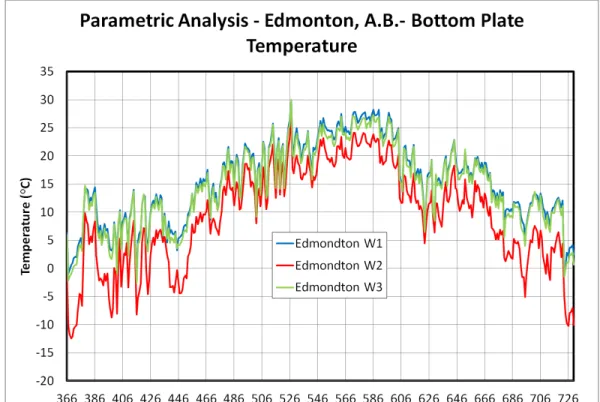
Comparison of temperature of the uppermost portion of the bottom plate
Overall the comparison of temperature of uppermost portion of the bottom plate (2mm x 2mm section) for each climate location indicates that both test specimens W1 and W3 perform very similarly, whereas W2 exhibits a lower temperature for all climate locations.
In the colder months the corresponding temperatures of W1 and W3 are to be expected considering the similarity of the thermal resistance across the wall at the bottom plate. The lower temperature occurring in W2 is also to be expected, considering it has a higher thermal resistance compared to W1 and W3 between the exterior sheathing panel at the bottom plate and the interior.
For all climate locations, the difference in temperature for the bottom plates between wall configurations decrease in the warmer months, likely due to the decreased difference in R-value in the wall configuration’s between the bottom plate and the interior.
REPORT A1-006035.2 14
Figure 6: Temperature Comparison Vancouver, BC
Figure 8: Temperature Comparison Edmonton, AB
REPORT A1-006035.2 16
4.2.1 Comparison of moisture content / RH ― ”ottom plate region of focus
Similar to the temperature results, overall the moisture content/relative humidity comparisons (Figure 10 to Figure 17) show that W1 and W3 perform similarly, and W2 generally has higher moisture content in the bottom plate.
Comparing W1 and W3 performance for each location shows that for Vancouver (Figure 10, Figure 14 and St. John’s Figure 13, Figure 17), the results are too similar to
determine any difference in performance between the two wall configurations. The results from Edmonton (Figure 12, Figure 16) and Yellowknife (Figure 11, Figure 15) indicate that W3 seems to dry out more rapidly (decrease in moisture content/RH) after a wetting event as compared to W1. This could potentially be due to two causes: (i) W1 has a set of components in series that together diminish the rate of vapour transfer from the region of focus within the wall at the bottom plate as compared to W3 (Wall 1 - OSB+XPS, vs. Wall 3 - XPS), which decreases the rate of moisture transfer between the bottom plate and the exterior; (ii) the difference between vapour barrier technologies used between the two walls for which W1 uses a conventional polyethylene vapour barrier whereas W3 uses OSB in lieu of the polyethylene sheet. Further investigation is required at other locations in the wall assembly to determine the most likely cause.
The increased moisture level of W2 is likely due to the effects of diffuse air leakage that causes warm humid interior air to come into contact with a cold (compared to Wall 1 and 3) exterior sheathing board at the bottom plate. Even though the moisture load on the bottom plate of W2 is higher, the moisture content does not increase beyond 19% in any climate location with the exception of St. John’s. In St. John’s although the moisture content is beyond 9%, this trend is common for all three walls, and all three wall assemblies dry out (decrease in M.C.) rapidly following the increased wetting event.
4.3
Results for values of RHT92 index, Mould Growth index and α Decay Factor
Analysis of the relative humidity and temperature results presented previously indicate that that levels of relative humidity at the uppermost surface of the bottom plate located in the stud cavity rarely occurred beyond 80% RH for all climate locations simulated. As the lower limit threshold for accumulating values of RHT92 index is 92% RH and the lower limit threshold for mould growth or decay is 80% RH, the results indicate that no appreciable wood deterioration of the bottom plate occurs in any of these wall assemblies for any climate location for which simulations were completed.Figure 10: Moisture Content Comparison Vancouver, BC
REPORT A1-006035.2 18
Figure 12: Moisture Content Comparison Edmonton, AB
Figure 14: Relative Humidity Comparison Vancouver, BC
REPORT A1-006035.2 20
Figure 16: Relative Humidity Comparison Edmonton, AB
5 Conclusions
This study provides information on and results derived from numerical simulation to assess the hygrothermal performance of three different highly insulated wood frame wall assemblies when subjected to the climate loads of different Canadian locations including that of Vancouver, ”C, Yellowknife, NT, Edmonton, “”, and St. John’s, NL. The hygrothermal performance of each wall assembly was evaluated numerically using the hygrothermal simulation tool hygIRC 2D, for risk of condensation due to diffuse air leakage. The numerical simulation tool was first validated by comparing results derived from simulation to those from experiment. The experimental program, undertaken over an 8-month period in the NRC’s Field Exposure of Walls test Facility, allowed monitoring the response of the three wall assemblies, having different levels of thermal resistance, to local climate conditions.
The hygrothermal performance of the three wall assemblies when subjected to the climate conditions of four Canadian locations were derived from numerical simulations on the basis of the response of wall components within the respective wall assemblies to the imposed transient climate loads. Simulation results were provided in terms of temperature, moisture content and relative humidity for a region of focus within the wall susceptible to moisture accumulation due to the simultaneous effects of diffuse air leakage across the assembly and cold surface temperatures of the bottom plate in proximity to the exterior sheathing panel of the wall. When considering this region of focus , the results indicate that condensation does not occur in sufficient quantity to cause wood deterioration in any of the wall assemblies, as indicated by the computed values for: RHT92 index, mould growth index, and α decay factor.
Further investigation of hygrothermal performance indicated that W2 generally had a colder exterior bottom plate temperature, owing to its increased R-value, and W1 and W3 had very similar thermal performance. Correspondingly the results for moisture content indicate that W2 had higher moisture content than W1 and W3, likely due to the colder temperature of the exterior sheathing panel causing increased risk to condensation on this surface. However, although the moisture content of the bottom plate of W2 was higher than that of either W1 or W3, levels were not sufficiently high to suggest that there was a risk to wood deterioration. In two locations Vancouver and St. John’s) the performance between W1 and W3 was
indistinguishable. However, in Edmonton and Yellowknife, locations of much colder average annual temperatures, the hygrothermal performance indicated that W3, as compared to W1, could more readily dissipate any accumulated moisture and dry out; the rate of decrease in moisture content over time was greater for W3 than W1. The two primary reasons for this are: (i) W3 (OSB) as compared to W1 (OSB+XPS), has fewer and more vapour permeable components through which water vapour can dissipate from the region of focus to the exterior; (ii) there is a difference between the vapour barrier used for W1 (conventional polyethylene sheet) , and W3 (OSB). Excess water vapour in W3 may be taken up by either of two OSB panels; the one acting as
REPORT A1-006035.2 22
vapour barrier and the other as exterior sheathing panel. The addition of an OSB panel to the interior appears to offer some buffering capacity in the stud cavity; this could warrant further investigation.