OATAO is an open access repository that collects the work of Toulouse
researchers and makes it freely available over the web where possible
Any correspondence concerning this service should be sent
to the repository administrator:
[email protected]
To cite this version:
Trajin, Baptiste and Chabert, Marie and Régnier, Jérémi and Faucher,
Jean Wigner distribution for the diagnosis of high frequency amplitude
and phase modulations on stator currents of induction machine. (2009)
In: 2009 IEEE International Symposium on Diagnostics for Electric
Machines, Power Electronics and Drives (SDEMPED 2009), 31 August
2009 - 3 September 2009 (Cargese, France)
This is an author’s version published in: http://oatao.univ-toulouse.fr/21676
Wigner Distribution for the Diagnosis of High
Frequency Amplitude and Phase Modulations on
Stator Currents of Induction Machine
Baptiste Trajin, IEEE Student Member, Marie Chabert, Jeremi Regnier, IEEE Member, Jean Faucher, IEEE
Member
Abstract—This paper deals with mechanical fault monitoring
in induction machines from stator current measurements. The considered faults lead to amplitude and/or phase modulations of the measured stator current. The different faults can be char-acterized by their time-frequency signatures via the Wigner dis-tribution. The time-frequency representations apply to complex signals that may be obtained through the Hilbert transform of the real measured signal. In case of high frequency modulations, it can not be taken advantage of the time frequency signatures. This study proposes an alternative complex signal representation for modulated stator currents. The so-called space vector is obtained through the Concordia transform. From three stator current measurements, the Concordia transform builds a complex vector which conveniently carries the information about phase and amplitude modulations. This paper applies and compares the Wigner distribution computed with the Hilbert and Concordia transforms in case of simulated and experimental signals with various modulation frequency ranges.
Index Terms—Diagnosis, High frequency modulations,
Induc-tion motor, Wigner DistribuInduc-tion.
I. INTRODUCTION
M
ONITORING techniques are intensively investigated to increase the reliability and safety of industrial systems containing induction motors. Stator current based monito-ring can be preferred to an expensive vibration analysis for mechanical fault detection. Indeed, current signals are often already available for control purpose. Detection of mechanical faults such as shaft eccentricity or load torque oscillations is traditionally based on the stator current spectral analysis [1]. Eccentricity and load torque oscillations have been shown to produce amplitude and phase modulation of the stator current respectively. A time-frequency representation such as Wigner distribution allows to detect and classify the defaults according to their signatures [2]. This method handles a complex signal obtained from the Hilbert transform of the real observed signal under the Bedrosian theorem conditions. However, mechanical faults such as bearing or gear box faults may induce specific harmonics whose frequencies violate these conditions [3]. Consequently, such faults induce high frequency modulations ————————————————B. Trajin, J. Regnier and J. Faucher are with the Universit´e de Toulouse; INP, UPS; LAPLACE; ENSEEIHT, 2 rue Camichel, BP7122, F-31071 Toulouse Cedex 7;
CNRS; LAPLACE; F-31071 Toulouse Cedex 7.
(e-mail: {baptiste.trajin, jeremi.regner, jean.faucher}@laplace.univ-tlse.fr) M. Chabert is with the Universit´e de Toulouse; INPT / ENSEEIHT - IRIT 2, rue Camichel BP 7122 F-31071 Toulouse Cedex 7.
(e-mail: [email protected])
on stator currents. The diagnosis from the time-frequency signatures can thus be misleading.
The Concordia transform, is often used in electrical engi-neering for control purposes [4] and to detect electrical or mechanical static converter defects, unbalanced electrical sys-tems, machine stator electric defects, mechanical eccentricity or bearing defects [5], [6]. This paper proposes the Concordia transform as an alternative to the Hilbert transform to build a complex vector, in the case of three-phase electrical drives. Then, a time-frequency analysis through the Wigner distrib-ution can be performed, even when the Bedrosian theorem conditions are not verified. Section II recalls stator current model of the induction machine in case of eccentricity and/or load torque oscillations. The effect of dynamic eccentricity and load torque oscillations on the stator current are presented. Moreover, signal processing methods are introduced. Section III derives the Wigner distribution of modulated stator currents obtained with the Hilbert analytic signal and the Concordia space vector. Differences between Wigner distributions are underlined considering the Bedrosian theorem limitations. Sec-tion IV compares the Wigner distribuSec-tion on simulated stator currents with various modulation frequency ranges in steady state and variable frequency applications. Finally, section V derives the Wigner distribution and the associated modulation signatures from the Hilbert or Concordia complex signals on experimental stator currents.
II. STATOR CURRENT MODEL AND SIGNAL PROCESSING METHODS
In electrical drives, eccentricity and load torque oscillations are the main mechanical faults investigated for diagnosis purposes. It has been demonstrated that eccentricity leads to amplitude modulation (AM) and load torque oscillations lead to phase modulation (PM) on the stator currents [2]. Wigner distribution may be used in variable speed applications to distinguish load torque oscillations and eccentricity [7]. AM and PM (i.e. eccentricity and load torque oscillations) are distinguishable using phase shift of sideband components of Wigner distribution of stator currents. However, few papers deal with high frequency modulations induced by bearing faults for instance [8].
A. Fault currents in three-phase induction machines
In three-phase machines, combination of mechanical faults, eccentricity and load torque oscillations, lead to simultaneous
amplitude and phase variations on the stator currents. Conse-quently the three-phase currents can be written in a simple form by (1). ik(t) = a(t) cos(ψ(t) − φk), k = 1, 2, 3 (1) with: a(t) = I£1 + α cos(2πfamt + φam) ¤ ψ(t) = 2πfst + β sin(2πfpmt + φpm) + φ) φk = (k − 1)2π3, k = 1, 2, 3
Note that null AM and PM indexes (α = 0 and β = 0) correspond to the stator current model in healthy conditions. In (1), the modulation terms are assumed to be in phase. This assumption can be verified by considering i1(t) + i2(t) + i3(t) = 0, ∀t.
B. Analytic signal via the Hilbert transform
The study of amplitude and/or phase modulation through the Wigner distribution requires the construction of a complex signal from the real observed signal for a univocal instanta-neous phase and amplitude definition [9]. The classical way to define the instantaneous phase and amplitude is to associate a complex signal to the measured real signal x(t) through the Hilbert transform (HT). The definition of the analytic signal
z(t) (2) can be given in the frequency domain [10] along the
frequency f .
Z(f ) = X(f ) + j£− j sgn(f )¤X(f ) = X(f ) + jH(f )X(f )
(2) where Y (f ) denotes the Fourier Transform of y(t).
with sgn(f ) = +1 for f > 0 0 for f = 0 −1 for f < 0
H(f ) = −j sign(f ) is the Hilbert filter transfer function.
Assume z(t) = a(t)ejψ(t) with a(t) non negative and ψ(t)
defined modulo 2π, then a(t) and ψ(t) are the instantaneous amplitude and phase respectively. Note that constructing the analytic signal via the Hilbert transform amounts to eliminat-ing negative frequencies in the spectrum. When a modulation transfers significative components into the negative frequen-cies, the Hilbert transform may yield misleading interpreta-tions [11]. Indeed, the Hilbert transform is submitted to the Bedrosian theorem conditions in case of modulated signals [12]. The main restriction is that the carrier frequency must be higher than the modulation frequency. When Bedrosian theorem conditions are respected, the analytic signal resulting from a stator current given in (1) expresses as (3).
˜ik(t) = a(t)eψ(t)−φk, k = 1, 2, 3 (3)
Thus, in order to obtain a complex signal, two compo-nents in quadrature have to be defined. Under Bedrosian theorem conditions, the Hilbert transform allows to compute a component in quadrature to a unique real signal. However, several mechanical faults produce high frequency modulations that do not respect the Bedrosian theorem conditions. In this
case, another method is proposed to construct an appropriate complex signal.
C. Space vector via the Concordia Transform
In case of three-phase electrical machines, three stator current measurements are available. From these measurements, two components in quadrature may be obtained through the Concordia transform (CT). This transformation, applied to a three-phase system that satisfies x1 + x2 + x3 = 0 along
time, can be expressed via the Concordia matrix in (4). Note that the matrix has been normalized for further interpretation. Applying this matrix to variables from a three-phase machine gives a two-phase quadrature system [13].
µ xα xβ ¶ = r 2 3 Ãq 3 2 0 1 √ 2 2 √ 2 ! µ x1 x2 ¶ (4) This transformation allows to obtain the two components of a space vector by using two electrical variables. Then, a complex vector is built ˜x(t) = xα(t) + jxβ(t) = a(t)ejψ(t).
This method is widely implemented in electrical drives for control purposes and thus can be used for electrical machines monitoring applications [5]. According to this definition, the Concordia transform provides the same results as the Hilbert transform when the Bedrosian theorem conditions are valid. However, when the Bedrosian theorem conditions are not valid, no restrictions exist on the definition of the complex signal using the Concordia Transform. Differences between analytic signal and space vector analysis are underlined in [8].
D. Wigner Distribution
The Wigner distribution (WD) is a time-frequency energy distribution. The WD Wz(t, f ) of a complex signal z(t) is
defined as (5) along time t and frequency f [10].
Wz(t, f ) = ∞ Z −∞ z³t + τ 2 ´ z∗³t − τ 2 ´ ej2πf τdτ (5)
where z∗ denotes the conjugate of z. The WD can be seen
as the Fourier transform (FT) of the kernel Kz(t, τ ) (6) with
respect to the delay variable τ .
Kz(t, τ ) = z ³ t + τ 2 ´ z∗³t −τ 2 ´ (6) III. WIGNERDISTRIBUTION OF MODULATED STATOR
CURRENTS
A. Wigner Distribution of steady state amplitude modulated stator currents
1) Wigner Distribution using Analytic signal of stator current: Considering an amplitude modulated stator current
according to the stator current model in (1) with φ = φam= 0
and β = 0, the FT I1(f ) of stator current i1(t) is expressed as
(7) where ∗ is the convolution product. The FT of the analytic signal equals (8).
I1(f ) = Ihδ(f ) +α 2 £ δ(f − fam) + δ(f + fam) ¤i ∗F T£cos(2πfst) ¤ (7) ˜ I1(f ) = Iδ(f − fs) +Iα2 δ(f − fs− fam) +Iα 2 δ £ f − sgn(fs− fam) (fs− fam) ¤ (8)
According to the expression of the analytic signal of AM signals (8), the WD is obtained. First of all, the resulting analytic signal ˜i1(t) is expressed in the time domain (9).
˜i1(t) = Iej2πfst+Iα2 ej2π(fs+fam)t
+Iα
2 esgn(fs−fam) j2π(fs−fam)t
(9) According to the general considerations concerning AM stator currents (α ¿ 1), terms that are proportional to α2
are neglected in the kernel computation, leading to (10) and to the WD (11). Ki1(t, τ ) = I 2ej2πfsτ+ I2α h cos(2πfamt)ej2π ¡ fs+fam2 ¢ τ + cos³2π£(1 − sgn(fs− fam))fs+ sgn(fs− fam)fam ¤ t´ ×ej2π £ (1+sgn(fs−fam))fs2−sgn(fs−fam)fam2 ¤ τi (10) Wi1(t, f ) = I 2δ(f − f s) +I2αhcos(2πf amt)δ ³ f − fs−fam2 ´ + cos³2π£(1 − sgn(fs− fam))fs+ sgn(fs− fam)fam ¤ t´ ×δ³f − (1 + sgn(fs− fam))f2s + sgn(fs− fam)fam2 ´i (11) When fs > fam, it can be noticed in (11) that the WD
expresses as (12). Wi1(t, f ) = I 2δ(f − f s) +I2α cos(2πf amt)δ ³ f − fs−fam2 ´ +I2α cos(2πf amt)δ ³ f − fs+fam2 ´ (12) In this case, the sideband components are sinusoidal of frequency fam. Moreover, the two oscillating sideband
com-ponents are in phase which is characteristic to low frequency amplitude modulated signals [2].
Obviously, according to (11), when fs < fam oscillating
components appear at fs+fam2 and fam2 with oscillating
fre-quency of famand 2fs−famrespectively (13). Consequently,
it becomes impossible to estimate the phase shift between sideband components and then to diagnose the AM.
Wi1(t, f ) = I 2δ(f − f s) +I2α cos(2πf amt)δ ³ f − fs−fam2 ´ +I2α cos(2π(2f s− fam)t)δ ³ f −fam 2 ´ (13)
2) Wigner distribution using space vector of stator currents:
Using the Concordia space vector, it can be demonstrated that the space vector resulting from amplitude modulated stator currents expresses as (14). Thus, the WD expresses as (12) whatever the values of fsand fam. The amplitude modulation
can thus be detected for any modulation frequency. ˜i(t) = Iej2πfst+Iα
2 ej2π(fs+fam)t
+Iα
2 ej2π(fs−fam)t
(14)
B. Wigner Distribution of steady state phase modulated stator currents
1) Wigner Distribution using Analytic signal of stator cur-rent: Considering a phase modulated stator current according
to the stator current model in (1) with φ = φpm = 0 and
α = 0, using the Jacobi-Anger expansion [14], the FT I1(f ) of stator current i1(t) is expressed as (15).
I1(f ) = I 2 P+∞ k=−∞Jk(β)δ(f − fs− kfpm) +I 2 P+∞ k=−∞Jk(β)δ(f + fs+ kfpm) (15)
where Jk(β) denotes the k-th order Bessel function of the
first kind.
Thus, considering β ¿ 1, the FT is simplified in (16) with
J0(β) ' 1, J1(β) ' β2 and J−1(β) = −J1(β). I1(f ) = I 2δ(f ± fs) +Iβ4 δ(f − fs− fpm) +Iβ4 δ(f + fs+ fpm) −Iβ4 δ(f − fs+ fpm) −Iβ4 δ(f + fs− fpm) (16) Thus, a general expression of the analytic signal depending on the sign of fs− fpmis given in (17) for fs6= fpm.
˜
I1(f ) = Iδ(f − fs) +Iβ2 δ(f − fs− fpm)
−Iβ2δ£f − sgn(fs− fpm)(fs− fpm)
¤ (17)
For β ¿ 1, terms proportional to β2 are neglected in the
computation of the Kernel Ki1(t, τ ), leading to (18) and to
the WD (19). Ki1(t, τ ) = I2ej2πfsτ+ I2β h cos(2πfpmt)ej2π ¡ fs+fpm2 ¢ τ − cos³2π£(1 − sgn(fs− fpm))fs+ sgn(fs− fpm) fpm ¤ t´ ×ej2π £ (1+sgn(fs−fpm))fs2−sgn(fs−fpm) fpm2 ¤ τi (18) Wi1(t, f ) = I2δ(f − fs) +I2βhcos(2πf pmt)δ ³ f − fs−fpm2 ´ − cos ³ 2π£(1 − sgn(fs− fpm))fs+ sgn(fs− fpm)fpm ¤ t ´ ×δ ³ f − (1 + sgn(fs− fpm))f2s + sgn(fs− fpm)fpm2 ´i (19) It can be noticed in (19) that when fs> fpm, that the WD
Wi1(t, f ) = I 2δ(f − f s) +I2β cos(2πf pmt)δ ³ f − fs−fpm2 ´ −I2β cos(2πf pmt)δ ³ f − fs+fpm2 ´ (20) In this case, the sideband components are sinusoidal of fpm
frequency. Moreover, the two oscillating sideband components are in phase opposition which is characteristic to low fre-quency phase modulated signals [2].
Obviously, according to (21), when fs < fpm, oscillating
components appear at fs + fpm2 and fpm2 with oscillating
frequency of fpm and 2fs− fpm respectively. Consequently,
it becomes impossible to estimate the phase shift between sideband components and then to diagnose the PM.
Wi(t, f ) = I2δ(f − fs) +I2β cos(2πf pmt)δ ³ f − fs−fpm2 ´ −I2β cos(2π(2f s− fpm)t)δ ³ f −fpm 2 ´ (21)
2) Wigner distribution using space vector of stator currents:
As a contrary, using the Concordia space vector, it can be demonstrated that the space vector resulting from phase modulated stator currents expresses as (22). Thus, the WD of a PM signal expresses as (20) whatever the values of fs
and fpm. The phase modulation can thus be detected for any
modulation frequency. ˜
I(f ) = Iδ(f − fs) +Iβ2δ(f − fs− fpm)
−Iβ2δ(f − (fs− fpm)) (22)
IV. SIMULATED MODULATED STATOR CURRENTS
A. Wigner distribution of modulated steady state stator cur-rents
Consider stator currents as given in (1). Fig. 1 shows the WD for high frequency AM simulated stator currents using the analytic signal and the space vector respectively. The chosen parameters are I = 10, fs = 50Hz, α = 0.1, β = 0,
fam = 80Hz and φ = φam = 0. It can be clearly seen
that the WD obtained with the Hilbert analytic signal does not allow to diagnose the amplitude modulation, due to the impossibility of evaluating the phase shift between upper and lower sideband components, as depicted in Fig. 1(a). However, the WD obtained with the Concordia space vector (see Fig. 1(a)) allows to diagnose the amplitude modulation by the evaluation of the phase shift between sideband components. The same conclusions may be achieved by simulating phase modulated stator currents.
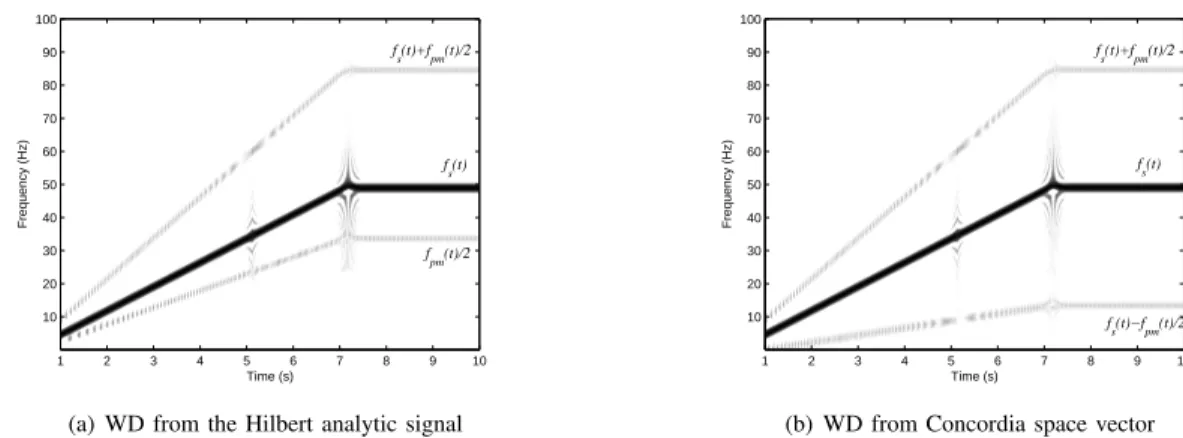
B. Wigner distribution of phase modulated variable frequency stator currents
Consider stator currents with a variable fundamental fre-quency at fs(t) and a variable frequency phase modulation
at fpm(t). It is demonstrated in [7] that the WD of variable
frequency stator currents with a variable frequency PM lies in a
central time varying component at fs(t) that is the
fundamen-tal component and sideband components. Fig. 2 depicts WD of simulated phase modulated stator currents with a variable supply frequency. The PM frequency equals fpm = 1.4fs,
consequently, the stator currents do not respect the Bedrosian theorem conditions. As for steady state conditions, the WD computed using Concordia space vector leads to sideband components at fs(t) ± fpm2(t) in phase opposition whatever
the supply frequency. However, the WD obtained through the Hilbert analytic signal leads to sideband components at
fs(t) +fpm2(t) and fpm2(t) frequencies.
Note that the two Wigner distributions are similar in variable frequency applications when the Bedrosian theorem conditions are satisfied. Finally, the Concordia space vector may be used in steady state and variable frequency three phase machines to estimate the WD and to diagnose the amplitude or phase modulation by estimating the phase shift between sideband components. The same conclusions may be achieved by simu-lating variable frequency amplitude modulated stator currents.
V. EXPERIMENTAL STATOR CURRENTS
A 5.5kW , 2 pole pair induction machine is supplied by an adjustable frequency PWM inverter. The motor is connected to a DC machine used as a load which is connected to a resistor through a DC/DC converter that controls the DC motor armature current. The reference current of the DC/DC converter is composed of an oscillating component plus an offset in order to induce load torque oscillations around a mean load torque value.
Experimental stator currents are measured on the machine in two steady state conditions, where the supply frequency equals fs = 13.3Hz and then fs = 50Hz with a load
torque oscillation of frequency fosc' 20Hz. Thus, the stator
currents are high and low frequency phase modulated signals. In Fig. 3(a), the WD is obtained through the Hilbert analytic signal. In Fig. 3(b), the WD is computed using the Concordia space vector. In low frequency modulation case, the two WD are similar with sideband components in phase opposition at fs ± fosc2 frequencies. However, it can be remarked in
high frequency modulation case that the WD computed using the Hilbert analytic signals leads to a sideband component at fs+ fosc2 frequency and a component at fosc2 frequency
oscillating at 2fs − fosc frequency. Only the WD using
the Concordia space vector leads to sideband components at
fs ± fosc2 frequencies oscillating at fosc frequency.
Conse-quently, it is demonstrated on real stator currents that the CT allows to detect the modulation using the WD for high and low frequency modulations in steady state conditions.
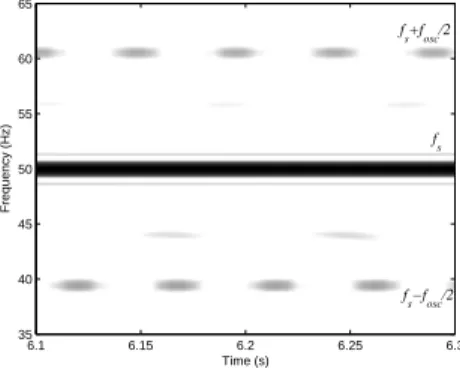
Moreover, Fig. 4 depicts a zoom of the WD obtained with the Concordia space vector in case of high frequency modulation (see Fig. 4(a)) and low frequency modulation (see Fig. 4(b)). In each case, the phase shift between sideband oscillating components may be evaluated. The sidebands com-ponents are almost in phase opposition, that is characteristic os phase modulation and proving the presence of load torque oscillations on the shaft of the machine.
Time (s) Frequency (Hz) 1 1.02 1.04 1.06 1.08 1.1 30 40 50 60 70 80 90 100 fs+fam/2 fam/2 f s
(a) WD using analytic signal
Time (s) Frequency (Hz) 1 1.02 1.04 1.06 1.08 1.1 0 10 20 30 40 50 60 70 80 90 100 fs+fam/2 fs−fam/2 fs
(b) WD using space vector Fig. 1. WD for high frequency AM simulated stator currents computed using HT and CT
Time (s) Frequency (Hz) 1 2 3 4 5 6 7 8 9 10 10 20 30 40 50 60 70 80 90 100 f s(t) fs(t)+fpm(t)/2 fpm(t)/2
(a) WD from the Hilbert analytic signal
Time (s) Frequency (Hz) 1 2 3 4 5 6 7 8 9 10 10 20 30 40 50 60 70 80 90 100 fs(t) fs(t)+fpm(t)/2 f s(t)−fpm(t)/2
(b) WD from Concordia space vector Fig. 2. WD for high frequency PM simulated stator currents computed using HT and CT with variable fundamental frequency
Time (s) Frequency (Hz) 2.5 3 3.5 4 4.5 5 5.5 6 6.5 7 7.5 10 20 30 40 50 60 70
High frequency modulations Low frequency modulations
(a) WD from the Hilbert analytic signal
Time (s) Frequency (Hz) 2.5 3 3.5 4 4.5 5 5.5 6 6.5 7 7.5 10 20 30 40 50 60 70
High frequency modulations Low frequency modulations
(b) WD from Concordia space vector Fig. 3. WD for high and low frequency PM experimental stator currents computed using HT and CT in steady state conditions
VI. CONCLUSION
Time-frequency analysis requires the definition of a com-plex signal. This paper has compared the Wigner distrib-ution obtained with the Hilbert and Concordia transforms in case of low and high frequency phase modulations. This comparison is first conducted theoretically and then through simulated and experimental signals. The application to the time-frequency diagnosis based on Wigner distribution is developed. The Concordia transform provides an appropriate signal representation in the low and high frequency modulation
cases. On the contrary, the Hilbert transform is limited, by the Bedrosian theorem conditions, to the analysis of low frequency modulation signals. Phase modulations, resulting from load torque oscillations, can be detected using the Wigner distribution of the complex signal. The Wigner distribution via Concordia transform provides a clear diagnosis of phase modulations through the estimation of the phase shift between sideband components whatever the modulation frequency. As a consequence, when at least two stator current components are available, the Concordia transform should be preferred to build the complex signal required for the time-frequency analysis.
Time (s) Frequency (Hz) 3.7 3.75 3.8 3.85 3.9 0 5 10 15 20 25 fs fs+fosc/2 fs−fosc/2
(a) High frequency PM
Time (s) Frequency (Hz) 6.1 6.15 6.2 6.25 6.3 35 40 45 50 55 60 65 fs fs+fosc/2 fs−fosc/2 (b) Low frequency PM Fig. 4. Zoom of the WD from the Concordia space vector
VII. REFERENCES
[1] W. T. Thomson,”On-line current monitoring to detect electrical and mechanical faults in three-phase induction motor drives”, in Proc. 1994
International Conference on Life Management of Power Plants, pp.
66-73.
[2] M. Blodt, J. Regnier and J. Faucher, ”Distinguishing Load Torque Oscillations and Eccentricity Faults in Induction Motors Using Stator Current Wigner Distributions”, in Proc. 2006 Industry Applications
Conference, Vol. 3, pp. 1549-1556.
[3] B. Trajin, J. Regnier, J. Faucher, ”Bearing Fault Indicator in Induction Machine Using Stator Current Spectral Analysis, in Proc. 2008 Power
Electronics Machine and Drives Conference, pp. 592-596.
[4] P. Vas, Electrical Machines and Drives - A space-vector theory
ap-proach, Oxford Science Publications, Oxford, 1992.
[5] J. Zarei and J. Poshtan, ”An Advanced Park’s Vectors Approach for Bearing Fault Detection”, in Proc. 2006 IEEE International Conference
on Industrial Technology, pp. 1472-1479.
[6] J. L. H. Silva and A. J. M. Cardoso, ”Bearing failures diagnosis in three-phase induction motors by extended Park’s vector approach”, in Proc.
2005 31st Annual Conference of IEEE Industrial Electronics Society,
pp. 2591-2596.
[7] M. Blodt, D. Bonacci, J. Regnier, M. Chabert and J. Faucher, ”On-Line Monitoring of Mechanical Faults in Variable-Speed Induction Motor Drives Using the Wigner Distribution”, IEEE Transactions on Industrial
Electronics, Vol. 55, n. 2, pp. 522-533, Feb. 2008.
[8] B. Trajin, M. Chabert, J. Regnier and J. Faucher, ”Space vector analysis for the diagnosis of high frequency amplitude and phase modulations in induction motor stator current”, in Proc. 2008 Condition Monitoring
and Machinery Failure Prevention Technologies
[9] B. Picinbono, ”On instantaneous amplitude and phase signal”, IEEE
Transactions on signal processing, Vol. 45, n. 3, pp. 552-560, Mar. 1997.
[10] P. Flandrin, Time-Frequency/Time-Scale Analysis, San Diego, Academic Press, 1999.
[11] B. Boashash, ”Estimating and interpreting the instantaneous frequency of a signal - Part 1 : Fundamentals”, Proceedings of the IEEE, Vol. 80, n. 4, pp. 520-538, Apr. 1992.
[12] E. Bedrosian, ”A product theorem for Hilbert Transforms”, Proceedings
of the IEEE, Vol. 51, n. 5, pp. 868-869, May 1963.
[13] J. M. Aller and A. Bueno and T. Pag`a, ”Power System Analysis using Space-Vector Transformation”, IEEE Transactions on power systems, Vol. 17, n. 4, Nov. 2002.
[14] M. Abramowitz, I. A. Stegun, Handbook of Mathematical Functions
with Formulas, Graphs, and Mathematical Tables, Dover Publications,
New York, nineth ed., 1964.
VIII. BIOGRAPHIES
Baptiste Trajin was born in Rouen (France) on September 4, 1982. He received the engineering degree in electrotechnology and automation from the Ecole Nationale Superieure d’Electrotechnique, d’Electronique, d’Informatique, d’Hydraulique et des Telecommunications (ENSEEIHT), Toulouse and the Master degree in electrical engineering from the Institut National Polytechnique de Toulouse, Toulouse, France, in 2006. Parts of his work have been published in conference proceedings such as Power Electronic Machines and Drives 2008, Industrial Symposium on Industrial Electronics 2008 or Condition Monitoring 2008. Trajin has been a student member of the IEEE society since 2008.
Marie Chabert was born in 1970. She received the Engineering degree from the engineering school Ecole Nationale Sup´erieure d’Electrotechnique, d’Electronique, d’Informatique, d’Hydraulique et des T´el´ecommunications (ENSEEIHT), Toulouse, France, in 1994 and the Ph.D. degree from In-stitut National Polytechnique de Toulouse, Toulouse, in 1997. She joined ENSEEIHT in 1998 as an Assistant Professor. Her research activity focuses on estimation, detection and wavelet transform.
Jeremi Regnier was born on April 24, 1975. He received the Ph.D. degree in electrical engineering from the Institut National Polytechnique de Toulouse (INPT), Toulouse, France, in 2003. Since 2004, he has been working as an Assistant Professor with the Electrical Engineering and Control Systems Department. He is also a researcher with the LAboratoire sur les PLAsmas et la Conversion d’Energie (LAPLACE), Toulouse. His research interests include modeling and simulation of faulty electrical machines and drives as well as the development of monitoring techniques using signal processing methods. Regnier is also an IEEE member.
Jean Faucher received the diploma degree in electrical engineering from the Institut National Polytechnique (INP) de Toulouse, Toulouse, France, in 1967, and the Docteur-Ingenieur (Ph.D.) and Docteur es Sciences degrees on switched reluctance machines, in 1969 and 1981, respectively. Since 1985, he has been a Full University Professor with INP Toulouse, teaching in electrical and control engineering. He is a researcher with the LAboratoire sur les PLAsmas et la Conversion d’Energie (LAPLACE), Toulouse. His research interests include information processing and modeling of electrical machines and static converters for fault diagnosis, monitoring, and simulation. Pr. Faucher was in charge of international relationships for INP Toulouse from 2005 to 2008 and is a IEEE Member.